Abstract
The United States of Broadband map attempts to fill the gap in understanding between the advertised speed data that internet service providers report to the FCC and actual speeds experienced by Americans. The measured speed data is based on billions of speed tests conducted through Measurement Lab’s platform. Almost 900,000 measurements are collected per day by Measurement Lab in the United States. You can compare the median upload and download speeds at the census tract, county, zip code, State House, and State Senate levels. You can also compare this data to the median advertised speed data that internet service providers report to the FCC as available.
Acknowledgments
This map would not have been possible without help from the Community Broadband Networks Initiative, the Institute for Local Self-Reliance, Measurement Lab, X-Lab, and David Winslow.
*Updated 2:45pm on August 28, 2019. The opening paragraph was struck, and the subtitle and remaining paragraph were updated to clarify that this mapping tool displays broadband speed data—it is not a map of broadband availability. The remaining paragraph was also updated to provide more insight into the tool’s functionality and to correct the description of exactly what data the tool relies upon, including changing “people” to “measurements” and changing "the datasets" to "median upload and download speeds." We also changed "you can challenge" to "you can also compare" to clarify that the tool does not provide a mechanism for filing challenges. Nick Thieme was added as an author. The title of the section “key principles” was changed to “related principles” to reflect the breadth of the principles.
The United States of Broadband Map
Different internet speed tests take different approaches. To begin with, “internet speed” isn't a precise phrase, as there is no standard for internet speed measurement (more on that here). This leads to a lot of ambiguity. Should a speed test measure the speed at which the computer accesses content from the internet? If so, what kind of computer should be used to measure the speed? Where in the world should the files be located? Is tracking advertised speeds sufficient?
Measurement Lab (M-Lab) provides one such response to those questions. M-Lab is an internet speed test platform that allows anyone to test their internet connection. (M-Lab was housed at New America’s Open Technology Institute for a decade until early 2019, when it joined Code for Science & Society.) In fact, it is embedded at the top of the Google search results for “internet speed test.” The data generated from these tests is open for all to use and the measurement tools themselves are open source, so unaffiliated developers can also help improve the platform.
M-Lab is designed to determine the speed at which the user accesses data outside the user’s internet service provider’s (ISP) network. This approach provides the most accurate reflection of the user’s experience because most data that users access sits outside the ISP’s network. Other tests mainly measure speeds at which the user accesses data inside the ISP’s network, which is likely to overstate the actual speed that the user experiences.
Currently, the only standardized data collection on broadband deployment speeds is at the Federal Communications Commission (FCC), but its approach is flawed. Through the FCC’s Form 477, ISPs submit data about which areas of the country have access to high-speed broadband and the advertised speeds in those areas, which the FCC puts into a broadband map.
However, Form 477 data is self-serving and inaccurate. First, a census block is considered “served” as long as one address in the entire block has access. This approach leads to overstated availability, especially in rural areas where census blocks are large, and an entire region could be wrongly considered to have access to high-speed broadband. Second, ISPs are required to report only the speeds that they could feasibly provide to households, not the speeds they actually provide.
We need more and better data. The United States of Broadband (USBB) map attempts to fill the gap in understanding between the FCC’s data and the actual speeds experienced by Americans, based on billions of speed tests conducted through M-Lab’s platform. Almost 900,000 measurements are collected per day by Measurement Lab in the United States. You can compare the median upload and download speeds at the census tract, county, zip code, State House, and State Senate levels. You can also compare this data to the median advertised speed data that internet service providers report to the FCC as available.
*Updated 2:45pm on August 28, 2019. The opening paragraph was struck and the final paragraph was updated to clarify that this mapping tool displays broadband speed data—it is not a map of broadband availability. The final paragraph was also updated to provide more insight into the tool’s functionality and to correct the description of exactly what data the tool relies upon, including changing “people” to “measurements” and changing "the datasets" to "median upload and download speeds." We also changed "you can challenge" to "you can also compare" to clarify that the tool does not provide a mechanism for filing challenges.
Related Principles
Digital Divide
The digital divide refers to the gap between Americans who have access to high-speed broadband—and the opportunity that comes with that connectivity—and those who do not. The digital divide is one of several metrics used by researchers and advocates to track the opportunity and privilege gap. Those with high-speed broadband access have an easier connection to education, employment, financial, information, government, healthcare, entertainment, and communication services that all primarily live online. Those without access are forced to navigate additional barriers to these services, or may be unable to access them entirely.
Research shows that marginalized communities, rural Americans, and low-income Americans are overwhelmingly on the wrong side of the digital divide. In particular, the digital divide disproportionately harms communities of color, even when taking cost into account. As Free Press found in what’s arguably the most in-depth research on the racial digital divide to date, “There is still a racial/ethnic digital divide even among persons in the lowest-income quintile. Among those with annual family incomes below $20,000, 58 percent of Whites have home-internet access versus just 51 percent of Hispanics and 50 percent of Black people in the same income bracket.”
The digital divide is particularly noticeable when it comes to education. This “homework gap” refers to the divide between children with and without a high-speed broadband connection at school and/or at home. Essentially, some students are able to complete their homework, research their projects, and dive into personal interests using home or school internet, while students without access either can’t engage in those activities altogether, or are forced to seek out public internet to finish homework—sometimes in the parking lots of fast-food restaurants. This homework gap affects students of color and students from low-income households at much higher rates.
One program designed to address the digital divide and homework gap is the Lifeline program. Lifeline started under President Reagan, was updated under President George W. Bush, and was further updated under President Obama. Today, the program subsidizes phone and internet service for low-income Americans to help defray the high costs of high-speed internet. The program has recently come under attack through severe proposed cuts, and OTI has fought those attacks.
OTI’s Work
Cost of Internet Access
Several studies have shown that the high cost of internet access is the biggest barrier to broadband adoption for Americans. Despite the fact that a reliable, high-speed broadband connection is vital for accessing services related to work, education, healthcare, information, news, entertainment, finances, and communication, many Americans simply cannot afford to pay for a high-speed internet connection. OTI has conducted several studies in the past that showed that the majority of U.S. cities surveyed paid more money for slower internet access than cities abroad.
However, the FCC does not collect any data about how much ISPs charge their customers for a high-speed connection and whether consumers actually receive those advertised speeds. While some pricing information is public, ISPs often keep that information secret, despite the fact that they are the only source with comprehensive pricing information.
The absence of reliable broadband pricing data leaves the public in the dark as to how broadband pricing trends have evolved over time and geography, which is a vital piece to the puzzle in bridging the digital divide.
OTI’s Work
Net Neutrality
Net neutrality is the principle that internet service providers (ISPs) should not unreasonably interfere with online traffic. Net neutrality is, and has long been, essential for the integrity of the internet. For instance, a neutral internet is necessary to ensure the success and viability of small businesses and to ensure they can reach their customers. A neutral internet is also key to ensuring that marginalized communities can reach audiences that more traditional forms of media do not allow them to reach—which makes net neutrality a civil rights issue. However, ISPs have the ability and incentive to undermine a neutral internet for their own gain, either by imposing tolls on downstream services to extract more money from them, or by favoring their own affiliated content at the expense of competitors.
To prevent ISPs from engaging in practices contrary to net neutrality, consumers need strong rules from the FCC that prohibit ISPs from blocking and throttling lawful content on websites, from engaging in “paid prioritization” schemes that result in slow and fast lanes for internet traffic, and from implementing other practices like interconnection abuse and anticompetitive zero rating programs.
In 2015, the FCC passed strong net neutrality rules focused on consumer protection. Those rules enjoyed broad bipartisan support. In a major win for the FCC and for consumers, the D.C. Circuit upheld that Order twice on appeal.
But in 2017, new FCC Chairman (and former Verizon attorney) Ajit Pai repealed the 2015 rules. Under the new rules, which rely exclusively on an ISP being “transparent” about its network management practices, users have to depend merely on ISPs’ promises that they will not violate net neutrality. Disclosure requirements are hardly sufficient when the broadband market is plagued with a lack of competition. What is a customer supposed to do if there is no alternative to switch to? And even if disclosure requirements were somehow sufficient to protect consumers, we’ve already seen ISPs step back their promises.
Efforts to fight the net neutrality repeal have been widespread: the repeal has been challenged by a bipartisan effort in Congress (one that resulted in the eventual House passage of a bill in 2019), by public interest organizations and the tech industry in courts, and by states (in the courts and state legislatures and governors’ offices).
It is vital these rules are restored as soon as possible.
OTI’s Work
- OTI Comments urging FCC to keep Net Neutrality rules
- OTI Reply Comments urging FCC to keep Net Neutrality rules
- Small Businesses Rely on Open Internet Protections
- OTI Moves Forward with Net Neutrality Lawsuit
- The American People Broadly Support Net Neutrality
- Beyond Frustrated: The Sweeping Consumer Harms as a Result of ISP Disputes
*Updated 2:45pm on August 28, 2019. The title of this section has been changed from “key principles” to “related principles” to reflect the breadth of the principles.
How Did North Dakota Become the Crown Jewel of the Internet in the Midwest?
By Nick Thieme
This article originally appeared in the New America Weekly.
There’s a strand of coastal conventional wisdom that views anything west of the Appalachian Mountains and east of the Sierra Nevada as impossibly outdated. Technology is born in Silicon Valley and Washington state, flies to New York City and Washington, D.C., and 20 years down the road, shows up for use on Main Street—if the residents in these “flyover” states are lucky. If you believe that, I encourage you to play the video game Fortnite in Grand Forks, North Dakota, where internet speeds are nearly three times the national average. You’d be in for a surprise.
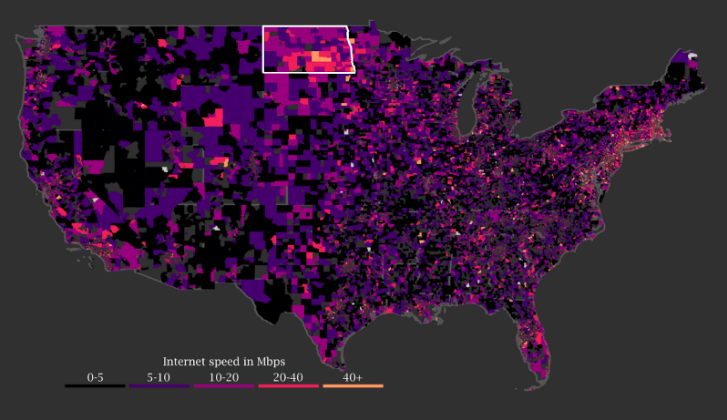
Even if I hadn’t outlined it on the map above, North Dakota is easy to spot because it visibly outperforms its neighbors. Most Midwestern and Mountain states are dominated by connection speeds between 0 and 20 Mbps, with many census tracts—the Census Bureau’s name for the next-smallest area after counties—on the lower end of that range. North Dakota, however, sees rural tracts breaking 40 Mbps. For rural communities, many experiencing related population loss and slow job growth, establishing high-speed internet is now a necessity, much the same way the rural electrification of America was in the 1930s and ’40s. Like electricity, faster broadband has well-documented economic effects, with, among others, a 2013 study estimating that a 4 Mbps increase in internet speed increased annual household income by $2,100.
Put another way, the Peace Garden state looks overwhelmingly brighter because an overwhelming percentage of it is brighter. A higher percentage of its census tracts, the smallest visual units on the chart, have high broadband speeds. With brightness approaching uniformity, North Dakota is different from most coastal states, which typically have fast internet in their major cities, suburbs, and exurbs, but slow internet everywhere else.
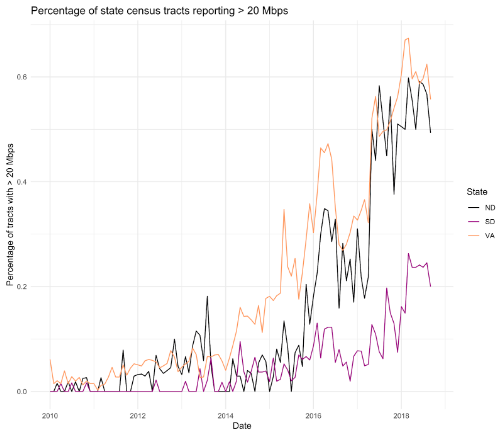
Compare, for instance, the percentage of census tracts with speeds above 20 Mbps in North Dakota to the percentage in its southern twin, South Dakota. I’ve thrown in a coastal state, Virginia, for additional comparison. Up until about 2016, North and South Dakota had similar rates of census-level high-speed internet adoption. In 2016, though, North Dakota’s tract speeds increased dramatically, turning it into the crown jewel of the internet in the Midwest.
What happened? What changed in North Dakota—and how might that plan be copied and pasted throughout the rest of rural America?
First, the federal government helped. In 2009, Congress and former President Barack Obama passed the American Recovery and Reinvestment Act to stimulate the economy. That law created the Broadband Technology Opportunities Program (BTOP), which invested significantly in North Dakota’s broadband infrastructure. The BTOP created a state broadband program office within the North Dakota Information Technology Department, paid to install hundreds of miles of high-speed fiber cable, and connected several universities in North Dakota to a broader network of high-speed “anchor networks.” So, unfortunately, while funding an infrastructure bill that includes broadband is one of the few projects both Democrats and Republicans will stump for, it’s unlikely that even a bipartisan bill will give carte blanche to expand internet infrastructure the way recovery efforts after the Great Recession did.
But North Dakota’s internet surge has an additional explanation, and this one is easier to reproduce. Rural cooperatives, or co-ops, made up of local service providers are major internet players in North Dakota. The Institute for Local Self-Reliance released a map of rural co-op internet coverage, and on it, North Dakota is as much an outlier as it is on the speed map.
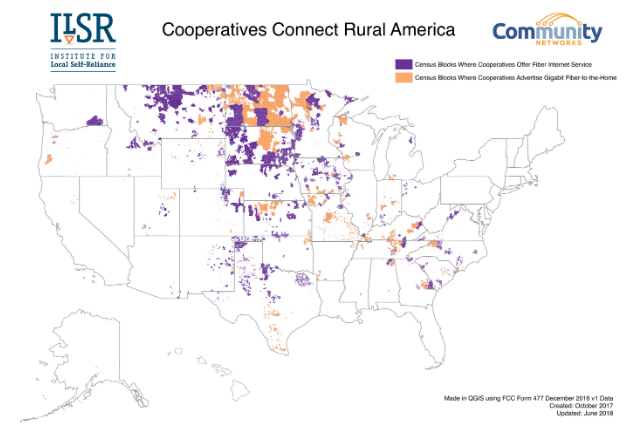
Co-ops including the Dickey Rural Telephone Company, the Dakota Central Telecommunications Cooperative, and a co-op of co-ops, the Dakota Carrier Network(DCN), cover much of North Dakota, and provide broadband to many of its residents. Like electric co-ops that brought light to rural America when bigger companies deemed it unprofitable, and telephone co-ops that did the same decades later, internet coops provide a modern keystone technology, one widely available elsewhere, to rural communities. Being able to download millions of documents in a few seconds or video chat with five people in five countries in real-time are stupefying feats of technology made casual by their decade of urban availability. Co-ops are doing the good work of making the magical mundane by turning it commonplace.
Part of co-ops’ effort involves close connection with the state government’s closed broadband network STAGEnet. DCN has built out and upgraded STAGEnet, helping to bring high-speed internet to government buildings and schools, with a project in place to make North Dakota the first state with gigabit connections in all schools.
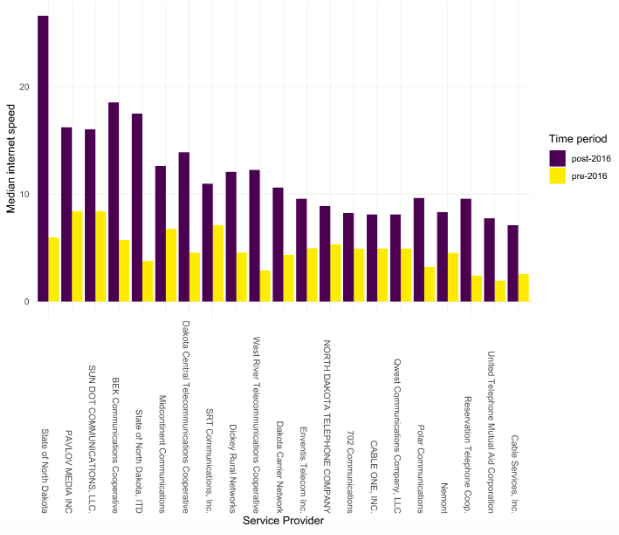
Indeed, a breakdown of internet speeds by service provider before and after 2016 confirms both that co-ops and the state government have played a huge role in the changes, and that the North Dakota internet market is characterized by co-ops. Of the providers whose customers ran over 5,000 tests both before and after January 2016, the largest improvements were seen by co-ops and the state of North Dakota (STAGEnet). Of these 21 companies, only seven weren’t involved in cooperatives.
North Dakota’s unique telecoms history has led to internet connectivity and speeds that other largely rural states have yet to achieve. The cooperative nature of North Dakota’s telecoms industry is a central part of that success story. It’s not worth suffering another Great Recession to secure better internet. But neither is it necessary. A more cooperative internet marketplace seems to do the same just fine.
Support for this article was provided by RiseLocal, a project of the New America National Network.
More About the Authors