
Using the open source tools and infrastructure provided by Measurement Lab (M-Lab), 16,696 Network Diagnostic Tool (NDT) measurements were collected from ACPS school connections over a two month period during the spring of 2016. Initial analysis confirmed that the district was using bandwidth caps for quality of service (QoS). QoS bandwidth caps are typically used to limit the total upload or download speeds for each device on a network in order to distribute the available bandwidth equitably. Having both capped and non-capped measurements provided a means to compare connections using QoS and non-QoS caps. Differences between bandwidth and latency were then examined, and finally other causes of latency such as upstream peering arrangements were explored. Latency measurements examine the quality of a connection, for example round trip time and packet re-transmission rate. Round trip time is the time it takes for a data packet to get from its origin to its destination and back, and packet retransmission rate is a percentage of how often data packets need to be re-sent to complete a web request.
Bandwidth Caps Used for Quality of Service
Quantitative data analysis confirmed the presence of network Quality of Service (QoS) bandwidth caps on devices connecting to the wired network in classrooms. In the two charts below, the first showing download measurements faceted by classroom and school location, and the second showing upload measurements faceted by school location, there are caps in the measurements for all elementary school classrooms. Download speeds appear limited to ~100 mbps and upload speeds were limited to ~70 mbps.

All download measurements in elementary classrooms peak around 100 mbps, as seen here in rooms 9, 26, and 47. High school classroom B323 shows the same cluster of tests below 100bps but additionally had a mixture of QoS and non-QoS limited measurements.
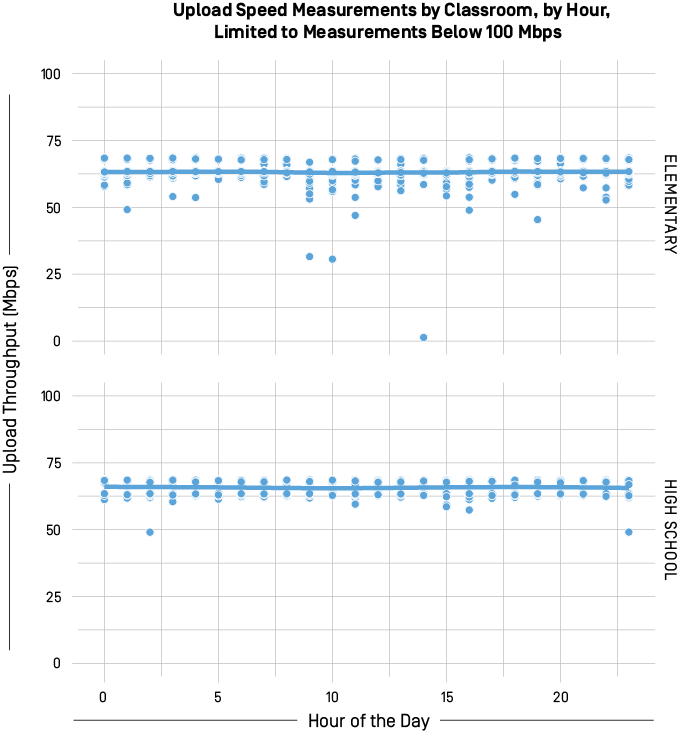
QoS limits are clearly observable in this comparison of upload measurements at elementary and high school locations.
That QoS limits were found to be in place on most classroom connections confirms that ACPS’ network management practices were successfully being applied. For this study, it means that most of the data collected were measurements of the network controls, not measurements of the total capacity of the connection. However, since data collected in two locations did not have bandwidth controls applied to all measurements, those data reflect the uncapped speeds of the district’s internet connection.
Next, the team compared measurements from non-QoS limited connections to those did have QoS limits in place. The following tables show the numeric summaries for comparison. The median values for download and upload speeds are highlighted to show the difference in speeds, as well as the median values for latency metrics.Numeric Summary - QoS Limited Measurements
| Download Speed (Mbps) | Upload Speed (Mbps) | Min RTT (ms) | Avg RTT (ms) | Packet Retrans. Rate (%) | |
|---|---|---|---|---|---|
| Min | 0.328 | 1.36 | 1.000 | 3.799 | 0.000 |
| 1st Quantile | 78.710 | 62.92 | 3.000 | 6.662 | 0.002 |
| Median | 88.247 | 63.20 | 4.000 | 7.475 | 0.004 |
| Mean | 81.252 | 63.20 | 4.843 | 8.073 | 0.004 |
| 3rd Quantile | 91.030 | 63.38 | 8.000 | 10.221 | 0.005 |
| Max | 92.446 | 68.55 | 28.000 | 28.432 | 0.225 |
Values are in Megabits per second (Mbps), milliseconds (ms), or percentage (%) as indicated.
Source: “Broadband in Schools Github Repository - QoS Limited Numeric Summary,” Open Technology Institute.
Numeric Summary - Non-QoS Limited Measurements
| Download Speed (Mbps) | Upload Speed (Mbps) | Min RTT (ms) | Avg RTT (ms) | Packet Retrans. Rate (%) | |
|---|---|---|---|---|---|
| Min | 14.17 | 135.4 | 2.000 | 2.703 | 0.0000 |
| 1st Quantile | 185.47 | 219.6 | 3.000 | 3.466 | 0.0009 |
| Median | 234.43 | 283.3 | 3.000 | 3.750 | 0.0014 |
| Mean | 243.38 | 264.2 | 3.877 | 4.580 | 0.0016 |
| 3rd Quantile | 286.91 | 294.0 | 4.000 | 4.348 | 0.0021 |
| Max | 662.86 | 330.0 | 13.000 | 11.885 | 0.0194 |
Values are in Megabits per second (Mbps), milliseconds (ms), or percentage (%) as indicated.
Source: “Broadband in Schools Github Repository - Non-QoS Numeric Summary,” Open Technology Institute.
These data show that for tests from non-QoS limited connections, the median speeds that ACPS’s wide area network gets are 234 mbps down and 283 mbps up. These findings emphasize that when designing a measurement initiative for assessing managed networks, an inventory of network constraints such as QoS limits should be conducted in advance, and the locations from which measurement tests are run should be chosen based on the intended measurement goals. As an example, a school might conduct measurements from a device connected to a switch near their internet connection, on an un-managed port, in order to collect baseline measurements of their network’s total capacity, and multiple measurement devices inside classrooms to measure different parts of the network with potentially different QoS controls.
Relationship between Bandwidth and Latency
The measurements comparing test data from QoS limited and non-QoS limited connections suggest that classroom connections (QoS limited), in addition to having throttled speeds, also have higher general latency. MinRTT is the minimum latency measured in transmissions from the server to the client, reported in milliseconds. In comparison, AvgRTT is the average latency of data transfers from the server to the client and is calculated as the sum of round trip times sampled during the test against the number of samples, also reported in milliseconds. Consequently AvgRTT is a latency measurement when the connection is under load during the test, and MinRTT is a latency measurement when the connection is not under load. In the numeric summaries in the previous section, we highlighted the median values for the latency measurements, Average Round Trip Time (AvgRTT) and Minimum Round Trip Time (MinRTT).
The following charts show download and upload measurements indexed by MinRTT values, for QoS Limited tests. Very few upload measurements were below 45 mbps and most MinRTT measurements were below 20ms, so upload tests below 45 mbps are eliminated as outliers, along with all tests where MinRTT is above 20ms. For comparison, the same graphs are also shown for speed measurements indexed by MinRTT for non-QoS limited tests. Finally, a comparison of AvgRTT and MinRTT for download measurements where either metric is below 20ms is shown in the chart below, Average RTT/Minimum RTT for QoS Limited Download Measurements.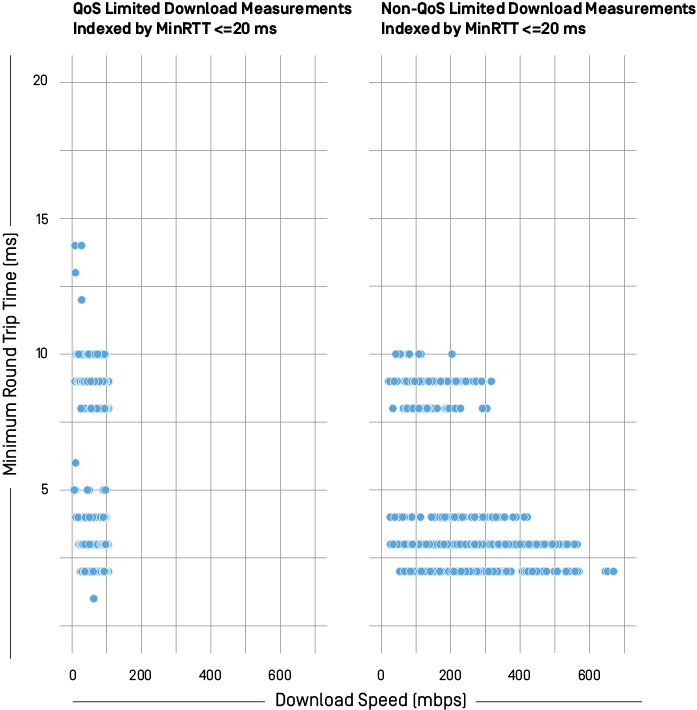
Source: “Broadband in Schools Github Repository - Figure 9,” Open Technology Institute, accessed May 9, 2017, https://github.com/opentechinstitute/bb-schools-analysis/blob/master/initial-data-analysis.R#L138

Source: “Broadband in Schools Github Repository - Figure 11,” Open Technology Institute, accessed May 9, 2017, https://github.com/opentechinstitute/bb-schools-analysis/blob/master/initial-data-analysis.R#L149

Source: “Broadband in Schools Github Repository - Figure 12,” Open Technology Institute, accessed May 9, 2017, https://github.com/opentechinstitute/bb-schools-analysis/blob/master/initial-data-analysis.R#L160
An interesting observation in the charts above is the clear clustering of tests when download or upload throughput is paired with MinRTT. When AvgRTT is compared to MinRTT (Average RTT/Minimum RTT for QoS Limited Download Measurements), there are similar clusters on both metrics, between 2-5ms and between 7.5-10ms. If a connection has decent speeds but high latency, the user experience of accessing content that requires low latency would be affected. For example, if a user was streaming a video, high latency on the connection would likely cause buffering, even if the speed of the connection was fast.
There are many factors influencing latency on the path to content, making cause difficult to assess. A school district purchases an internet connection, but how well the ISP is connected or “peered” with other ISPs can affect the user experience by introducing additional latency between the user and the content they are trying to reach.
Latency of the Path to Content and Differences in Upstream Peering
The internet is an interconnected network of networks—all running common protocols that make the experience of browsing the internet relatively seamless. Home users, businesses, and schools purchase an internet connection from an ISP. These ISPs provide subscribers with access to the internet, by connecting their networks to transit ISPs. Transit ISPs provide connection to the internet itself, where most content we use as consumers is hosted.
To provide diversity in connectivity, M-Lab deploys multiple redundant “server pods” in most metropolitan regions, with each pod connected to a different upstream transit provider available in that region. In this way, examining M-Lab test data segmented by a named M-Lab server can show differences in measurements solely on the peering connectivity between the client ISP and the transit ISP connected to the M-Lab server.
By grouping our measurements by transit provider, the previous clustering is largely accounted for, as shown in the next series of charts. For QoS limited and non-QoS limited download and upload measurements, latency in the 7.5 - 10ms range is clustered in tests which ran through Level 3 connected M-Lab servers.

Source: “Broadband in Schools Github Repository - Figure 14,” Open Technology Institute, accessed May 9, 2017, https://github.com/opentechinstitute/bb-schools-analysis/blob/master/initial-data-analysis.R#L177

Source: “Broadband in Schools Github Repository - Figure 16,” Open Technology Institute, accessed May 9, 2017, https://github.com/opentechinstitute/bb-schools-analysis/blob/master/initial-data-analysis.R#L188
This finding suggests that at the time of testing, tests conducted between the ACPS network and Level 3 had higher latency than those tests conducted through other peered transit providers. It is also an indicator that the issues teachers or students experience when accessing online content, testing platforms, or other online services can also be caused by other factors outside of the school’s network and available bandwidth. The path to content and the hosting/peering arrangements of content providers and ISPs affect the delivery of content, notwithstanding the considerations schools make in provisioning their networks.

