By the Numbers: Changes in Graduate Student Debt Over Time

This is the second installment of our ‘By the Numbers’ series, in which we dig into nationally representative higher education survey data recently released by the U.S. Department of Education. Our first post examines trends in nontraditional student enrollment, and our third post looks at the implications of private and institutional loan debt.
While graduate students make up about 15 percent of all enrollment in higher education, their numbers have remained relatively flat over recent years. Despite this, graduate students make up a disproportionate share of the federal loan portfolio, receiving about 35.7 billion in disbursements in the 2016-17 school year, or over a third of the federal student loan program. The most recent National Postsecondary Student Aid Study allows us to better understand graduate borrowing and how it has changed over time.
Borrowing Holds Steady while Net Price Increased Over Time
Forty-four percent of graduate students took on at least one student loan in the 2015-16 school year, and across all students, the average debt load from all sources was $10,317 in 2016 dollars. The average net price of $11,430 paid was actually higher than the total borrowed–a reversal from previous years. In general, both borrowing and prices have both doubled since the 1999-2000 school year, even after adjusting for inflation. However, the share of graduate students who borrow has remained relatively consistent since at least the 2007-08 school year.

Borrowing and Net Price Vary Across Students and Schools
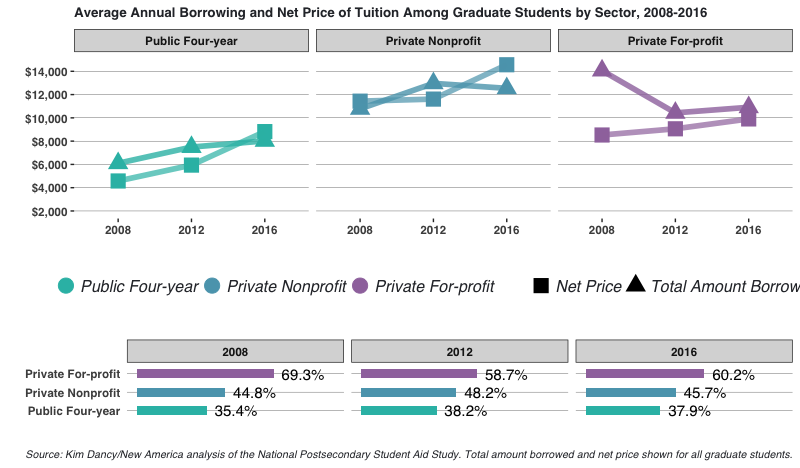
Comparing net price and total debt levels across sectors, we see that graduate students today borrow the largest sums to attend private nonprofit universities, and that borrowing at private for-profit institutions has fallen by nearly $6,000 since the 2007-08 school year, even as the net prices paid by students at those schools have increased. For students at public and private non-profit institutions, the net price of tuition in 2015-16 was actually higher than the total amount students took on in loans, indicating that on average these students’ borrowing is now being driven primarily by tuition costs, rather than living expenses.
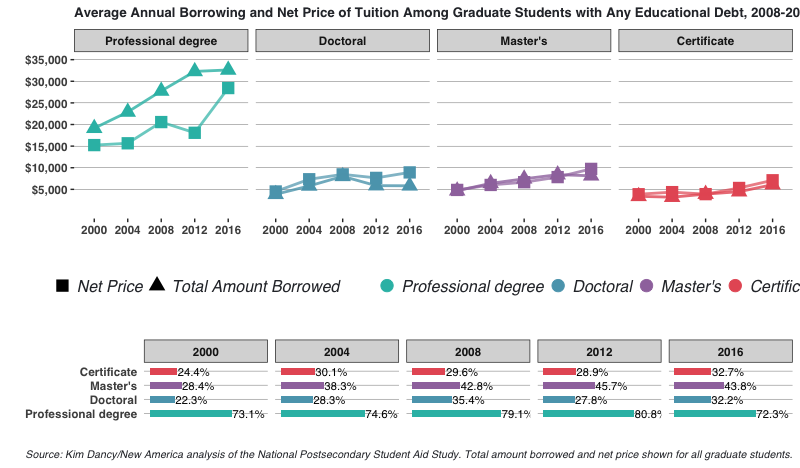
Much more variation occurs when comparing students’ degree type. Students in professional degree programs like law and medicine borrow the largest sums, paying the most in net tuition, and experiencing the fastest rate of growth in both tuition paid and total amount borrowed over the last 16 years. Contrary to students in all other degree programs, the amount borrowed for students in professional programs exceeds the amount they paid in tuition even after accounting for grant aid. However, the share of students who borrow in these programs has actually fallen between 2012 and 2016, while the share borrowing in other degree programs has either increased or remained flat.
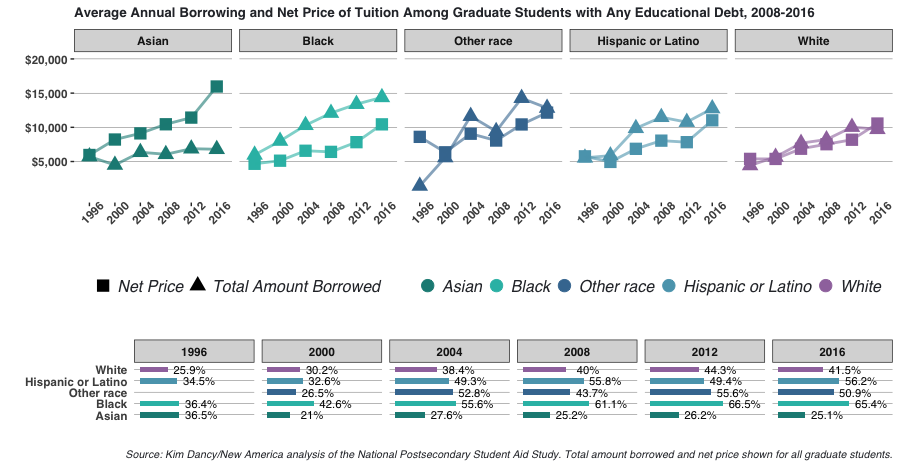
In addition to differences in borrowing by degree program, there are several key racial differences. In general, the amount borrowed by Asian students is lower than that of any other racial group, and has grown relatively little over the last twenty years. This is true despite the fact that Asian students pay the most to attend school, paying more than $15,000 dollars in the 2015-16 academic year. In contrast, African American students borrow the most of any racial group, despite attending schools with similar price points. For white and Hispanic students, the average amount borrowed tracks more closely with the net price of tuition, indicating that these students are borrowing close to the full amount they are charged, but are not borrowing significant amounts for living costs.
Most Graduate Student Borrowing is Driven by Direct Unsubsidized Loans
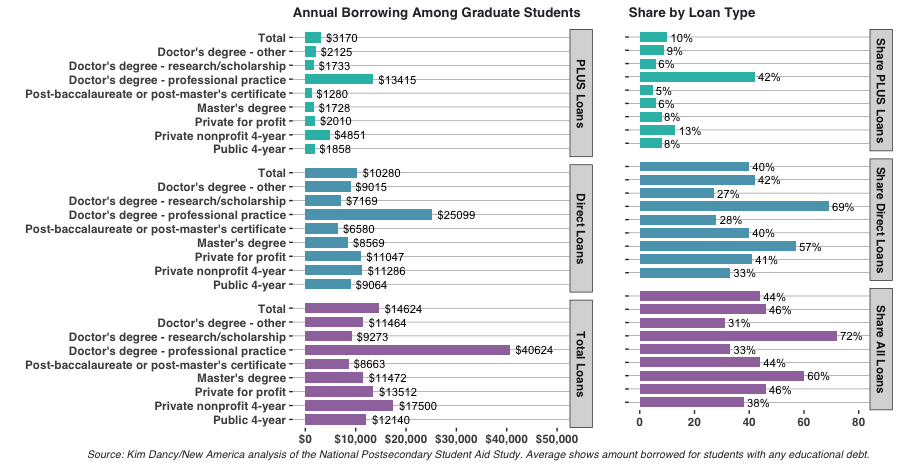
The types of loans that graduate students rely upon vary significantly by degree program. Borrowing of Graduate PLUS loans was relatively rare in 2015-16, with just 10 percent of borrowers turning to these loans. However, students in professional degree programs (including law, medicine, veterinary and others) borrowed PLUS loans 42 percent of the time, and took out an average of $13,000 in PLUS loans on top of any other educational debt. As a result, these students also had the highest rates of annual borrowing, taking on an average of $40,624 from all sources for a single academic year. In contrast, students in research-oriented doctoral programs borrowed less than $10,000 in 2015-16 across all loan sources.
The Majority of Cumulative Borrowing is for Graduate Education
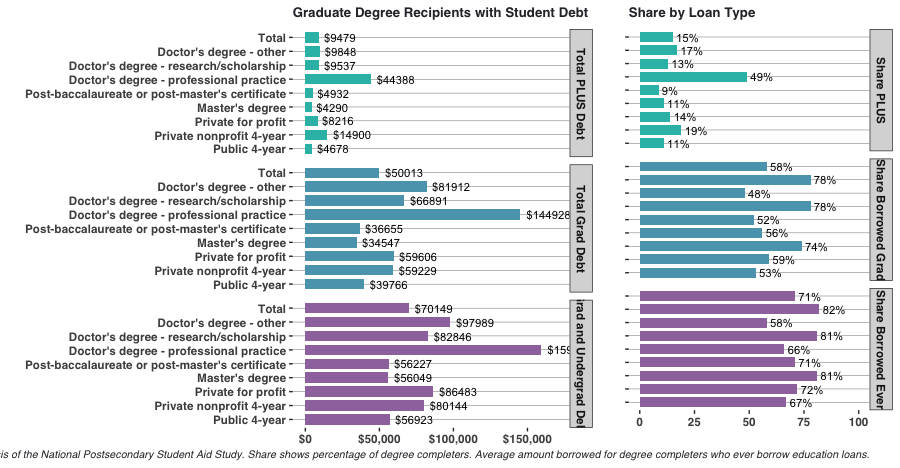
Among degree completers over 60 percent of graduate students borrow loans at some point in their academic careers, and 58 percent borrow for graduate school. Just 15 percent took out PLUS loans for their graduate education at any point in their academic career. Overall, graduate degree recipients in 2015-16 left school with an average of $70,000 in debt, including borrowing from previous academic experiences, about $50,000 of which can be attributed to graduate school itself.
These figures vary somewhat across the type of school attended, with students at for-profit and private non-profit institutions borrowing more frequently, and students in doctoral degrees other than research degrees borrowing the most frequently. Similar to annual borrowing, students in professional degree programs like law and medicine borrowed much larger sums than those in other types of degrees, taking on an average of $159,000 in debt over the course of their educational careers. However, these are the same individuals who will command the highest labor market returns when they hit the job market, and the lifetime earnings differences are an order of magnitude higher than the debt figures shown here.
One reason why students might be drawn to graduate school is that those with graduate degrees graduate degree holders earn between $400,000 and $1.2 million more over their working lives than those with just a Bachelor’s degree, depending on the degree they choose. What’s more, generous loan packages mean that individuals can easily leverage their expected earnings to pay for their degrees up front–in some cases taking on substantial debt loads to do so. Because of high returns to graduate education and easy access to credit, graduate students borrow at much higher rates than their undergraduate peers, and over time the amount students have taken on has risen as well.
More About the Authors
Related

Quality Principles for Workforce Pell Programs