Olivia Cheche
Program Associate, Higher Education


This is the first in a series that presents our findings from the latest Community College Enrollment Survey. Other blogs that go deeper into several findings of the survey will come out through March. Here's a blog on students' perspectives of online learning.
As we near the third anniversary of nationwide pandemic closures, it’s hard to fathom how completely our lives have changed. We’ve settled into a new way of being—it’s not quite the “before times,” but also not the dark days when we faced so many unknowns about COVID-19. Life has adapted. More people are socializing. More are returning to offices and downtowns. Long-awaited trips are being taken. Children are back in school. And college campuses across the United States are open.
Yet progress feels tenuous. Inflation is high. Housing, food, and gas prices have grown, putting pressure on household budgets. Climbing interest rates have made it more costly to borrow. A tight labor market has led to a shortage of childcare workers, making it challenging for working parents to find care. COVID-19 is still simmering in the background, along with a soup of other viruses. Downtowns are not as bustling as they once were, with many white-collar workers working hybrid or fully-remote schedules. Many children never returned to school. And many college students haven’t either.
Nowhere in higher education has the loss of students been felt more acutely than at community colleges. Since the beginning of the pandemic, one in five community college students have disappeared from campus. And while community colleges have seen a very small increase in freshman enrollments, it doesn’t recover the enrollments lost over the course of the pandemic.
Two years ago, New America asked the important question, where did all the students go? We surveyed current community college students, stop-outs, and those aspiring to go to community college but who had not yet enrolled. We found that the pandemic and the related economic uncertainty posed serious challenges for community college students, who are often lower-income, older, and have more work and care responsibilities than their peers who attend four-year institutions. These challenges were insurmountable for many, and when something had to give, it was college.
Now the question has shifted: will students ever come back? To answer this question, New America commissioned Lake Research Partners to conduct a second community college enrollment survey (full topline data can be downloaded here). This nationally representative survey was conducted between November 16th and December 15th, 2022. It included a sample of 1,641 adults: 500 who were enrolled anytime between January 2021 and 2022 and who continued enrollment in fall 2022 (“continuers”); 500 who were enrolled between spring 2021 and 2022 and are no longer enrolled (“stop-outs”); 141 who considered enrolling last spring and enrolled this fall (“new students”); and 500 who considered enrolling in the spring but did not enroll this fall (“aspirants”). Full methodology can be found at the end of this post.
By having four distinct groups, we are able to distinguish among these populations and better understand how current economic and pandemic conditions relate to their lives and their decisions to maintain enrollment or stop out. Importantly, we can track how things have changed for students in the intervening years since the pandemic began. In this post, the first in a series that unpacks our findings from the survey, we will explore our top three findings.
Finding 1: Students are now more concerned about the economy than they are about COVID-19
Our four groups, regardless of enrollment status, have many common concerns about the economy that are important for institutional, state, and federal policymakers to consider as they figure out how to best attract, retain, and support students.
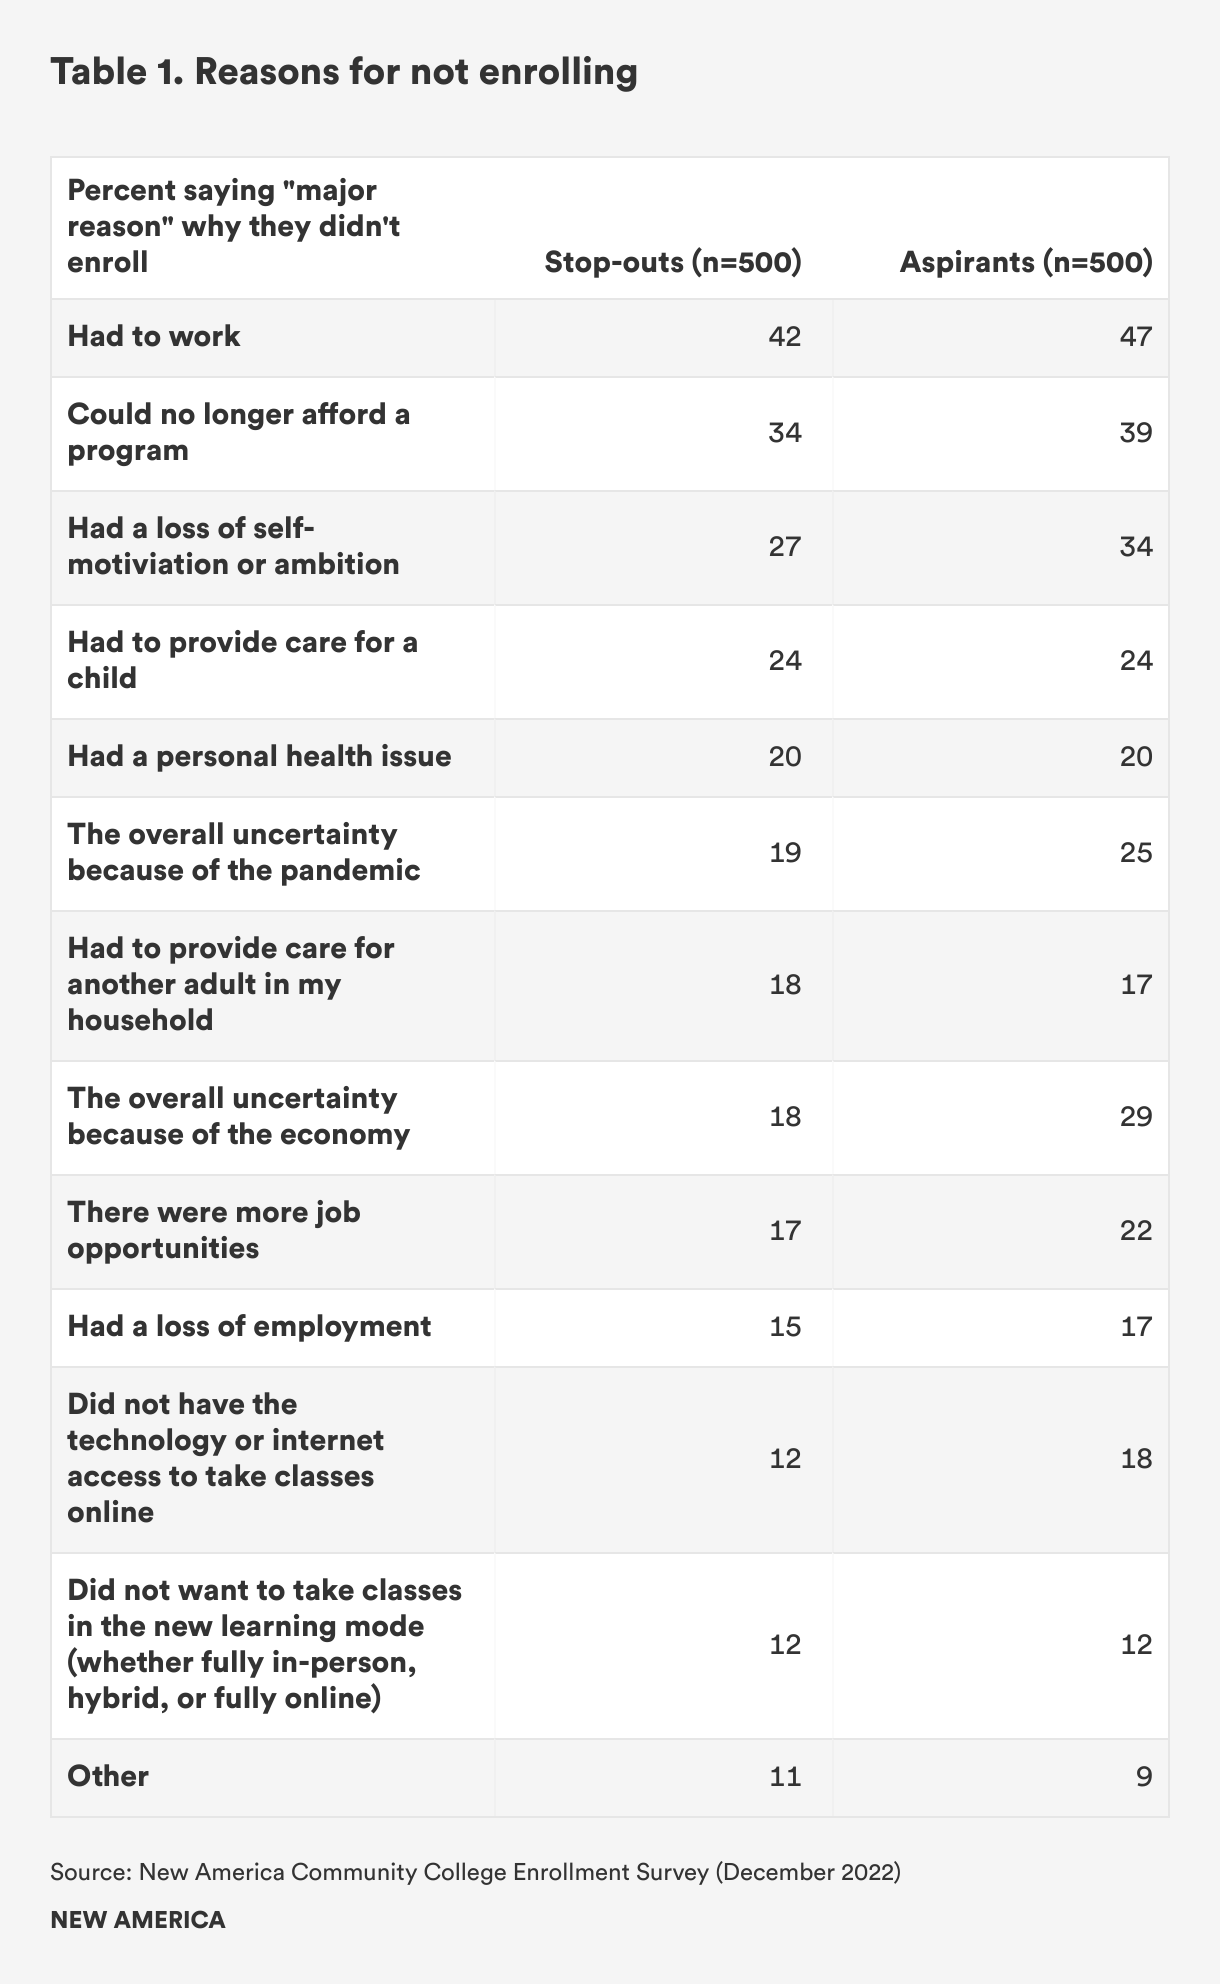
When this survey was last conducted in 2020, we found that a majority of each enrollment group (65 percent of continuers, 60 percent of stop-outs, 65 percent of new students, and 66 percent of aspirants) were concerned about catching COVID-19. These concerns decreased over the past two years, particularly among stop-outs (47 percent) and aspirants (43 percent). In addition, 38 percent of stop-outs cited uncertainty due to the pandemic as a reason for their stopping out, down from 62 percent in 2020. This decline in health-related concerns illustrates that it is likely no longer a driving reason for students stopping out or deciding not to enroll (see Table 1).
Having to work remains a top reason why stop-outs (42 percent) and aspirants (47 percent) decided not to enroll, and the shift for aspirants has been more pronounced. While uncertainty due to the pandemic was the top reason for both groups to not enroll in 2020, it now is having to work.
While many are expressing less concern regarding the COVID-19 pandemic, economic concerns continue to be a driving force behind their choices not to go back to school. Rising prices also serve as a cause for worry, with majorities of all groups (65 percent of continuers, 71 percent of stop-outs, 63 percent of new students, and 66 percent of aspirants) noting that they are extremely or very concerned about the current rate of inflation.
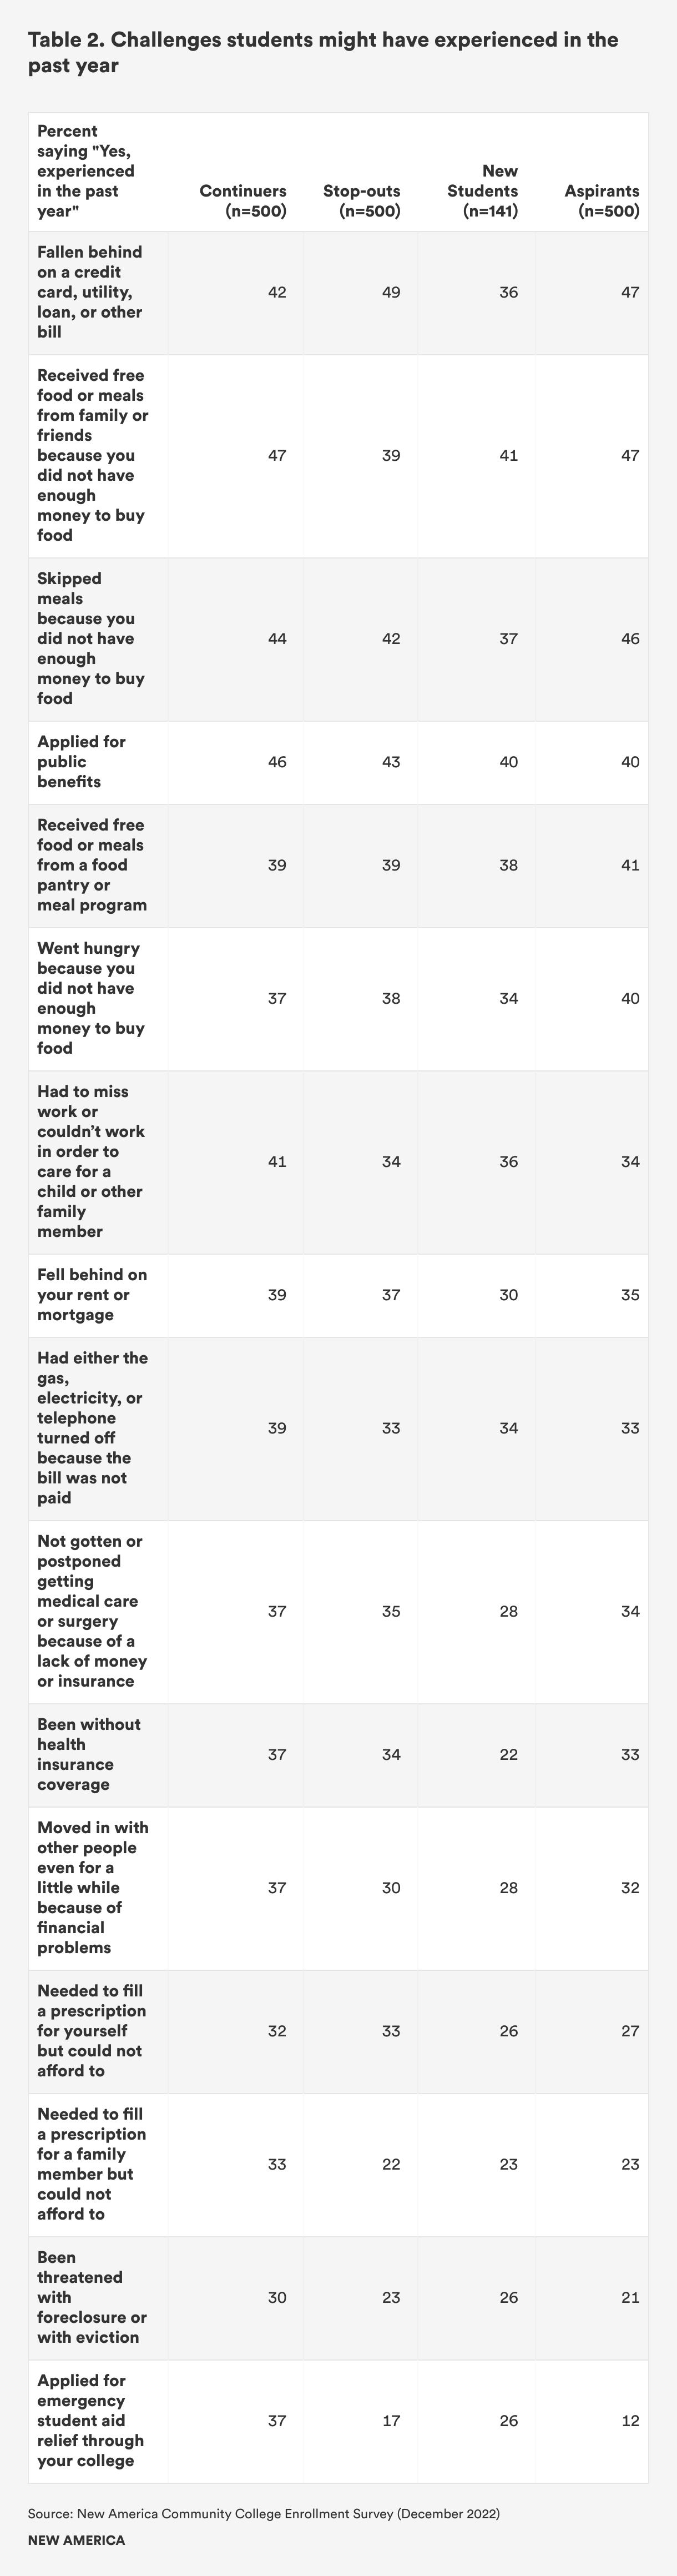
Across all groups, significant percentages are experiencing economic hardship. At the high end, nearly half (49 percent) of stop-outs report falling behind on a bill, with aspirants (47 percent) and continuers (42 percent) trailing behind. Many respondents also received free food from a friend or family member (between 39 and 47 percent) and skipped meals (between 37 and 46 percent) because they did not have enough money to buy food, thus indicating that food insecurity also poses a great risk to these students (see Table 2). These rates of food insecurity are worse than they were when this survey was first conducted: in 2020, the rate of respondents receiving free food from a friend or family member ranged between 36 and 41 percent, and the rate of respondents skipping meals ranged between 32 and 37 percent.
Finding 2. Stop-outs and aspirants are stuck and aren’t planning to enroll anytime soon
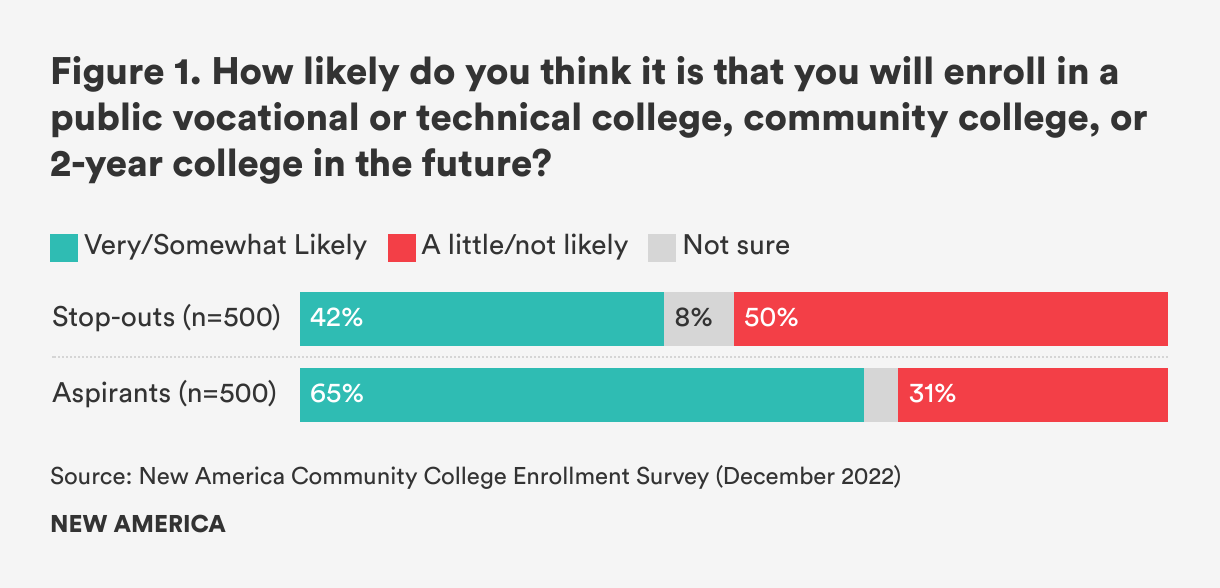
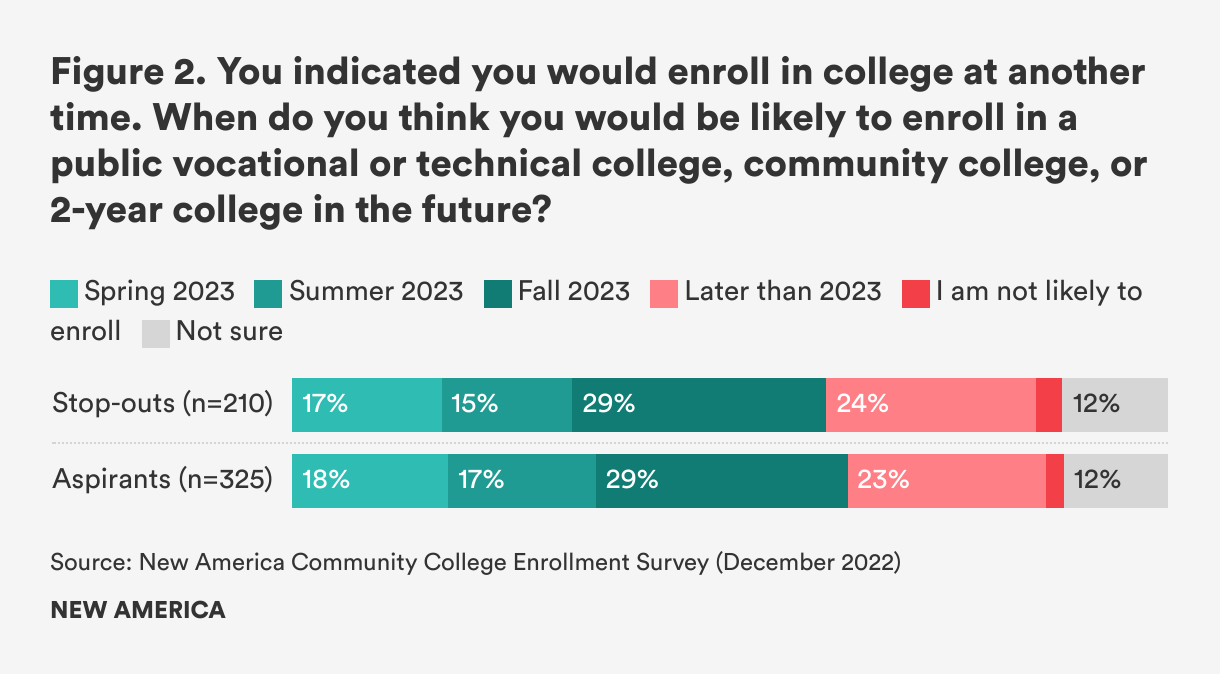
Will students come back? Unfortunately, our survey results are not reassuring. For stop-outs, only 42 percent say it is likely they will enroll again in the future (see Figure 1). And for those who plan to enroll again, 24 percent said they didn’t plan to enroll again until after 2023 (see Figure 2). In comparison, a majority of aspirants (65 percent) say they plan to enroll in the future, but similar to stop-outs about a quarter (23 percent) plan to delay enrollment until after 2023.
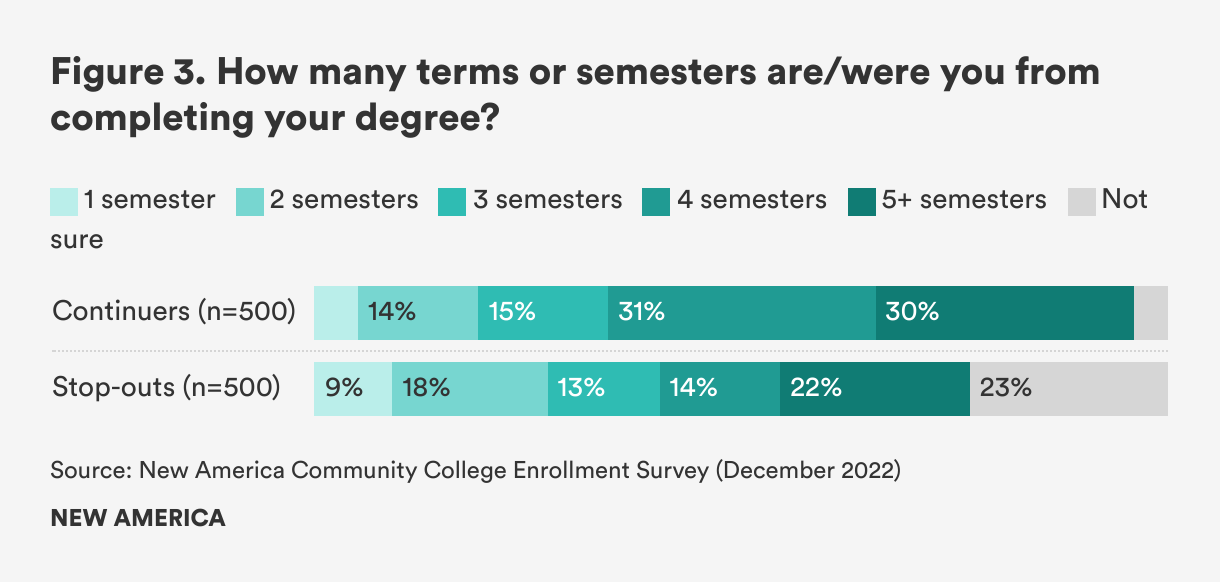
Stop-outs were also much less clear on how many semesters they were from completion of their degree compared to continuing students (23 percent of stop-outs were unsure how many semesters they were from completion compared to only 4 percent of continuers) (see Figure 3). And compared to two years ago, fewer stop-outs said they needed to complete their program to get a professional license to work in the field they were studying (37 percent said so compared to 50 percent in 2021).
When asked an open-ended question on what would need to change for stop-outs to re-enroll in college and for aspirants to take the plunge and enroll, respondents mentioned money, health, and time as top reasons. As one student succinctly said, “I needed the money [from working].”
Finding 3. Stop-outs and enrolled students feel very differently about online learning quality
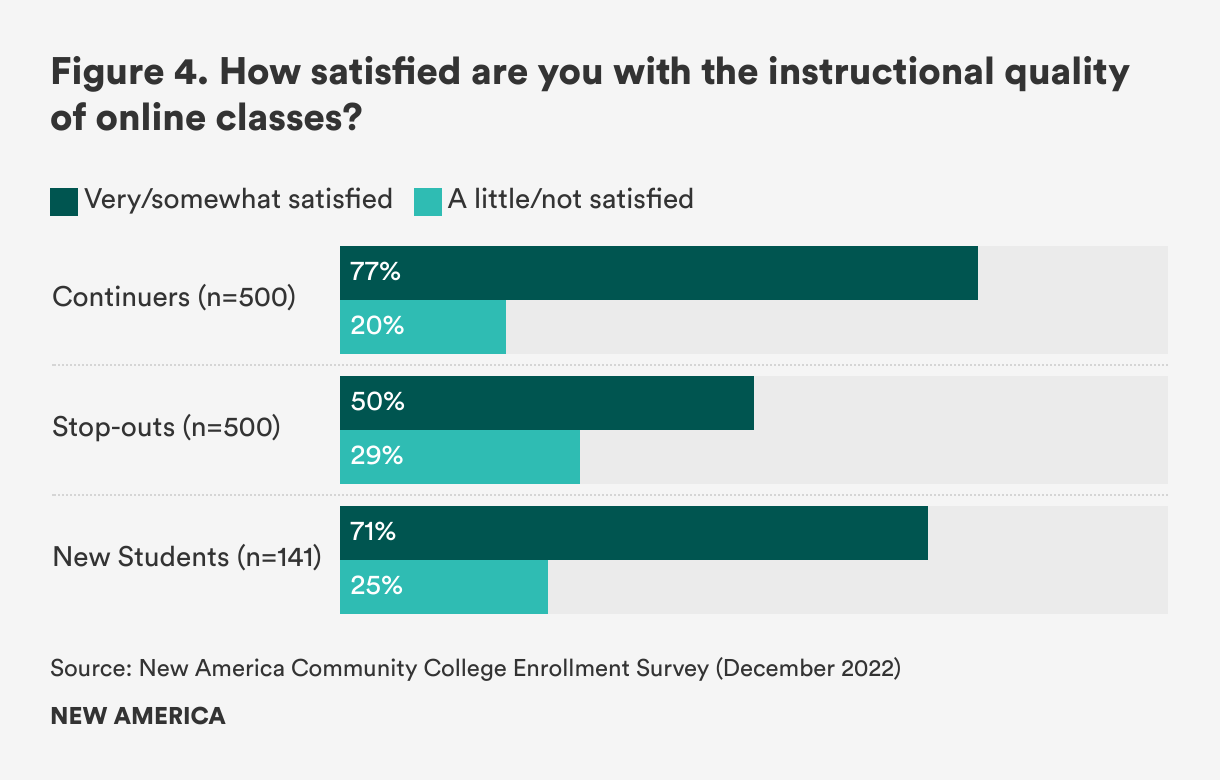
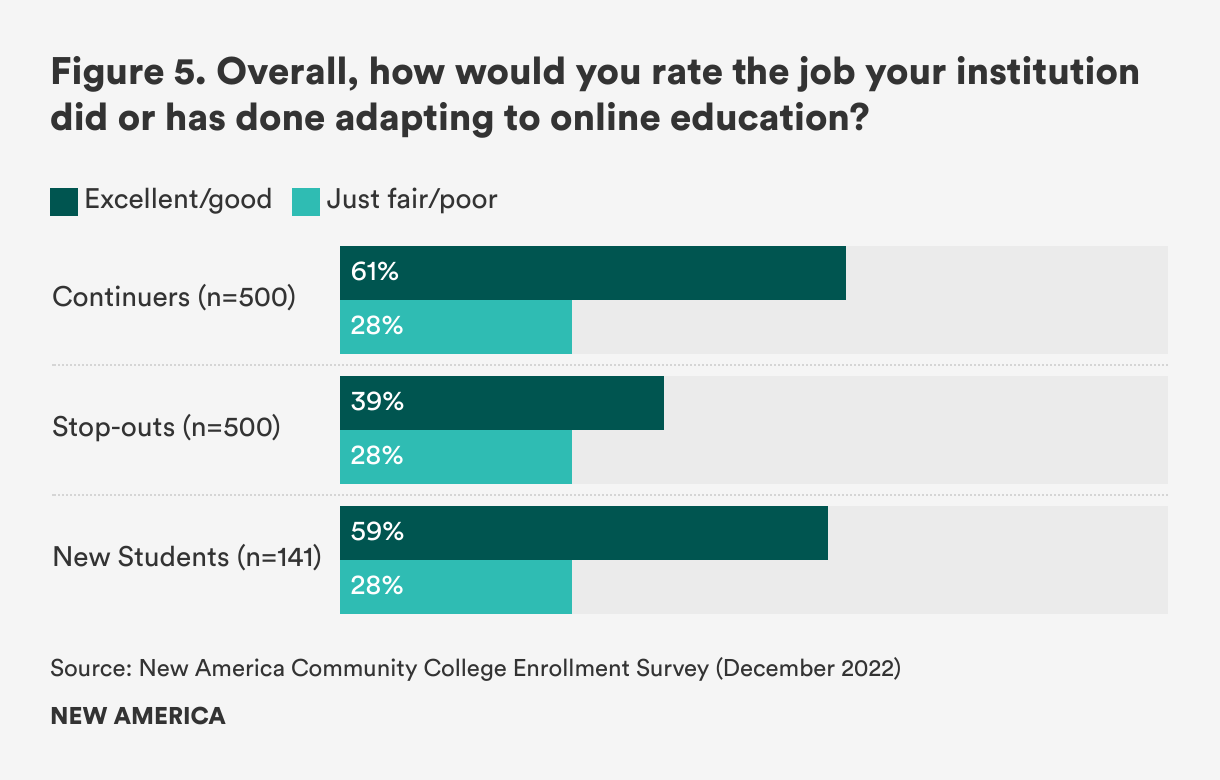
Stop-outs also differ from their enrolled peers in their opinions of online learning. Only half (50 percent) of stop-outs report satisfaction with the quality of online instruction, compared with 77 percent of continuers and 71 percent of new students (see Figure 4). Approximately six in 10 continuers (61 percent) and new students (59 percent) believe that their institution did a good job adapting to online education, but only 39 percent of stop-outs share this sentiment (see Figure 5). Less than favorable perceptions of online learning may serve as a hang-up for students who stopped out, considering that this shift occurred at the start of the pandemic.
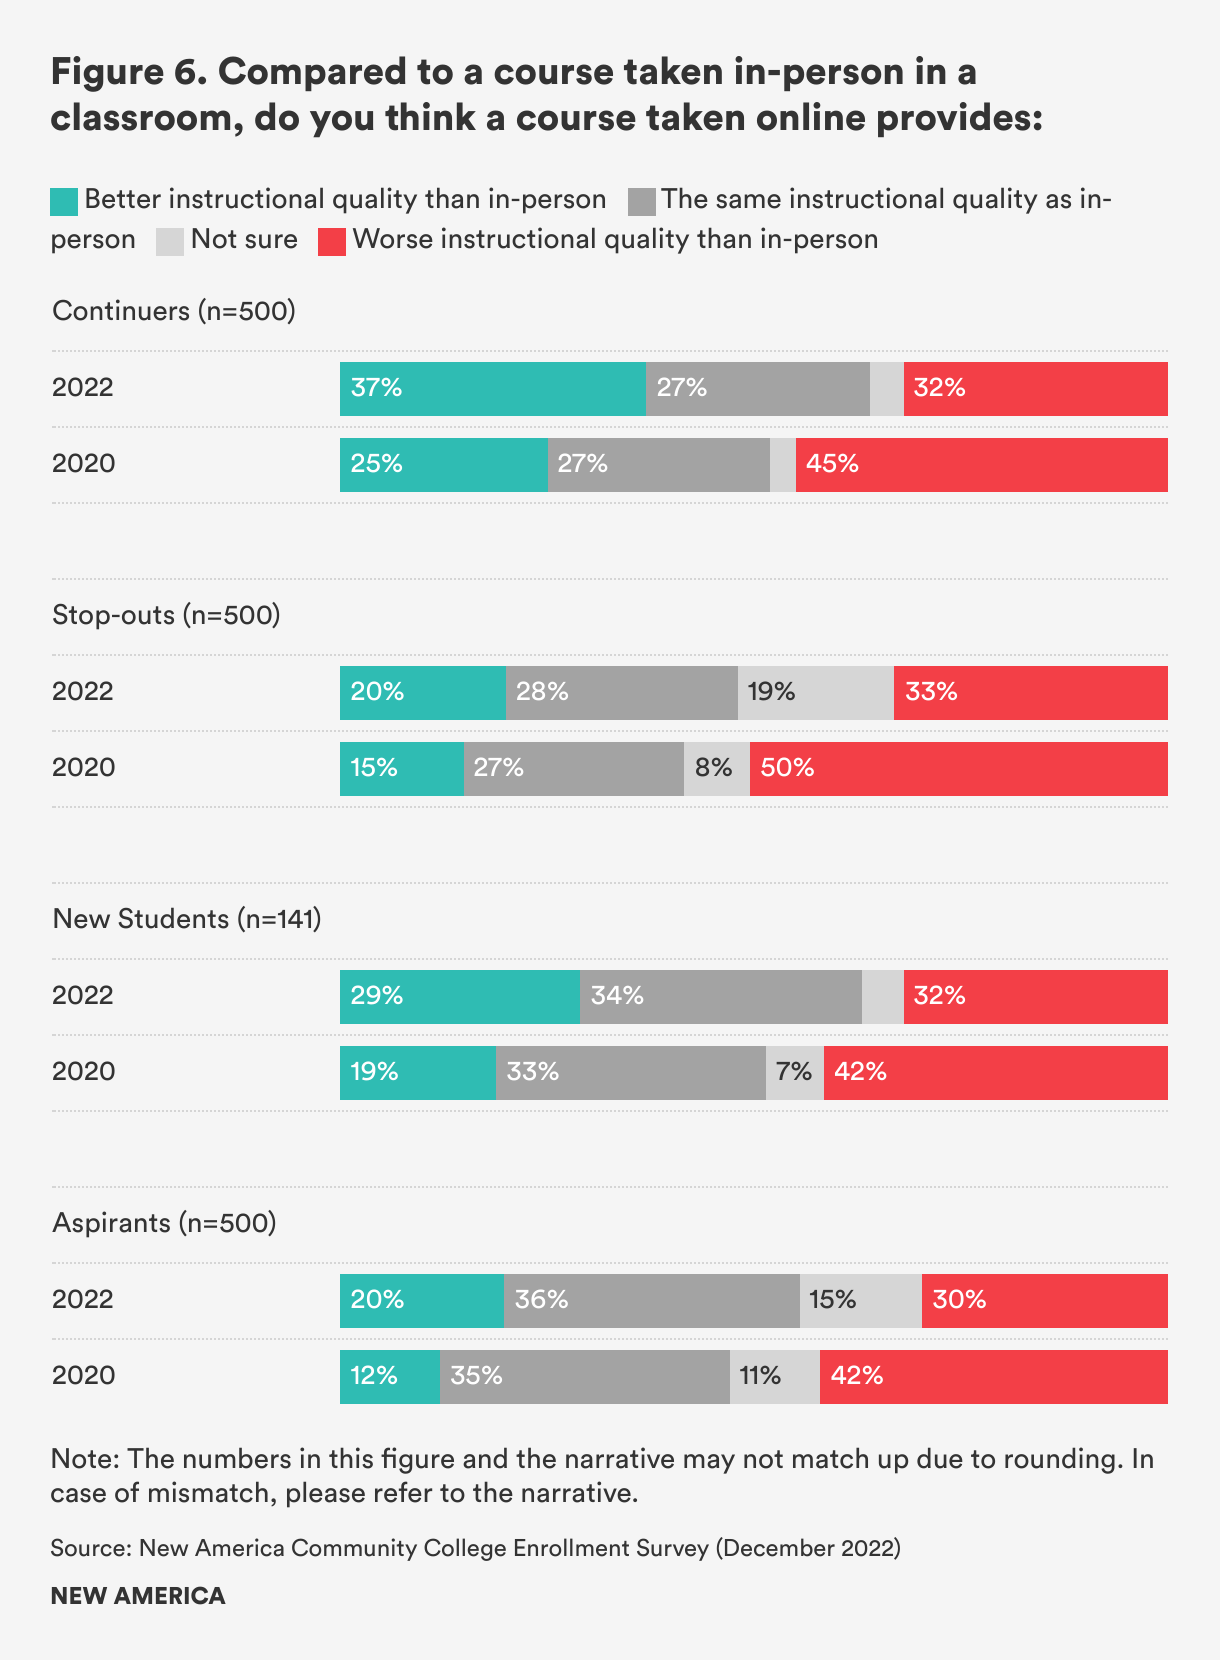
These hang-ups also emerge when students are asked how they perceive the quality of online classes in comparison to in-person classes. One notable shift is that 37 percent of continuers now feel that online coursework provides better instructional quality than in-person instruction, compared to 25 percent when we asked in 2021 (see Figure 6). This shift in numbers may be an indicator that students who have remained enrolled in their programs have become more comfortable with their online classes over time, and/or institutions and faculty have gotten better at delivering content. In contrast, only one in five stop-outs (20 percent) believe that the quality of online classes is better than that of in-person classes, and one in three (33 percent) think it’s worse.
Conclusion
This is an initial look at critical survey data that will help policymakers and researchers better understand why students may (or may not) elect to enroll in community college, nearly three years after the start of the COVID-19 pandemic. Over the coming weeks, New America will continue to explore these data, looking at various demographics to analyze and explain other trends.
Methodology
Lake Research Partners designed and administered this survey which was conducted online from November 16th through December 15th, 2022 and reached a total of n=1,641 respondents who were screened from a national online panel of mobile users into one of four potential groups:
The margin of error is +/- 4.4% for “Continuers,” “Stop-outs,” and “Aspirants” and +/- 8.3% for “New Students.”
Enjoy what you read? Subscribe to our newsletter to receive updates on what’s new in Education Policy!
Program Associate, Higher Education
Director, Higher Education