Abbie Lieberman
Senior Policy Analyst, Early & Elementary Education

We can’t deny that money matters in education. It is extraordinarily difficult to provide children with high quality learning experiences without sufficient funding. Everything from school supplies to teacher salaries to transportation costs money. Ninety percent of funding for our public education system comes from the state and local level, mostly in the form of local property taxes. Funding education through local property taxes leads to significant disparities from one district to the next, leaving schools that serve children from lower income families with limited resources.
State funding can make resources more equitable based on the way a state chooses to allocate money. Unfortunately, many state funding formulas don’t go far enough to support high-need districts. To make matters worse, states and localities across the country have been cutting education funding since the Great Recession. Multiple states, such as Pennsylvania, have even faced lawsuits claiming that they were not adequately funding public education.
Late last year, our team released From Crawling to Walking: Ranking States on Birth-3rd Grade Policies that Support Strong Readers, a comprehensive report ranking states on 65 policy indicators in seven policy areas that promote strong literacy skills by the end of third grade. We grouped states into three categories based on their progress: crawling, toddling, or walking.
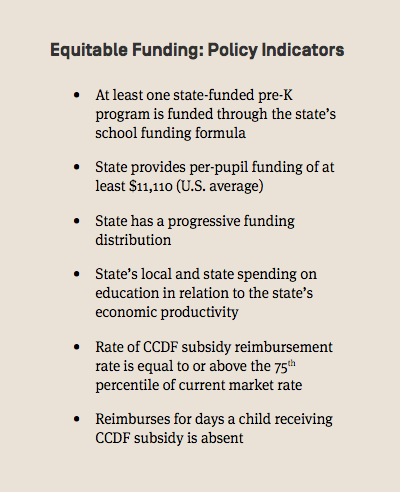
Our report evaluated states on six policies related to equitable funding (listed on the right). Because of the important impact that funding has on policy implementation, we gave significant weight to policies in this category. (See our methods here on page 6). To best meet the needs of students, states should prioritize education in their budgets, provide sufficient per-pupil funding, and allocate more money to districts with more students facing poverty (i.e. use a progressive funding distribution).
And to ensure that our nation’s youngest learners are served, we argue that state formulas should also include funding for pre-K, as opposed to funding pre-K programs through potentially less stable sources like state lotteries or taxes on cigarettes or alcohol. By including pre-K in the state’s school funding formula , it also sends the message that pre-K is an essential part of our public education system.
Stable funding for child care centers that receive government subsidies is equally important. In order for providers to offer high quality services (such as qualified staff, low child-staff ratios, appropriate supplies, safe environment, etc.) to families eligible for subsidies, they must be reimbursed sufficiently. The federal government recommends that states reimburse providers at the 75th percentile of the market rate to safeguard against providers turning away children who qualify for subsidies and to ensure that they receive enough money to provide quality services. In 2014, only two states meet that threshold.
Our report found that most states are lagging when it comes to equitable funding; a majority of states didn’t meet even half of our indicators. The map below identifies the few that are leading the way: Connecticut and New Jersey tied for first place, followed by Wisconsin, Maine, New York, Rhode Island, and West Virginia. You can explore where all states rank by using our interactive mapping tool, Atlas.
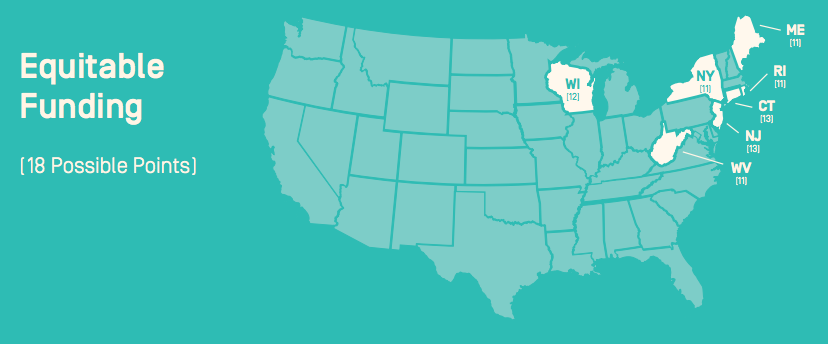
We relied on the Is School Funding Fair? report by The Education Law Center and Rutgers University for a handful of our equitable funding indicators. According to the report, each of the leading states provide per-pupil funding of at least $11,110 the national average for K-12 education. Per-pupil funding in New York is more than twice that in Idaho, even after adjusting for regional differences.
Connecticut, New Jersey, and Wisconsin each have progressive funding formulas– New Jersey’s is one of the most progressive in the country, providing high-poverty districts with approximately 30% more funding. Maine is the only leading state in this policy area with a regressive funding formula, providing its highest-poverty districts with only about 85 cents for every dollar in low-poverty districts. (Maine stood out because the state reimburses child care providers for an unlimited number of child absences.) The Education Law Center report awarded states letter grades based on their education spending in relation to their economic productivity. All of the leading states earned an “A,” except for Wisconsin, which earned a “B.” This grade reflects “the level of priority state and local budgets assign to education.”
According to the National Conference of State Legislatures, all of the leading states fund pre-K through their school funding formulas. Access to these state pre-K programs remains varied, however. West Virginia provides pre-K for almost 70 percent of the state’s 4-year-olds and 11 percent of 3-year-olds. Where Rhode Island lacks in access, it makes up for in quality by requiring lead teachers to have a bachelor’s degree with a specialization in ECE and assistant teachers to have at least a children development associate (CDA) credential. Rhode Island also requires small adult-child ratios in its pre-K program.
Unfortunately, no state met all of our indicators. None of the leading states reimburse child care providers at the federally recommended reimbursement rate. In fact, South Dakota and Oregon are the only states that do, according to the National Women’s Law Center’s 2014 report.
It’s clear that all states can make improvements in their policies and funding formulas to better support early learners from lower-income backgrounds, both in child care and elementary school. Funding is too often a third rail issue, but we must acknowledge that very few of the policies discussed in our report can become a reality without sufficient funding. It’s not all about money, but money does matter.”
Senior Policy Analyst, Early & Elementary Education