English Learner Changes Over the Last 20 Years
Blog Post

Shutterstock
Sept. 22, 2025
Students identified as English learners (EL) are commonly referred to as the fastest growing population of students in K–12 schools. Indeed, between 2011 and 2021, the EL population grew by 15 percent from 4.6 million to 5.3 million students, and today, ELs represent 10.6 percent of the total K–12 population.
EL students are not a monolithic group and national figures can obscure the diversity of these students within states. To glean a better understanding of the racial, linguistic, and enrollment trends among ELs, we examined state-level enrollment data from the U.S. Department of Education's Common Core of Data (CCD) and English Language Learner (ELL) demographic files from Ed Data Express spanning 2010-2021. Analysis of this data shows that over the last 10-20 years, higher concentrations of ELs have popped up in new parts of the country and the linguistic makeup of these students within states has shifted. Additionally, a snapshot of ELs in 2022 shows that other racial groups are represented beyond Hispanic/Latino. Here are key observations from the data.
The midwest, southeast, and northeast regions saw their EL populations steadily grow between 2000-2021
A timelapse of the geographic dispersal of EL-identified students shows that the midwest, southeast, and northeast regions saw their EL populations steadily grow between 2000 to 2021 (Figure 1). Simultaneously, the greatest number and density of EL students continues to be found in the west and southwest regions along the southern border with Mexico. Understanding the geographic distribution of ELs is important because it brings into view newer EL destinations that may not have the necessary resources and expertise to adequately support this dynamic group of students. This information can help identify areas where additional support may be needed and should be prioritized by federal, state, and local leaders allocating resources.
Figure 1.
Timelapse of EL Enrollment Changes from 2000 to 2021
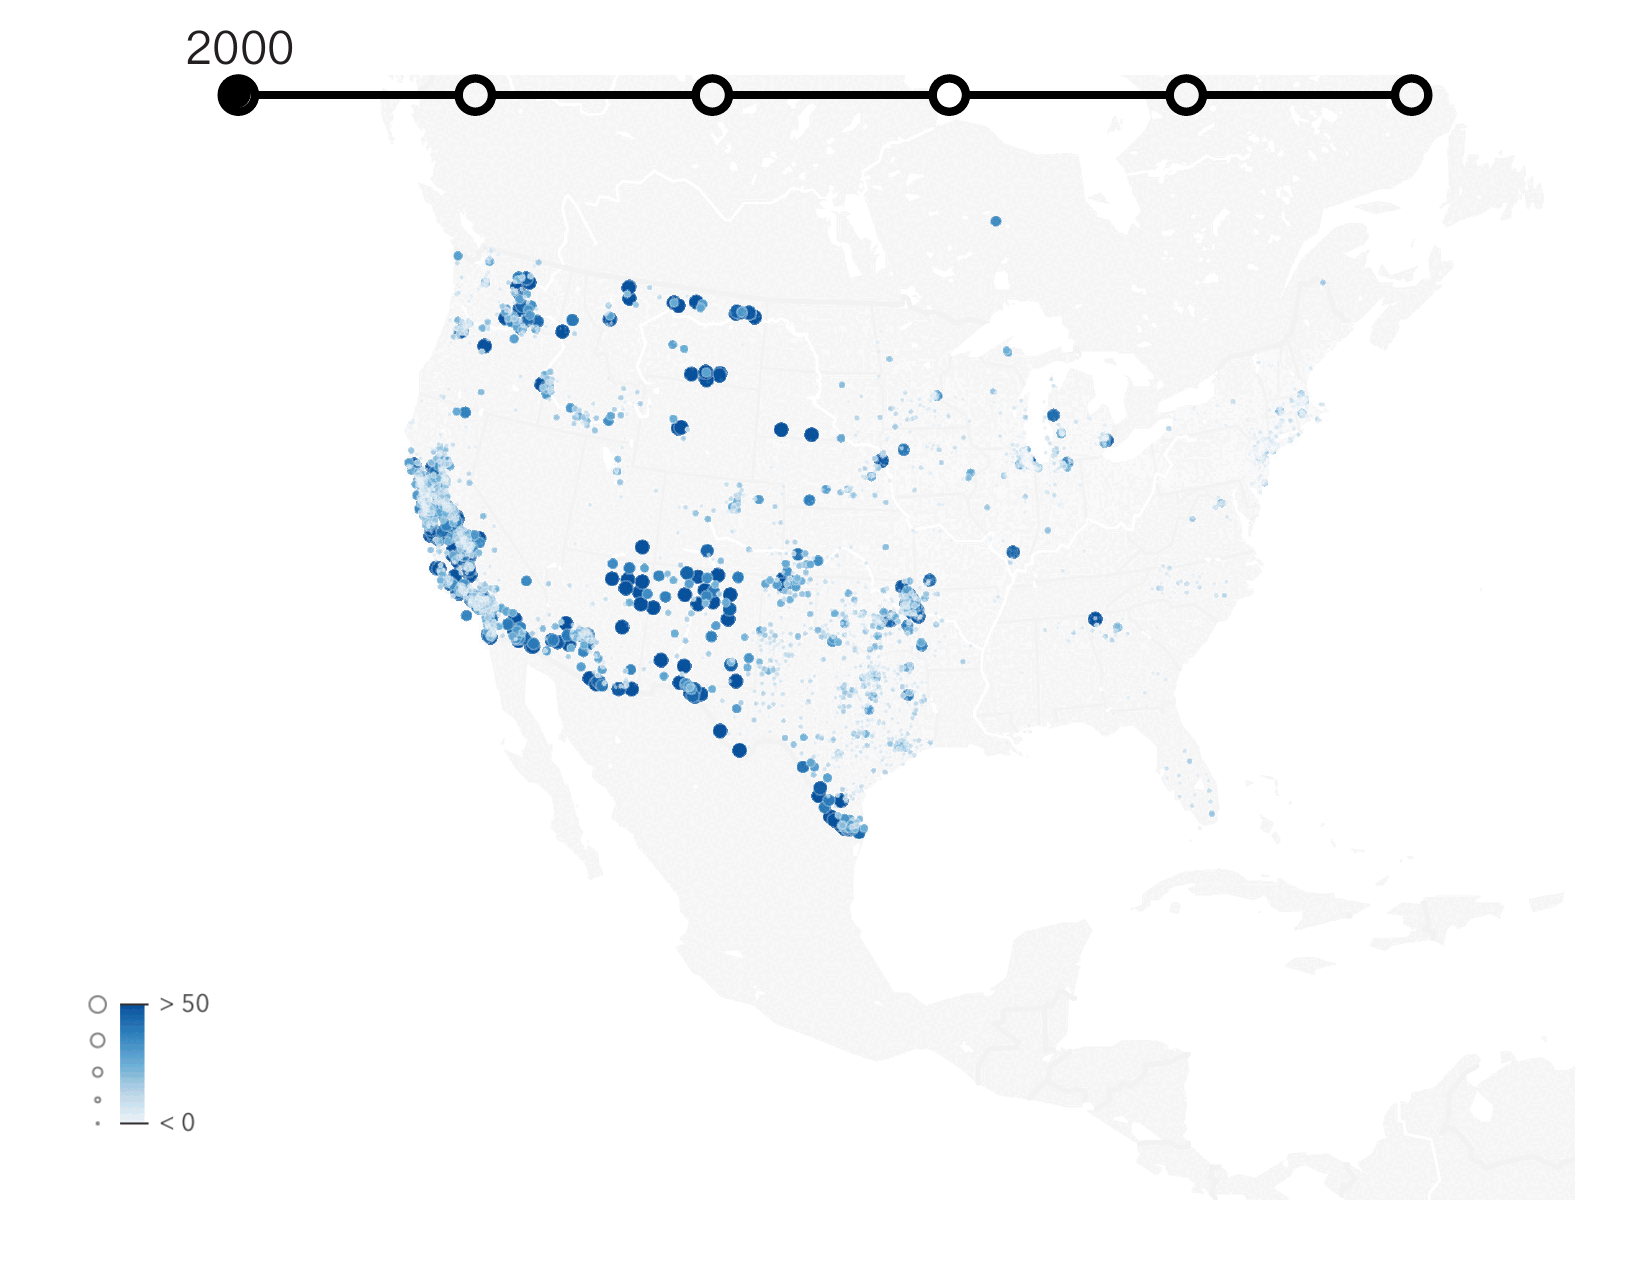
Source: New America
Note: The color gradient in the key represents the percent from zero to greater than fifty of enrolled students made up by the EL population.
Between 2010-2021, the EL population grew faster than the K–12 population in most states
Over the last ten years, national K–12 enrollment has been declining. During this same time period, as Figure 2 shows, all but eight states experienced an increase in their EL population. Louisiana experienced the biggest percentage increase in EL enrollment (153 percent), followed by Delaware (135 percent), Rhode Island (133 percent), Kentucky (128 percent) and Mississippi (108 percent). Nevada experienced the largest EL decline at -23.2 percent, followed by California (-21.8 percent), Colorado (-21.1 percent), Alaska (-14.1 percent), and Oregon (-12 percent). These observed declines could be a result of multiple factors including demographic shifts or changes in state-level EL identification and reclassification criteria.[1]
A handful of states experienced both declines in EL enrollment and overall K–12 enrollment, including Alaska, California, Hawai’i, Kansas, and Oregon. And in 17 states increases in EL enrollment were not enough to stave off overall enrollment declines.
These enrollment trends impact the composition of the student population in K–12 public schools, the needed programming, and the financial resources available to serve these students. These changes also have implications for state education agencies and legislatures as they establish budget priorities.
The linguistic profile of ELs has shifted within states
ELs come from diverse language backgrounds with over 283 languages represented nation-wide. In 2021, the top 10 languages in order of prominence were: Spanish, Arabic, English, Chinese, Vietnamese, Portuguese, Hmong, Haitian/Creole, Russian, and Somali. As shown in Figure 3, between 2010-2021, the linguistic makeup of the EL population changed significantly, with states experiencing increases and decreases in the prevalence of different languages. Indeed, no two states are the same in terms of language prevalence and diversity. (To search through and sort the data by language growth or decline, please see Table 1).
Most states experienced growth among Spanish-speaking ELs, with the exception of Nevada, Colorado, Oregon, Kansas, and New Mexico. Not only did these five states experience the largest percent decline among Spanish-speaking ELs, they also did not see growth in any of the top 10 languages (with the exception of Oregon which saw English-speaking ELs grow by one percent).
The data also show that the population of EL students who speak English at home grew during the decade in question. The top five states for growth among English-speaking ELs were: Maryland, Ohio, Alabama, Delaware, and the District of Columbia. It may seem counterintuitive for English learners to speak English at home, but they may live in a multilingual household or have been “adopted from other countries who were raised speaking another language but currently live in households where English is spoken,” according to the National Center for Education Statistics.
The predominance of Spanish-speaking ELs can overshadow changes among the EL population who speak lower incidence languages. Many states saw fluctuations in languages such as Somali, Hmong, Haitian/Creole, Vietnamese and Portuguese. Maine, for example, experienced a 25 percent decrease in Somali-speaking ELs despite being considered a stronghold for Somali diaspora for many years, whereas Kentucky experienced significant growth among these students. Additionally, 38 states have seen their Vietnamese-speaking ELs decrease during the time period analyzed, even if slightly. Hmong-speaking ELs have mostly been on the decline as well, even in traditional strongholds such as Minnesota. And Indiana, New Jersey, and Maryland saw modest growth among Haitian/Creole EL students. Lastly, many states have seen their Portuguese-speaking ELs grow including Connecticut, New Jersey, Massachusetts, Pennsylvania, and Utah.
Changes in enrollment patterns for ELs speaking lower incidence languages can impact service delivery needs. For example, a large percentage increase in ELs speaking Haitian/Creole may signal to state and district leaders they need to hire more staff that speak the language or invest in new instructional materials. Understanding the overall number and distribution of those students within a state may determine how they go about that. And contextualizing these enrollment changes against the backdrop of national policy changes may also help state and district leaders understand whether these changes will be sustained or short-term.
English learners are more likely to identify as Hispanic/Latino, though other races are also represented
As Figure 4 shows, the majority of ELs identify as Hispanic/Latino, followed by Asian and White. It is important to note that racial demographic data included in this analysis is a product of both self-reported information as well as teacher/administrator observations. For students identified as “two or more races,” there is no further detail about what those two races are, and it is unclear how consistently this category is actually used.
Previous projections claimed that by 2025 ELs would make up roughly 25 percent of the K–12 population, or one in four students. Although these recent data show the English learner population has not experienced growth on that level, it has steadily grown in the last 10 to 15 years. The data also allow us to see that the EL profile does not look the same as it did before. Changes among the EL population are reflected in the places they live, the languages they speak, and in the racial composition of ELs as we see them today. Together, these data help paint a more accurate picture of English learner students which can help dispel myths and misunderstandings of who these students are. And by looking beyond national trends and highlights, these data provide policy and education leaders in each state a better sense of how to tailor educational services to them.
Recent actions on behalf of the Trump Administration have signaled a desire to divest from the research and data collection that made this analysis possible. This retreat threatens our collective ability to provide EL students–as well as all students–the educational opportunities they need to succeed. The law is clear that schools must grant English learners equal access to education and this data plays a critical role in ensuring states and districts are able to fulfil this responsibility. As such, federal, state, and local leaders must speak out against ongoing efforts to decimate the federal government’s role in ensuring all students are entitled to quality public education, regardless of where they live.
[1] English learners differ from students that are grouped based on more static traits such as their race/ethnicity or disability status. EL classification is temporary and the EL subgroup is dynamic as it changes year-to-year based on multiple factors, including reclassification policy, enrollment shifts influenced by immigration policy, and more. The dynamic nature of the EL subgroup means that EL data must be analyzed and used with care, especially in terms of how changes over time are observed. For example, an overrepresentation of EL students in middle or high school may not mean that more EL students entered. Instead, it may be a result of students not reclassifying in an appropriate amount of time after identification.
Data Sources:
This analysis uses enrollment data from the U.S. Department of Education's Common Core of Data (CCD) and English Language Learner (ELL) demographic files from Ed Data Express spanning 2010-2021 to examine racial and linguistic trends in the EL student population. District-level enrollment data were merged with EL-specific demographic breakdowns by race/ethnicity and home language, creating a comprehensive longitudinal dataset covering approximately 13,000 public school districts. Preprocessing converts suppressed values to zero and limits analysis to the 10 most prevalent languages.