Open Data and Overdose Mapping Techniques
Blog Post

Steven Kay, Flickr
Dec. 21, 2017
Governmental transparency is often thought of only within the pages of a checkbook: how and why the government is spending taxpayer money. Less often considered, but still vitally important, is governmental transparency regarding challenges. As local governments confront the opioid epidemic, it is rare to see data on deaths and hotspots for first responders, amongst other factors that can help communities manage their response to the crisis. Why is there resistance to sharing such information? Several factors can make governments hesitant to disclose data, including:
A fear that data disclosure will result in a community being seen as dangerous, unclean, or unfit for economic development.
An acknowledgement of privacy concerns, as some states have laws protecting the level of detail that can be made publicly available.
An inability to access data. Although local Health Departments usually have this data, government officials may not know this, and may instead create extra work for themselves by seeking out information from the county coroner.
Hearteningly, the number of communities dedicated to a proactive strategy for combating the opioid crisis through data sharing is growing. Over a dozen local governments are participating in the newly formed Opioid Mapping Initiative with the understanding that in order to support healthy communities and solve local problems, open data is critical. This forward-thinking mindset is instrumental when establishing collaborations between the various departments and public entities that are battling the epidemic on the front lines.
From data sharing initiatives, local coalitions can determine the necessary next steps. Data visualization from these intiatives can answer crucial questions such as “Where should we spend our time on outreach?”, “Where do we need to supply the community with more Naloxone?”, and “Where should we place more prescription drug boxes?” Data can be displayed in a variety of useful formats, including raw, aggregated, and heat indexed.
Raw data shows the magnitude of the problem

Individual overdose locations can be displayed most simply as pinpoints on the map. Making the volume of opioid deaths publicly known through this method can be extremely effective in mobilizing engagement. This map from Connecticut Office of Policy and Management’s Criminal Justice Policy and Planning Division, for example, illustrates both the magnitude of the problem with which they are grappling and the clusters where they can focus support. Concerns about individual privacy within this approach are largely unfounded, as communities will often strip data of identifying information and configure the map so that zooming into street level is disabled. Depending on the state, there may be additional rules that limit this level of granularity, leading to the popularity of the next two approaches.
Aggregating data helps local coalitions decide where to focus

When state regulations prohibit discrete data, aggregating it can provide a holistic view of the epidemic. Counties typically aggregate along the boundaries of cities or townships, as shown by Oakland County, MI’s strategy. Reporting data by municipality helps those communities identify areas of concern and allows for hospitals, schools, and other entities to participate in localized preventative efforts.
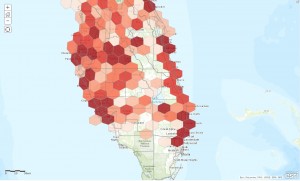
Health districts that cover multiple counties may aggregate data at the county or zip code level rather than municipality boundary. Mapping techniques such as hexbins, which divides an area into equal hexagons, are also becoming popular to provide more uniform boundaries.
Heatmaps identify the areas most in need of help

A heatmap, which displays the density of deaths in a given area, shows high-concentration (and therefore high-need) areas. The Tri-County Health Department of the Denver metro area has utilized this technique, scrubbing areas with fewer than three events in order to focus on high-need areas. This particular strategy can be beneficial for rural areas where inferences can be made from media reports, leading to unintentional identification of private information. By generalizing data in this way, local coalitions can meet most state requirements of confidentiality to protect individual identity.
In addition to assisting with crucial decision making, data maps like this are faithful displays of transparency and encourage citizen engagement. The opioid epidemic too often feels foreign to those who have not been personally impacted by it, even if the fight against it has reached their own backyard. When allowed to see overdose death information and law enforcement responses in their neighborhood, however, individuals are much more inclined to participate in the solution.
All of the above examples come from governments participating in the Opioid Mapping Initiative. This community of early innovators is currently participating in webcasts to share their workflows and exchange data-tracking strategies that not yet widely know. Any local government can join with a commitment to share transparently their data on regular intervals.