A Chapter of: Sealing the Trapdoors: The State Policies That Matter for Equitable K-12 School Funding
II. What Revenue Is Raised for Districts, and Is It Fair, Predictable, and Protected?
Policy Checklist
State policymakers and advocates should consider:
- State and local shares of the formula amount (measures of fiscal capacity, equity distortions, and state budget management)
- State revenue (general vs. designated revenues and tax sources)
- Local revenue (tax sources and property tax fine print)
- Private fundraising
Our definition of an equitable funding system includes both equity in school funding levels and equity in tax burden for payers. Lawmakers sometimes focus on the needs and demands of taxpayers in the school finance system at least as much as they do on the needs of students. But prioritizing tax relief can have the effect of lessening overall school funding, and tax reductions do not always make the tax burden more equitable. In this section, we aim to keep a student and community focus, seeing how each revenue policy affects what students receive while also asking whether the funding responsibility is shared fairly.
After the state funding formula sets a target funding amount for each district, the state will almost always have a way of splitting responsibility for funding that target amount between itself and the district. To assign the district’s share of responsibility, the state will use a measure of local fiscal capacity to determine what the district can reasonably contribute. By subtracting this expected local contribution from the formula target and providing the rest as state aid, the state sends more formula funding to lower-wealth districts and less formula funding to higher-wealth districts. This is called “equalization,” because it is meant to reduce the inequality that comes from districts’ differently sized tax bases. However, as discussed above (“District Authority Over Local Tax Rates”), that inequality reenters the system when districts have the ability to raise extra, local money or when states distribute too much funding outside the equalized funding formula.
Measures of Local Fiscal Capacity
The state method for calculating what a district can and should contribute toward the formula amount is tremendously important for equity. A measure that does a poor job of capturing a district’s true wealth level will place too heavy a tax burden on some communities and too light a burden on others.
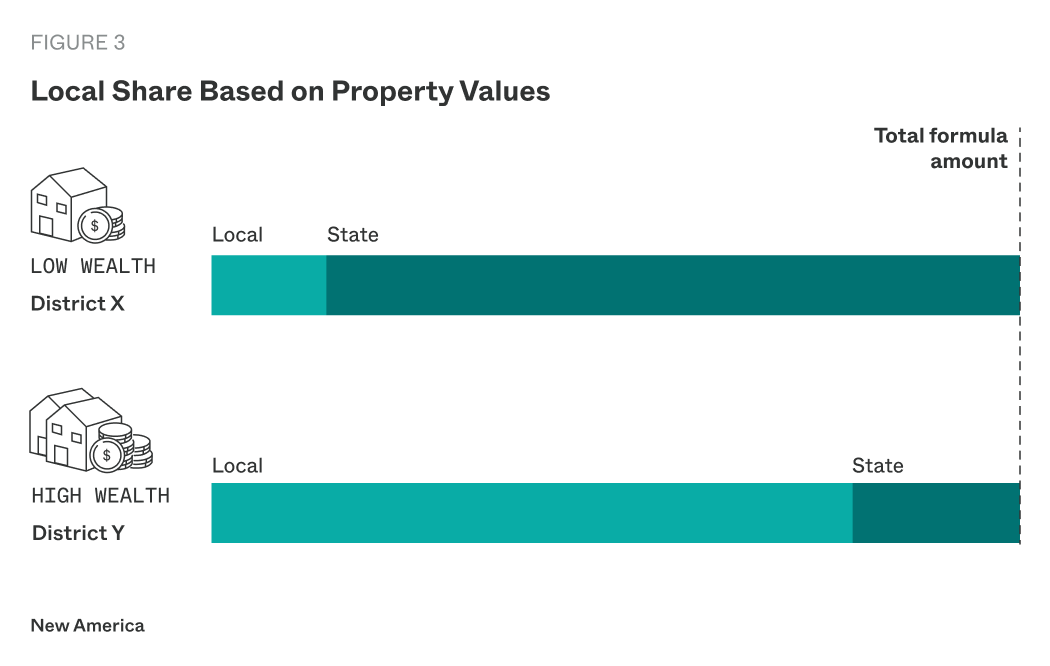
The most common basis—in many states, the only basis—for the local fiscal capacity calculation is local property values. The simplest approach is for the state to simply set an expected local tax property rate for education (for instance, Alabama expects a 1 percent property tax in all school districts, while Kentucky expects a 0.3 percent property tax5). Such a tax would raise more in a district with high property values and less in a district with lower ones, so the state would cover less of the formula amount in the property-rich districts and more in the property-poor ones (Figure 3).
However, property values may not fully reflect the wealth levels of local taxpayers. For instance, the owners of high-value agricultural land are not always high-income. Longtime homeowners in a gentrifying area may have lower incomes than newer residents, even if their homes have increased in value. Property that hasn’t been reassessed in many years may have a much lower taxable valuation than the sale price paid by a high-income buyer. For this reason, some states also factor local income levels into the local fiscal capacity calculation; Connecticut, Massachusetts, and Virginia are among the states that do so.6 In states where property values and taxpayer income are weakly correlated, consideration of income can improve the equity of the local fiscal capacity measure.
States may also expect districts to tap other sources of local revenue for schools. For example, local sales taxes in Arkansas, mineral revenues in North Dakota, and proceeds from public forest lands in Oregon are part of what districts can raise for schools and are included in local fiscal capacity calculations.
Equity Distortions in State and Local Share Policies
When a state relies on property values as the measure of local fiscal capacity, these values must be accurate and incorporated fairly into the expected local contribution calculation. As noted above, regular property reassessment is important for accuracy. However, some states have explicit policies that prevent the use of current data. For example, Missouri calculates local fiscal capacity based on the value of property as assessed in the 2004–05 school year, or the current value only if it has decreased since that year.7 This formula fails to recognize wealth gains in many districts. Texas, meanwhile, uses current valuations in its formula but automatically reduces the property tax rate for education in districts with fast-growing property values so that these gains do not drive up the dollar amount of the expected local contribution.8 These are obvious distortions in the wealth measures used to assign districts a fair amount of funding responsibility. They undermine the equity of their states’ funding systems.
Some states also undercut equity by setting maximum or minimum state or local shares of the formula amount, regardless of local fiscal capacity. For example, Iowa will only fund at most 88.4 percent of the target amount with state dollars, so even the most property-poor districts must cover at least 11.6 percent.9 At the other extreme, Mississippi asks districts to pay for no more than 27 percent of their formula amounts, so the state covers 73 percent even for the highest-wealth districts, taking up state funding that could be used to support students in communities with greater need.10
State Budget Management Through the Local Share Calculation
As noted above, several states set an expected local tax property rate for education and use the amount that would be raised from that tax as the district’s local share of the formula target each year. This method offers predictability and security for the district and its taxpayers: Property owners know the baseline rate for school taxes, and district leaders and staff know that the formula amount will be fully funded as long as the district levies property taxes at the expected rate. In this system, though, the state assumes most of the budget risk. If formula costs rise (e.g., because enrollment increases or because more students qualify for need-based supplemental funding), the state will be responsible for funding up to a higher target amount, but the district’s expected local contribution will not change. This risk may deter legislators from increasing the formula amount (for instance, by increasing the base amount, weight size, or number of weighted student categories in a WSFF), because the state budget would have to cover all of the new costs unless the local share policy were changed as well.
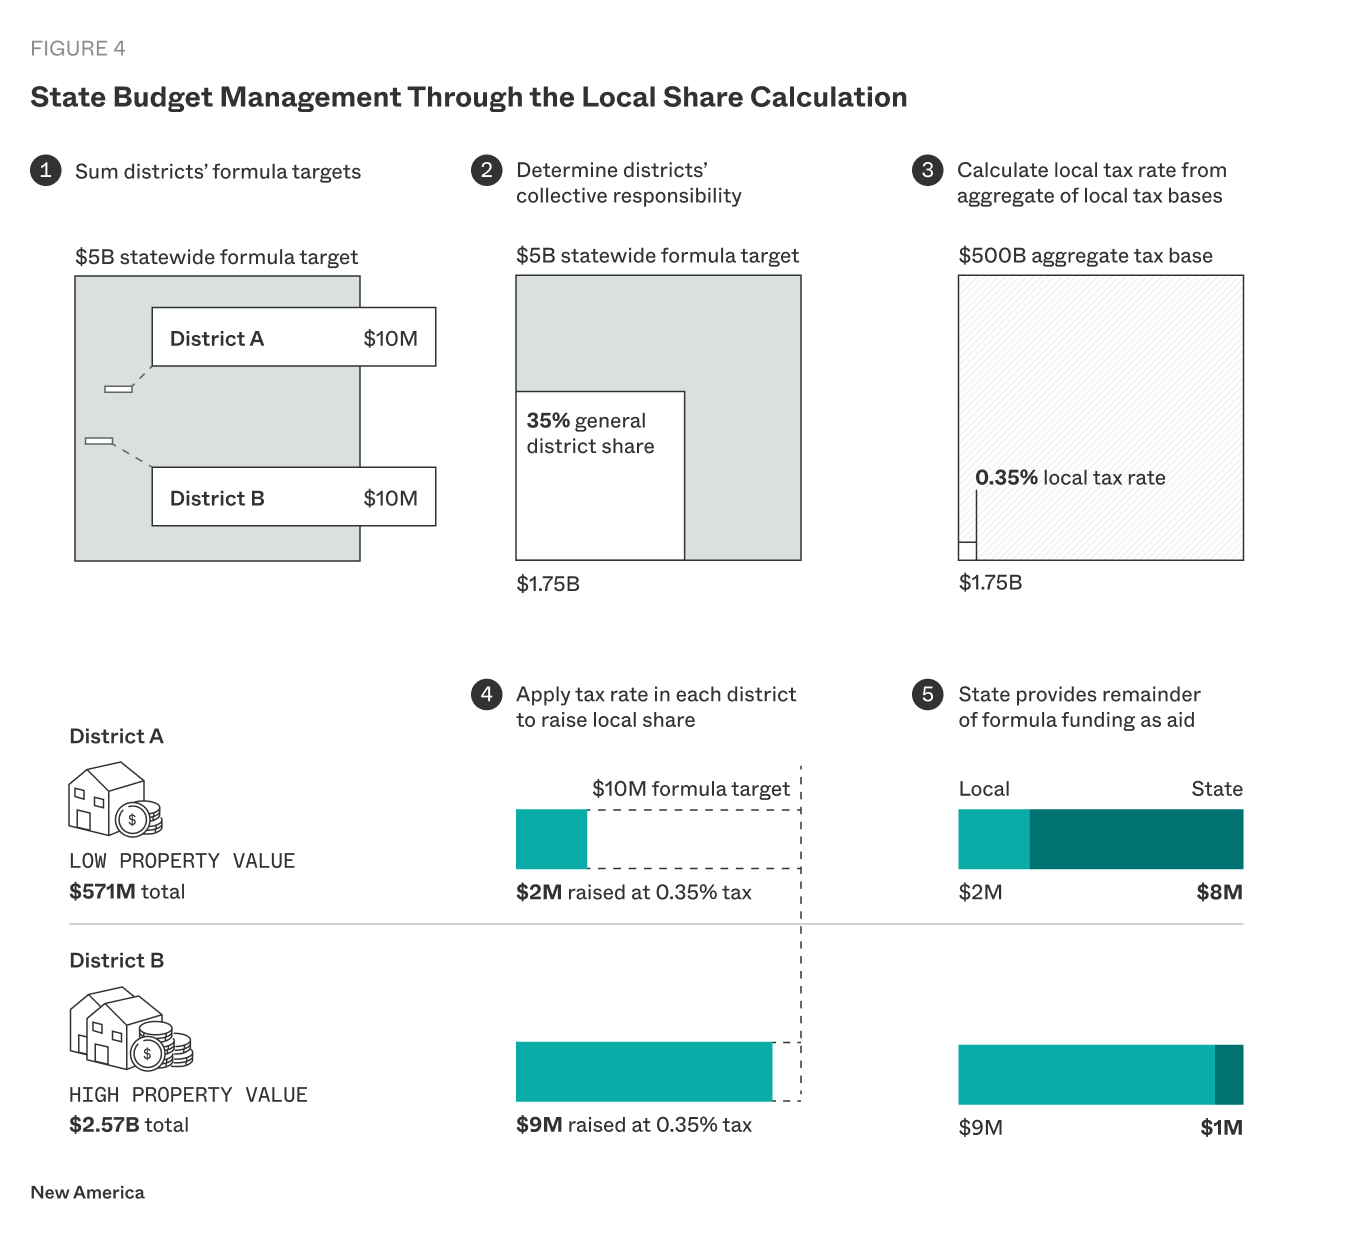
Some states use a different system that is still responsive to differences in districts’ wealth levels but shifts more of the risk onto districts generally, and onto higher-wealth districts in particular. These states set an overall share of formula dollars statewide that will be covered by state funds. For instance, in Louisiana, the state aims to cover 65 percent of districts’ aggregate formula amounts and asks districts, as a group, to cover 35 percent. In Massachusetts, the state provides 41 percent of formula funding statewide and expects districts to collectively pay for 59 percent.11 This general type of policy plays out for individual districts as follows (Figure 4):
- Step 1: The state calculates all districts’ funding formula targets and adds them up to see the total amount that must be funded (e.g., $5 billion in formula funding across all districts).
- Step 2: The state applies the general district share percentage (e.g., 35 percent) to find the amount that must be covered by local dollars (e.g., $1.75 billion).
- Step 3: The amount from Step 2 is divided by the aggregate value of all districts’ local tax bases (e.g., $500 billion) to determine what local tax rate will allow districts to meet their obligation as a group (e.g., 0.35 percent).
- Step 4: Each district applies this tax rate to its own tax base to raise the local share of its individual formula amount (e.g., District A, where properties are lower-value, can raise $2 million from a 0.35 percent property tax; District B, where properties are higher-value, can raise $9 million).
- Step 5: The state subtracts each district’s local share from its formula target amount and provides the balance as state aid (e.g., if both District A and District B have formula targets of $10 million, District A will receive $8 million in state funds, while District B will receive $1 million). The percentage of the formula target covered by state aid will vary from district to district, but across all districts, the state will cover its planned percentage of formula funding (here, 65 percent) and districts will be responsible for the rest.
The local tax rate changes from year to year, depending on both taxable valuations and formula targets. This system sacrifices some predictability. Taxpayers do not know in advance what the baseline school tax rate will be, and districts have less security that increases in student need will be fully met with increases in state aid. But this system also asks wealthy districts to pay more into the system when needs increase anywhere in the state, an equitable approach. Meanwhile, increases in formula costs are borne by both districts and the state, so the state budget absorbs less risk, which may reduce legislators’ reluctance to raise formula targets.
What State Revenue Supports Education?
Designated vs. General Fund Dollars
Most state education dollars are drawn from the general fund, so there is no guarantee that the legislature will set aside any particular amount of money for public education. (The state funding formula will usually call for a particular amount of state aid, but states can and sometimes do underfund their formulas when budgets are tight.) In states that have designated revenue sources for education, some or all education dollars are protected and cannot easily be repurposed by the legislature for other purposes. Since state budget cuts tend to fall hardest on the school districts with the lowest levels of community wealth, avoiding cuts is important not only for the adequacy of the funding system, but also for equity.
Specific Tax Sources
A state’s mix of education tax sources, whether they are earmarked for schools or contribute to the state general fund, is important. Different tax types can be more progressive (with higher-income payers contributing a greater share of income) or regressive (the reverse). Reliance on regressive tax sources makes a state’s education funding system less equitable on the payer side. Additionally, different kinds of taxes are more or less volatile (unpredictable in the amounts of revenue generated). Dependence on volatile tax sources makes a state’s education funding system less reliable and creates more danger that downswings will lead to state aid cuts, which are likely to affect low-wealth school districts the most.
Additional Reading: Evaluating Tax Sources
The Institute on Taxation and Economic Policy (ITEP)’s Who Pays? report (Seventh edition, 2024) explains which tax types tend to be more and less progressive and offers a helpful analysis of the progressivity of state tax systems.
The 2024 Urban Institute report Beyond the Crystal Ball: State Revenue Forecasts Before, During, and After the COVID-19 Pandemic includes a useful section called “State Tax Structures and Revenue Volatility.”
What Local Revenue Supports Education?
In addition to related policies discussed above (district authority over local tax rates, district boundaries and tax bases, and state and local share policies), there are specific equity considerations regarding the types of taxes that supply local revenue for schools and how they are levied.
Specific Tax Sources
Local property taxes are the main source of local funding for schools, providing upwards of two-thirds of local revenue in the average district. The remainder comes from a range of other local taxes and fees. Common types include sales and use taxes, income taxes, hotel and hospitality taxes, motor vehicle registration fees, and severance taxes (taxes on natural resource extraction). As with state taxes, any specific type of tax may be progressive or regressive, with implications for equity on the taxpayer side of the school funding equation. It also may be more or less volatile, which affects the stability of school district budgets.
All local revenues are, to a degree, the wages of good luck: The district benefits from having high-value property, or thriving local retailers, or high-income residents. Equalization policies are important so that districts with more resources pay their fair share and students in low-wealth districts are not left behind. However, it would be far more direct and efficient for the state to treat some taxes, like severance taxes on oil and gas extraction or revenue from energy pipelines, as sources of state revenue rather than allowing districts to collect these funds locally. They are not meaningfully tied to the local jurisdiction and should be used to support students across the state.
Property Tax Fine Print
Because property taxes are such a significant source of district revenue, the details of property tax policy are important for the equity of the school funding system. As discussed above, regular and accurate property reassessment is important for ensuring that property owners contribute a fair share of school funding. Accuracy in assessment includes eliminating bias. Research using federal data on property appraisal shows that homes in majority-Black neighborhoods are systematically undervalued, reducing tax capacity and the community’s ability to support local schools at reasonable tax rates.12 Bias and dated assessments are pervasive problems in property assessment even though they are not the result of affirmative policies.
Additional Reading: Funding for Capital Projects
Though states offer some limited assistance for capital projects, districts have to cover an average of 80 percent of these costs themselves. These dollars can come from earmarked tax levies, but often, districts fund capital projects by issuing bonds. Low-wealth districts therefore have the hardest time building or renovating school facilities and often assume substantial debt to do so. This part of the school finance system falls far short of any reasonable definition of equity. For more, consult the following resources:
The 21st Century School Fund’s State of Our Schools 2025: America’s K–12 Facilities provides the most detailed and up-to-date look at facility conditions, the rules governing facilities, and the funding of capital projects.
The Education Commission of the States’s 50-State Comparison on K–12 School Construction Funding (2023) reviews state policies in this area.
The Urban Institute’s Assessing the National Landscape of Capital Expenditures for Public School Districts (2023) offers an analysis of the equity consequences of these systems, with students from low-income backgrounds attending schools in worse physical condition.
However, many states have intentional policies to assess property at less than full market value for tax purposes, or to exempt some of a property’s value from taxation. Homestead exemptions reduce the taxable value of owner-occupied homes. Exemptions for seniors, veterans, and disabled property owners reduce the amount of property tax paid by individuals in those categories. States and cities sometimes temporarily exempt certain newly built properties from property taxes to encourage development. And some states assess different types of property at different percentages of actual value, called “assessment ratios” (e.g., commercial and industrial property might be taxed on 75 percent of its full value, while residential and agricultural property might be taxed as though it were only worth 40 percent of its full value), effectively reducing the value of the tax base and differentiating the tax burden for owners of different property types. These policies affect school funding equity, adequacy, and stability, since every exemption changes who pays school taxes, and in what measure. However, they are rarely passed with an eye towards strengthening the school funding system. Education equity advocates should pay close attention to proposed property tax policy changes and consider how they will affect the equity of the system, including equity in who pays and equity in the amount of local tax revenue available to different school districts.
Privately Raised Funds
Private contributions play a small role in school finance, but they can be significant in particular schools or districts. These funds come from a range of sources, including incorporated “friends of the district” nonprofit foundations, parent organization fundraisers, in-kind contributions from local businesses, and direct-to-classroom donations on online crowdfunding platforms. These contributions are usually made for specific schools, classrooms, or district initiatives. In a sense, their targeted nature makes them the ultimate local funding. Schools and teachers in high-need districts might use these sources of funding to compensate for inadequate funding levels (for example, some teachers use Amazon wish lists to stock their classrooms). However, high-wealth districts tend to have access to larger amounts of private funding, since parents have the time and flexibility to run fundraisers and can count on local families to make purchases or donations. Additionally, property-wealthy districts sometimes use private fundraising as an end-run around the formal school funding system’s more aggressive equity provisions. This occurred in Vermont when the state first put in place its statewide tax pool and the problem needed to be addressed with further policy changes.13 In another example, the Highland Park Education Foundation raises substantial funding for one of Texas’s wealthiest districts,14 all of which is outside the public system and therefore outside the reach of the state’s equalizing recapture policy. Advocates and lawmakers should keep an eye on the ways in which private funds raised for individual schools and districts may be undermining the equity of the school funding system, and consider policies that limit their role.

Citations
- Kirk Fulford, "K–12 Education Funding Overview," presentation, Alabama Legislative Services Agency—Fiscal Division, Montgomery, AL, May 21, 2024, https://alison.legislature.state.al.us/files/pdf/lsa/Fiscal/Presentations/K-12-Education-Funding.pdf; and Kentucky Department of Education, "SEEK Executive Summary 6.24.2024" (Kentucky Department of Education, 2024), https://www.education.ky.gov/_layouts/download.aspx?SourceUrl=https://www.education.ky.gov/districts/SEEK/Documents/SEEK%20Executive%20Summary%206.24.2024.docx.
- Conn. Gen. Stat. § 10-262f; Massachusetts Department of Elementary and Secondary Education, "FY2026 Chapter 70 Presentation," accessed June 4, 2026, https://www.doe.mass.edu/finance/chapter70/fy2026/chapter-2026.pptx; and Virginia Department of Education, "Composite Index of Local Ability-to-Pay," School Finance, accessed June 4, 2026, https://www.doe.virginia.gov/data-policy-funding/school-finance/budget-grants-management/composite-index-of-local-ability-to-pay.
- Mo. Rev. Stat. § 163.011.
- Texas Education Agency, "Tax Year 2025 Maximum Compressed Tax Rates," June 12, 2025, https://tea.texas.gov/taa-letters/tax-year-2025-maximum-compressed-tax-rates.
- Iowa Legislative Services Agency, "School Funding Formula Review," presentation, School Funding Formula Review Committee, Des Moines, IA, October 23, 2024, https://www.legis.iowa.gov/docs/publications/K12OI/1444410.pdf.
- Mississippi Advisory Committee to the U.S. Commission on Civil Rights, Civil Rights and Education Funding in Mississippi, memorandum (U.S. Commission on Civil Rights, May 2025), 5, https://www.usccr.gov/files/2025-05/ms-memo.pdf.
- Louisiana Department of Education, "Overview of the Minimum Foundation Program (MFP) Formula," presentation, Louisiana Department of Education, Baton Rouge, LA, June 2024, https://doe.louisiana.gov/docs/default-source/minimum-foundation-program/e-mfp-presentation-june-2024.pdf?sfvrsn=5c216e18_0; and Massachusetts Department of Elementary and Secondary Education, "FY2026 Chapter 70 Presentation."
- Jonathan Rothwell and Andre M. Perry, "How Racial Bias in Appraisals Affects the Devaluation of Homes in Majority-Black Neighborhoods," Brookings Institution, December 5, 2022, https://www.brookings.edu/articles/how-racial-bias-in-appraisals-affects-the-devaluation-of-homes-in-majority-black-neighborhoods/.
- Zahava Stadler, Yi Li, Cassandra Lam and Nikki Carroll, Making Change: Favorable Conditions for Education Finance Reform (EdBuild, 2018), 9, https://edbuildna.org/content/making-change.
- Highland Park Education Foundation, "2024–2025 Mad for Plaid Donors," accessed June 8, 2026, https://www.hpef.org/annualmadforplaiddonors.