How Has Federal Funding for Early Education Changed Since 2010?
Blog Post
Dec. 7, 2011
CLARIFICATION 12/15: The table and chart in an earlier version of this post may have misled readers into thinking that all of the listed funding was for early childhood. Some of the programs listed – such as Title I, Race to the Top, i3 and Striving Readers – are designed to cover larger swaths of age ranges. We have replaced the table and chart to clarify that it is unclear how much funding in those programs assists in early childhood from birth through age 8. In the case of Title I, for example, analysts anticipate that only a tiny fraction – perhaps as little as 3 percent – is spent on children in their years before kindergarten.
As we wait for Congress to approve budgets for the Departments of Education and Health and Human Services, let’s pause to look at what has happened to federal early education funding over the past few years. Here’s a chart showing how several programs have fared since 2010:
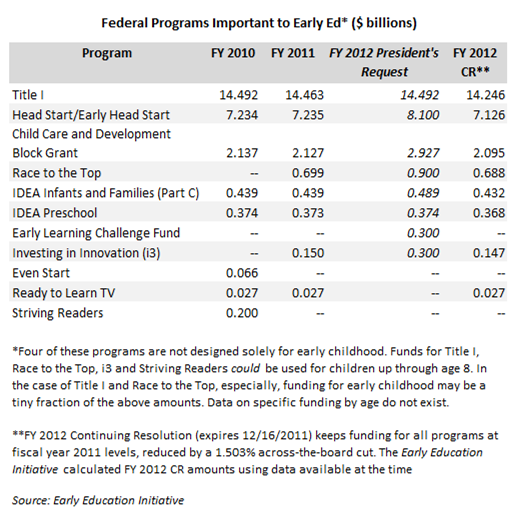
Though Congress is still working on full budgets for these programs within its nine remaining appropriations bills, funding is currently based on a temporary measure set to expire on December 16. This temporary measure – the FY 2012 CR in the chart above – has held funding for early education and other programs at fiscal year 2011 levels, save for a 1.503 percent across-the-board cut.
The administration has not yet released the numbers for program spending under the current CR, but for the chart above we calculated the approximate rate of spending based on 2011 levels and the 1.503 percent cut. The amount for each program, because it is based on the previous year’s funding, are barely changed from fiscal year 2011 levels.
Fiscal year 2010 funding for all of the programs listed in the table totaled $24.97 billion. in 2011, the programs saw a slight increase up to $25.52 billion; and in 2012 – so far – there has been only a very slight decrease from the previous year, to $25.13 billion. Of course, that number is still several billion dollars below the president’s budget request – $27.882 billion for fiscal year 2012 – but in reality, that number is generally considered wishful thinking anyway, as it reflects the president’s priorities and not congressional interests. Here’s another way to look at the numbers:
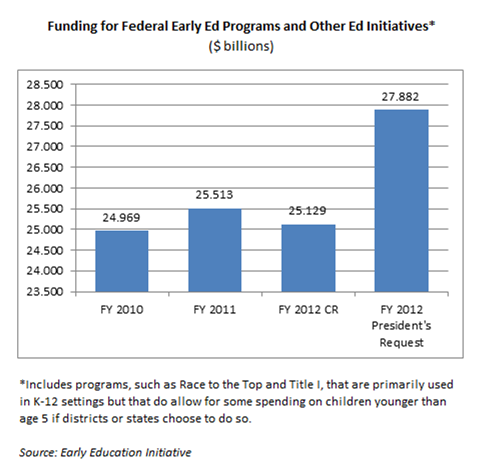
(By the way, we have included Title I, Race to the Top and the Investing in Innovation fund (i3) in this chart because some portion of those programs support public schools and community programs for children from birth to third grade. Unfortunately there is no easy way to gather hard data on what that proportion is exactly, so some of this money likely goes to middle schools and high schools as well.)
So as Congress nears the end of its rope on the funding bill currently in place, a few questions come to mind. First, what will the rest of fiscal year 2012 look like? If Congress continues to pass temporary funding measures, the numbers for early childhood education programs will remain roughly equivalent to last year’s levels – minus the 1.5 percent cut off the top. If lawmakers pass an appropriations bill to cover the Departments of Labor, Health and Human Services and Education, though, the numbers could look different. Politico reported this morning that Congress is starting to show interest in passing a final spending bill next week, instead of approving yet another stop-gap spending bill and waiting to pass the education appropriations bill (nine of twelve appropriations bills still need to be passed, including the Labor/HHS/Education package).
And what will happen in fiscal year 2013? As we’ve written, the debt ceiling agreement and subsequent failure of the supercommittee to reach a deal means that early education funding may reach lower overall levels than the current 2012 fiscal year, provided lawmakers don’t either adjust funding to protect early childhood programs, or cancel the sequester beforehand. For more on how the education budget might look in 2013, check out this post from Ed Money Watch that describes a scenario in which federal appropriations shrink to 2008 levels.
Check back at Early Ed Watch for further developments in the coming weeks and months. For more information on the federal appropriations process, check out this report from the Federal Education Budget Project.