

Congested roads, antiquated air traffic systems, and clogged ports — these are just a few of the manifestations of an infrastructure deficit that is undermining our economic efficiency and lowering our quality of life. Decades of underinvestment in basic infrastructure have produced a variety of bottlenecks across transportation, water, freight, and communication networks.
Why do we have an infrastructure deficit?
The infrastructure deficit is the result of a steady decline in government infrastructure spending, combined with a steady increase in the cost of building additional infrastructure. This national deficit is likely to grow as state and local governments, which account for a growing share of infrastructure spending, face budget cuts.
The decline in government infrastructure spending. As a share of U.S. GDP, spending on transportation and water infrastructure, which is more dependent on government spending than other types of infrastructure, has declined over the past fifty years, falling from 3.1% of GDP in 1959 to 2.4% of GDP in 2007. Infrastructure spending averaged 2.8% of GDP from 1960-1980 and 2.4% of GDP from 1990-2007, a decline in annual spending of 0.4% of GDP or $55 billion as measured in 2010 GDP. Most of the decline was made up by a decline in federal spending, which fell from 0.9% of GDP from 1960-1980 to 0.6% of GDP from 1990-2007.1
Rising raw materials prices. The rising prices of raw materials also undercuts infrastructure, by reducing the actual amount of infrastructure produced per dollar of spending. While nominal infrastructure spending on water and transportation increased from $277 billion in 2003 to $335 billion in 2007, real infrastructure spending fell by $24 billion, or 6.3%, during the same time period because of the rising costs of commodities like petroleum, iron, and gravel.2 Real infrastructure spending has thus declined significantly since the early 2000s even though nominal spending has risen.
Since 2007, commodity prices related to infrastructure investment have diverged. For example, prices for aggregate base have declined from $20.54 per ton to $14.20 per ton in 2010, according to the California Department of Transportation. Structural steel has declined in price from $6.97 per pound in 2007 to $2.15 per pound in 2010.3 But, the prices of other commodities like petroleum and copper have since increased in price, once again undermining infrastructure spending.
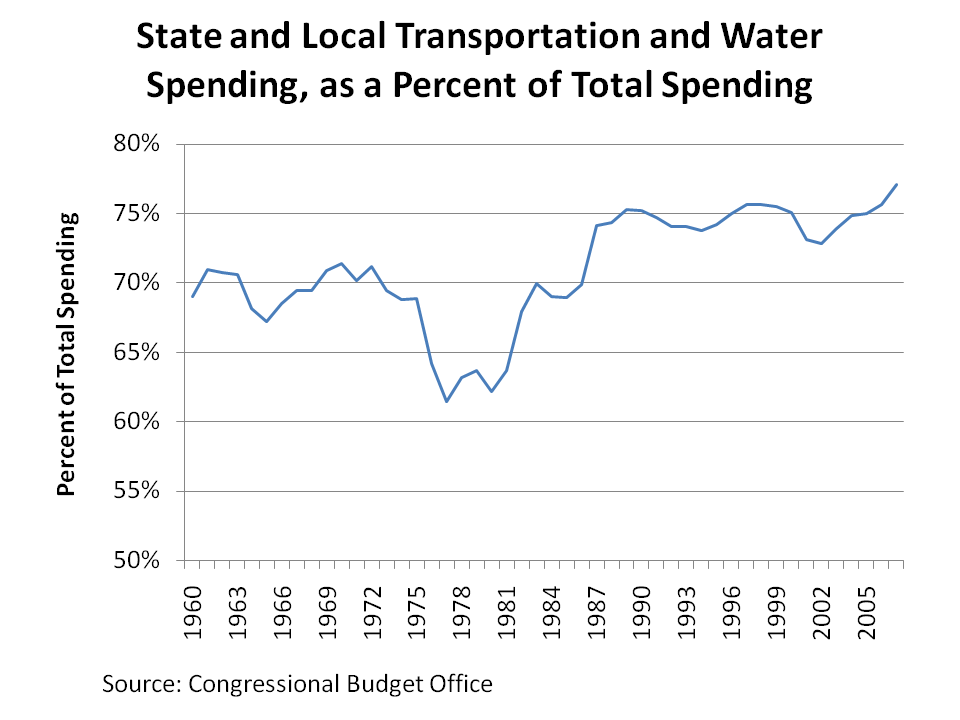
State and local government cutbacks. The infrastructure deficit may widen further as funding projects increasingly falls to state and local governments, many of which have faced declining revenues and budget cuts. The share of transportation and water infrastructure spending from state and local governments increased from an average of 68% of total spending from 1960-1980 to 75% from 1990-2007.4
Although cumulative state funding data are not available for 2008-2010, evidence indicates that infrastructure funding at the state level declined significantly with the Great Recession. For example, California’s transportation spending declined by 31% from FY2007-08 to FY2008-09 primarily due to a loss of revenue.5 The state transportation budget was also hit because of a fall in reimbursements from local government projects that were carried out by the state department of transportation. Local governments also experienced a decline in tax revenue. The Texas Department of Transportation budget, which fared better than California, fell 8% from FY2008 to FY2009.6 Although complete data for state and local infrastructure spending has not been gathered, it is clear that leaving a greater share of infrastructure spending to state and local governments makes infrastructure investment more vulnerable during downturns.
How big is the infrastructure deficit given our needs?
The American Society of Civil Engineers (ASCE) estimates the U.S. needs $2.2 trillion dollars of infrastructure spending during the next 5 years, of which $1.18 trillion has not been budgeted.7 8
Government agencies confirm the dire need for infrastructure repairs and upgrades. The Environmental Protection Agency estimates that from 2000-2019 the gap in spending for clean water will be $31 billion and the gap in spending for drinking water will be $45 billion, beyond an estimated 3% annual increase in funding. In the absence of increased spending on infrastructure, total shortfall for the 20-year period 2000-2019 would be $271 billion for clean water and $263 billion for drinking water.9
The Federal Highway Administration (FHWA) estimates that we must spend $105.6 billion annually from 2007 to 2026 to sustain current conditions and performance. To improve conditions annual expenditure could be up to $174.6 billion. The National Bridge Investment Analysis System (NBIAS) estimates $98.9 billion should be invested immediately to repair bridge deficiencies. The Highway Economic Requirements System (HERS) model estimates that $523.5 billion could be spent on roads and highways based on poor current conditions and operational performance.10 Across many modes of infrastructure, impacting every sector of the economy, there are significant needs for infrastructure repairs and upgrades.
America’s infrastructure deficit has grown over time as the government has neglected infrastructure spending and higher commodity prices have undercut infrastructure output. Recent state budget shortfalls have likely left many projects un-funded or underfunded. The infrastructure deficit has grown and is likely to worsen in the coming years because of rising commodity prices and budget cuts in state and local governments.
NEXT IN THE SERIES ON AMERICAN INFRASTRUCTURE: “Why the Recovery Act spending on infrastructure fell short”
Notes:
1. “Public Spending on Transportation and Water Infrastructure,” Congressional Budget Office, November 2010. http://www.cbo.gov/ftpdocs/119xx/doc11940/11-17-Infrastructure.pdf
2. “Public Spending on Transportation and Water Infrastructure,” Congressional Budget Office, November 2010. http://www.cbo.gov/ftpdocs/119xx/doc11940/11-17-Infrastructure.pdf
3. “Price Index for Selected Highway Construction Items,” California Department of Transportation, January 2011. http://www.dot.ca.gov/hq/esc/oe/contract_progress/cost-index-summary.pdf
4. “Public Spending on Transportation and Water Infrastructure,” Congressional Budget Office, November 2010. http://www.cbo.gov/ftpdocs/119xx/doc11940/11-17-Infrastructure.pdf
5. Most current 2007-2008 data available in the 2009-2010 California State Budget. http://2009-10.archives.ebudget.ca.gov/pdf/GovernorsBudget/2000/2660.pdf Most current 2008-2009 data available in the 2010-2011 California State Budget. http://2010-11.archives.ebudget.ca.gov/pdf/GovernorsBudget/2000/2660.pdf
6. “2010 Unified Transportation Program (UTP),” Texas Department of Transportation: Finance Division. ftp://ftp.dot.state.tx.us/pub/txdot-info/tpp/2010_final_utp_0503.pdf
7. These investments would repair aviation systems, bridges, dams, drinking water, power grids, hazardous waste, navigable waterways, public parks & recreation, rail, roads schools, security, solid waste, transit, and wastewater systems.
8. “Report Card for America’s Infrastructure 2009,” American Society of Civil Engineers, March 25, 2009. http://www.infrastructurereportcard.org/sites/default/files/RC2009_full_report.pdf
9. “The Clean Water and Drinking Water Infrastructure Gap Analysis,” Environmental Protection Agency, September 2002. http://www.epa.gov/ogwdw/gapfact.pdf
10. “2008 Status of the Nation’s Highways, Bridges, and Transit: Conditions and Performance,” Federal Highway Administration, U.S. Department of Transportation, 2009. http://www.fhwa.dot.gov/policy/2008cpr/index.htm
Downloads
More About the Authors


