Living on Credit
Table of Contents
Acknowledgments
The authors would like to thank the numerous researchers, experts, and practitioners who graciously shared their insights, knowledge, and experiences, and those who took the time to review an early draft of this paper: New America colleagues Clare McCann, Rachel Fishman, Amy Laitinen, and Sabrina Detlef, along with Jason Delisle of the American Enterprise Institute, and Colleen Campbell of the Center for American Progress. Maria Elkin, Ellie Budzinski, and Riker Pasterkiewicz provided layout and communications support.
This work would not have been possible without the generous support of Lumina Foundation and the Bill & Melinda Gates Foundation. The views expressed in this paper are of the authors alone.
Downloads
Introduction
Over the past 20 years, college tuition has increased considerably, sparking robust national conversations about student indebtedness and spurring a movement to make college tuition-free.1 But while tuition payments are often an investment in skills and knowledge, tuition is not the only cost putting college out of reach. Students must also pay for non-tuition expenses, including books, supplies, housing, food, and transportation, not to mention added costs like health care, and, for the one in four students with a dependent, child care.
In many cases, these non-tuition expenses eclipse the prices listed for students’ coursework. According to the College Board, in the 2017 school year, the average annual tuition published by community colleges was a modest $3,570, but the average total cost of attendance, which includes tuition along with non-tuition expenses, came to $17,580.2 That means tuition constitutes only about 20 percent of the average community college student’s total sticker price, with the remaining 80 percent associated with non-tuition expenses. Non-tuition expenses also exceed the sticker price of tuition for students attending public four-year universities in-state and living on campus.3 Since students in public two- and four-year schools make up three-quarters of all undergraduates, living costs—not tuition bills—are the primary drivers of educational expenses for many students.4 Despite this, relatively little is known about how much and how often student debt is driven by non-tuition expenses.
Student loans are available to help with direct costs like tuition and fees and indirect costs like living expenses. Rather than being provided directly to the student, these loan dollars flow through the college in which a student plans to enroll. Upon receiving the loan funds, the college first uses the loan disbursement to cover the tuition and fees the student owes, with any additional dollars borrowed provided in the form of a refund that can be used to cover living expenses or other necessary non-tuition costs. While federal student loans come with annual and aggregate borrowing limits, other types of education loans, such as federal loans to parents or private student loans, are often available to cover the entire cost of attendance, though they are much less commonly used. In practice, these other loans function similarly to federal student loans, in that any amount borrowed in excess of tuition and fees is made available to the student to cover his or her outside expenses.
Our analysis suggests that students are primarily borrowing to cover tuition, supplies, and minimal living expenses.
While the rationale for borrowing to cover tuition has been accepted by many, the use of student borrowing to pay for non-tuition expenses is substantially more controversial.5 On the one hand, since many students’ options for covering their non-tuition expenses are limited, they may have no choice but to borrow to pay for non-tuition elements of their education or else forgo certain expenses. However, some college administrators and federal policymakers believe that students are borrowing to live lavishly.6 Indeed, the research suggests that most undergraduates must make complicated choices in order to maximize their current and future well-being,7 since covering basic needs enables them to perform well in school even if it requires taking on debt. But borrowing increases risks later down the road.
Whether and how much to borrow for non-tuition expenses is not just a problem for students. In addition to existing requirements that penalize colleges when a high percentage of former students default on their loans, colleges may soon face additional scrutiny for other loan repayment outcomes, according to recent statements from Lamar Alexander, Chairman of the Senate Committee on Health Education, Labor & Pensions.8 Aid administrators on campus must carefully balance providing students the resources they need to succeed without damaging their own loan repayment metrics.9
To better understand the extent to which students are borrowing for non-tuition expenses, this report explores the relationship between the net price of tuition and fees paid by each student to the amount borrowed in federal student loans, loans to parents, and private loans. We use data from the National Postsecondary Aid Study for the 2015–16 school year, a nationally representative survey of undergraduate students.
Our exploration indicates that the majority of undergraduate students are not relying on loans at all. In fact, just 38 percent of undergraduates borrowed for their education in the 2015–16 school year, and fewer than one-third of students borrowed more than they paid in tuition and fees. However, among students who take on debt, borrowing for non-tuition costs is indeed the norm: three of four borrowers took on debt levels that exceeded what they paid in tuition and fees. The ability to borrow above the cost of tuition may lead some stakeholders to question whether students are subsidizing unnecessary expenses with student loans. Instead, our analysis suggests that students are primarily borrowing to cover tuition, supplies, and minimal living expenses. Other key findings include:
- After accounting for inflation, the amount students are borrowing for non-tuition costs has changed very little over the last two decades. Among undergraduate students who borrowed in 1999–2000, the average borrower took on $3,309 more than she paid in tuition and fees. In 2015–16, that number had actually dropped, to $2,558.
- The schools that students attend are correlated with whether they borrow, and whether those loans are applied to non-tuition costs. For example, while only 14 percent of students at public two-year institutions take on any debt, nearly all these who borrow use some portion of their loans for non-tuition expenses. On average, borrowers at public two-year institutions take out nearly $4,000 more than they paid in tuition and fees.
- Since enrollment differs widely between sectors of higher education, the share of students who borrow within each sector does not reflect the number of students who do so. For instance, we estimate that about 4.7 million undergraduates borrow more than they pay in tuition and fees. While a similar share of students at private nonprofit and public four-year institutions borrow for non-tuition expenses, this translates to a little more than a million students at private nonprofit schools and about 2.6 million who attend public four-year institutions. Just over 800,000 community college students and less than 400,000 students at for-profit colleges do the same.
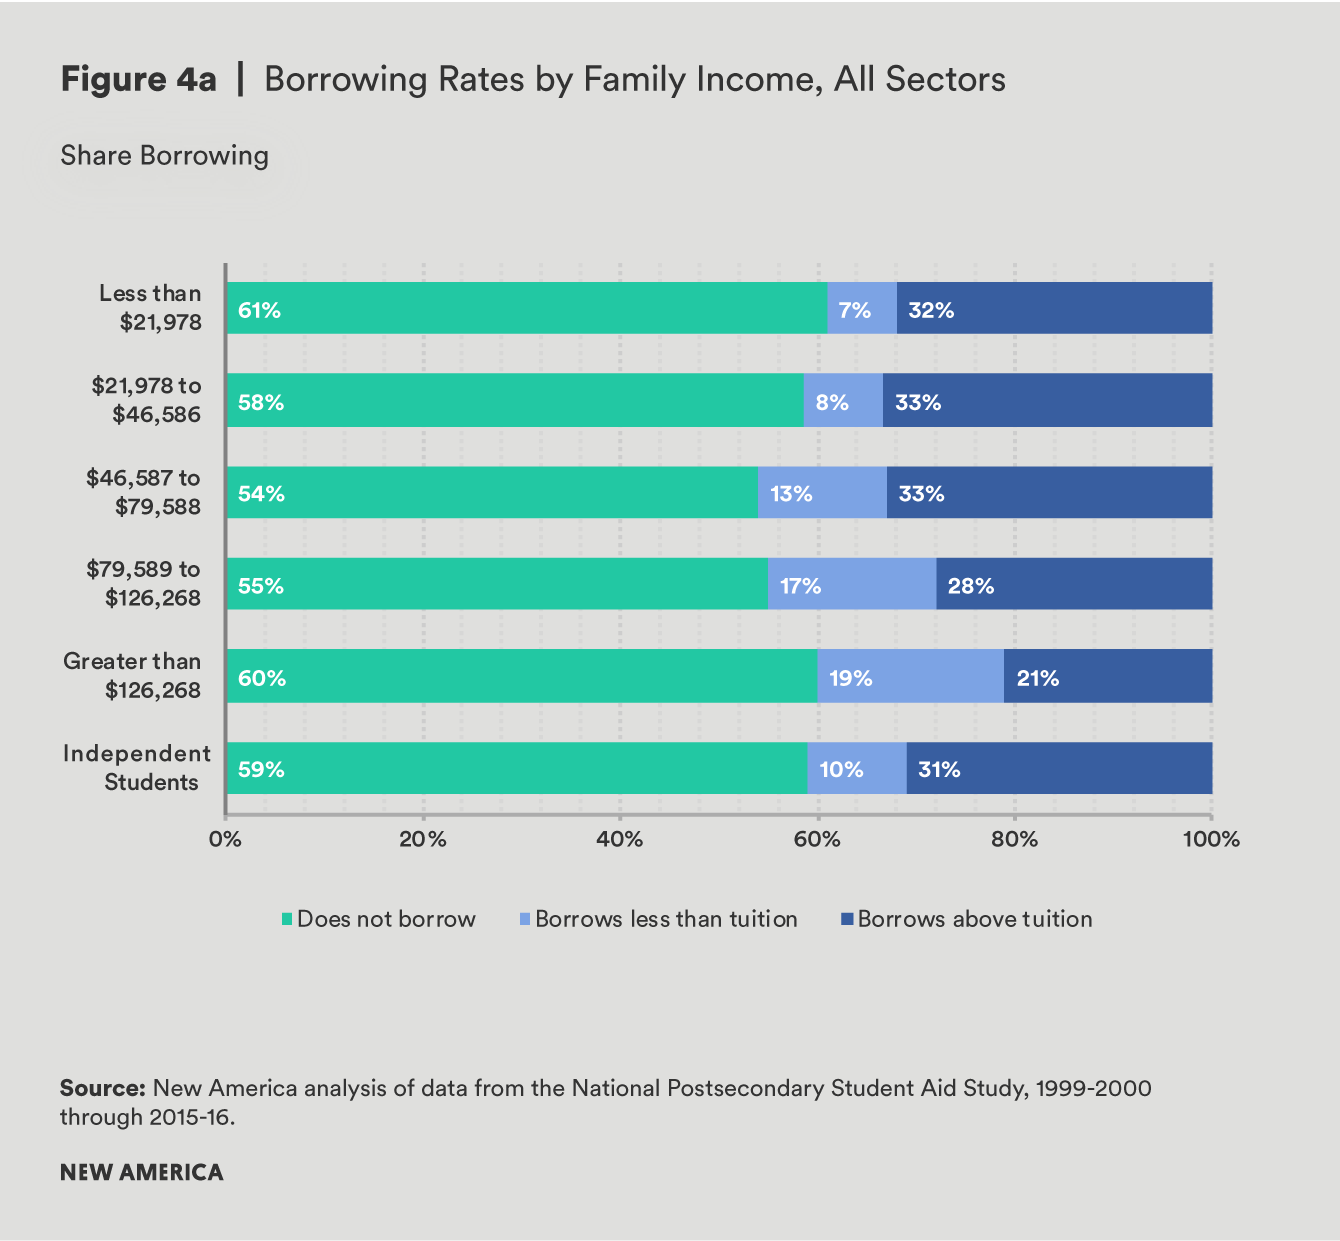
- Students who come from low-income families are more likely to borrow in excess of tuition. While two in five students from the lowest income quintile borrow loans for any reason, one third borrow more than they paid in tuition and fees. In comparison, while a similar share of students from families in the top income quintile borrow, just one in five borrow more than they paid in tuition and fees.
- Within each sector, low-income students tend to borrow more for non-tuition expenses than their higher-income peers. In addition, students within the same income category borrow more often for non-tuition expenses if they attend public or nonprofit institutions. This indicates that both family income level and the type of institution a student attends can impact borrowing decisions, including whether or not a student borrows for non-tuition expenses.
In order to better understand how and why students borrow for non-tuition costs, we begin with a discussion about why debt used to cover these outside expenses plays a pivotal role in many students’ academic lives, including how the impetus for borrowing might differ based on a student’s socioeconomic background, and the tradeoffs that borrowing for living expenses poses for not only students but also institutions and taxpayers. We devote the remainder of our analysis to understanding student borrowing over time, as well as how students’ income and institutional sector relate to whether or not they borrow for non-tuition expenses. We then explore the extent to which other factors—including race, degree type, whether students enroll full- or part-time, and where students live—are correlated with borrowing decisions. Finally, armed with a more accurate depiction of the amount and likelihood that different students borrow above tuition, we discuss the policy implications of financing non-tuition expenses with debt.
Citations
- For more information on free college proposals see: “The Laboratories of Free College,” New America, n.d. source.
- source.
- Ibid.
- National Center for Education Statistics, “Higher Education General Information Survey (HEGIS). “Fall Enrollment in Colleges and Universities” surveys, 1970 through 1985; Integrated Postsecondary Education Data System (IPEDS), “Fall Enrollment Survey” (IPEDS-EF:86-99); IPEDS Spring 2001 through Spring 2016, Fall Enrollment Component; and Enrollment in Degree-Granting Institutions Projection Model, 2000–2026,” U.S. Department of Education, February 2017, source.
- Robert Farrington, “Don’t Use Student Loans to Pay for Living Expenses,” The College Investor, February 4, 2017, source.
- Emily Wilkins, “No Restrictions on Item Buys With Student Aid Card:Official,” Bloomberg BNA, January 24, 2018, source.
- Ben Castleman, “When it Comes to Student Loans, There’s No Simple Nudge,” Brown Center Chalkboard, Brookings Institution, September 1, 2015, source.
- Senate Committee on Health, Education, Labor & Pensions, “Risk-Sharing/Skin-in-the-Game Concepts and Proposals,” 114th Cong., 1st sess., March 23, 2015, source.
- For additional reading, see: Ben Miller, “Getting Repayment Rates Right,” Center for American Progress, July 10, 2018, source.
Data and Methodology
This analysis uses the National Postsecondary Student Aid Study, drawing on data from the 1999–2000, 2003–04, 2007–08, and 2011–12 school years, with a focus on the 2015–16 school year. Estimates of borrowing for non-tuition costs are based on the total amount a student or his parents borrowed that year, including federal loans to students and parents, and private, state, and institutional loans. We then subtract the amount a student paid in tuition and required fees after any grants and scholarships have been applied. In this way, both grants and loans are applied to tuition first, and any loan amount in excess of the tuition and fees paid is allocated toward non-tuition expenses. We also categorize students according to whether they borrow amounts equal to or less than what they pay in tuition and fees, borrow more than they pay in tuition and fees, or do not borrow at all.
Background
Our analysis shows that a similar share of students borrow for their education, regardless of their family incomes. But on average, students from families in lower socioeconomic brackets1 tend to enroll in open access schools, including community colleges and for-profit institutions, more often than their upper-income peers. In comparison, wealthier students are much more likely to be found at nonprofit and public four-year universities.
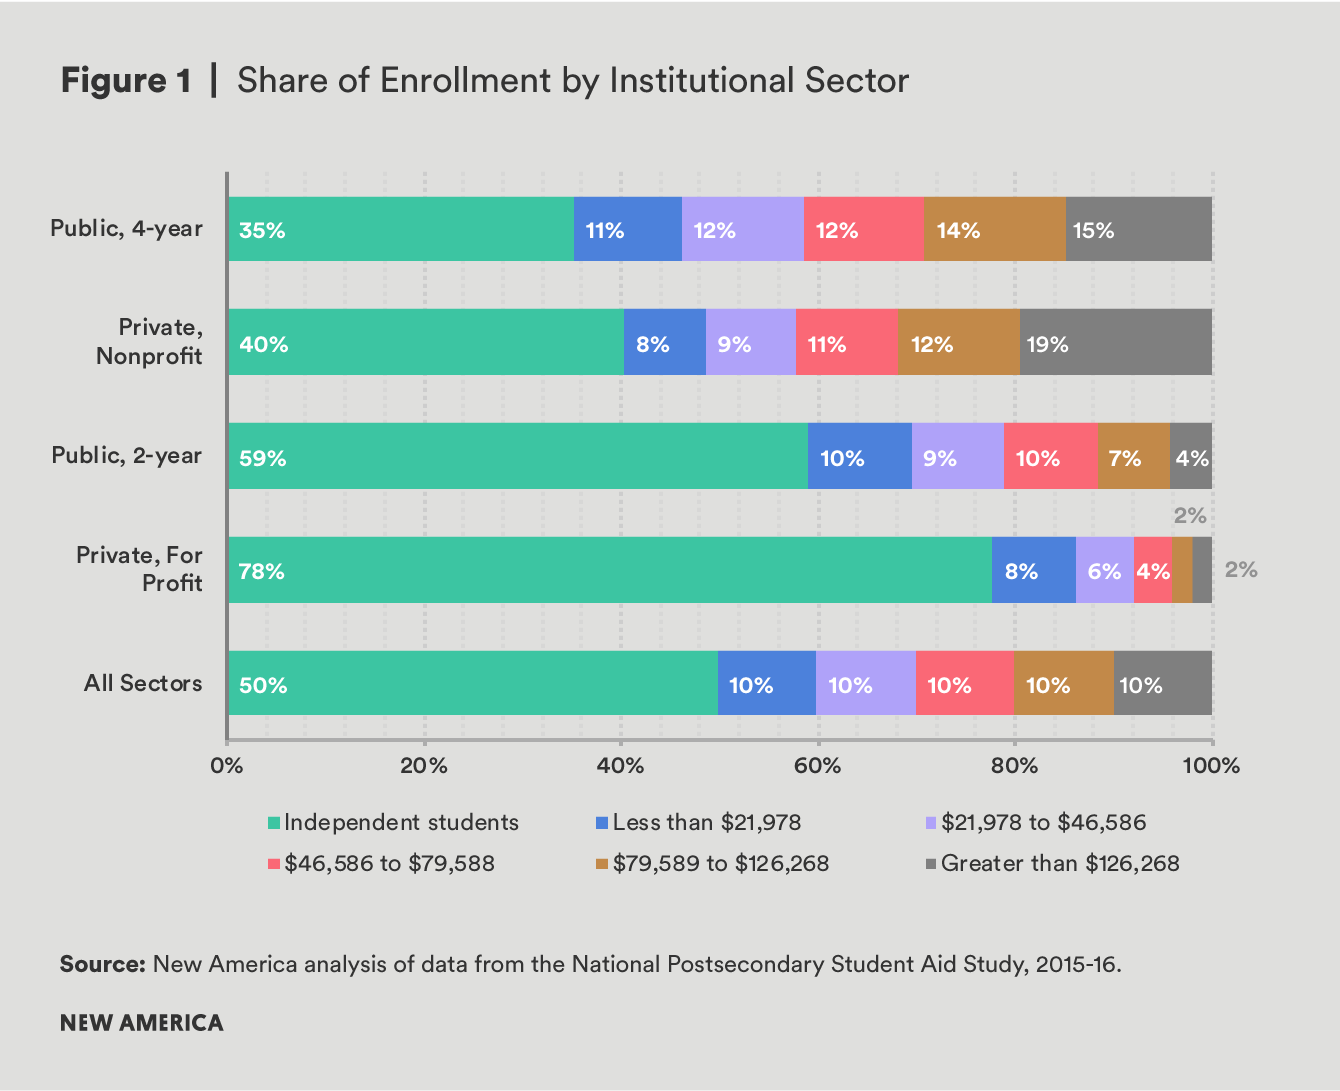
For wealthy students and families who are able to pay a significant amount out of pocket, many still take on loans, likely in order to attend more expensive schools that they perceive to be a better investment in their future.2 Additionally, for these students and their families, taking out student loans may be more desirable than paying out of pocket due to the convenience, relatively low interest rates, and flexible repayment terms available on federal loans. Conversely, many low- and middle-income students are not able to draw on family support and savings or other external resources in the same way. For them, federal or private loans may be a necessary source of funding regardless of where they choose to go to school, so many low- and middle-income students who borrow could be doing so for entirely different reasons than their wealthier peers.
For students who lack sufficient financial resources to cover non-tuition expenses, research shows that the shortfall can have a profound impact on their experiences in college. For instance, a 2014 study found that nearly two-thirds of college students had neglected to buy a textbook because it was unaffordable, and half reported taking fewer or different classes because of textbook costs.3 More worrisome, a nationally representative Urban Institute study of undergraduate students found that 11 percent of students at four-year colleges struggled to pay for food, along with 14 percent of students at vocational schools.4 The study also found that over the post-recession years, community college students were especially struggling, when as many as one in five were food insecure.5
Many low- and middle-income students who borrow could be doing so for entirely different reasons than their wealthier peers.
However, with nearly 7 million federal student loan borrowers currently in default6—a designation that can harm borrowers’ credit, lead to wage garnishment and loss of federal benefits or tax refunds, and often increases the amount borrowers owe7—taking on debt for higher education is not a decision that should be entered into lightly. These risks associated with borrowing can lead students to borrow less than they need or cause them to eschew borrowing altogether, even when unmet need is high.8 Discomfort with debt can also cause students to forgo higher education completely if they cannot afford to cover unmet need out of pocket. In these cases, borrowing (or borrowing more) could help close critical deficits. According to a study by Benjamin Marx and Lesley Turner, community college students with unmet need who borrowed more both enrolled in and completed more credits than those who did not. The research team also concluded that students who borrowed performed better academically as a result of their borrowing.9
There are risks to colleges when students take on federal debt, and these risks are more severe for some colleges than others. Indeed, as the cost of higher education has risen for both students and taxpayers, federal policymakers have expressed interest in strengthening accountability metrics for student outcomes, with a particular focus on whether students are able to repay their loans.10 These policies strive to protect students and taxpayers from risky debts, by cracking down on schools where students default at high rates, or whose former students have debt levels that make repayment difficult in light of their post-graduation earnings.11 However, while penalizing programs with poor loan outcomes makes sense, the near-exclusive emphasis on loan outcomes has unintended consequences: rather than focusing on improving loan repayment by raising graduation rates or the economic value of degree programs, many schools are instead looking for ways to limit student borrowing in the first place.12 Others are jettisoning federal student loans altogether to avoid the threat of losing access to other forms of federal financial aid.13
These risks to colleges are somewhat constrained by federal limits on student borrowing. The amount of federal loans available to undergraduates is limited in two ways: through loan limits, and through the school’s total cost of attendance.
Students face limits on federal loans that range from $5,500 to $12,500 per year, depending on whether the student is considered dependent or independent and how far along she is in her education. Federal student loans also come with aggregate caps of $31,000 to $57,500 for undergraduates. While the availability of private student loans, federal Parent PLUS loans, and loans from a variety of other sources such as a state or a school means that students are technically able to borrow above these specified thresholds, these other loans are much less common than federal student loans. For instance, while 36 percent of undergraduates borrow federal direct loans, only 4 percent of parents borrow federal loans on their behalf, and only 6 percent of students borrow non-federal loans.14 In fact, less than half (45 percent) of all borrowers take on the maximum annual federal direct loan for which they are eligible. This means that in practice, many students and their parents are unwilling or unable to borrow in excess of—or even up to—their federal direct student loan eligibility.15
We rely on a conservative definition of the amount borrowed for non-tuition costs by considering any grant aid received or any loans borrowed by students or their parents, and from both federal and other sources, to be applied first to tuition payments, with any excess funds then attributable to non-tuition expenses.
Given that federal student borrowing limits are fixed regardless of how much a student is paying in tuition, and that other types of loans are relatively rare, colleges with high tuition leave less room for a student to borrow for non-tuition expenses because a student may reach his annual loan limits more quickly. This means that students with the greatest room to borrow for their non-tuition expenses are those who attend low-tuition schools.
Students are also constricted in how much they can borrow by the cost of attendance of their school. Cost of attendance is a federally-defined term that includes both direct costs and non-tuition expenses and is the estimated budget for one academic year. Colleges have significant discretion to estimate non-tuition expenses as they see fit, and these estimates are factored into the total cost of attendance, which can have a major impact on the amount that students are able to access in both grants and loans.16 For instance, if a school takes a conservative approach to estimating non-tuition expenses, students may be restricted in the amount of financial aid they can access. This cap cannot be exceeded from all sources of financial aid, including federal loans to students or their parents, any state and institutional aid, and even private loans. However, students rarely borrow the full amount of their cost of attendance; on average, borrowers in 2015–16 took on $8,746 less than their cost of attendance minus any grant or scholarship aid. Just 16.5 percent of borrowers take on the full amount for which they are eligible based on their cost of attendance and any grants or scholarships received.17
This report explores the share of students borrowing for their non-tuition costs and how much money they borrow. Since educational loans can be used for any element of a student’s cost of attendance, we do not attempt to differentiate where individual pots of money are allocated. Instead, we rely on a conservative definition of the amount borrowed for non-tuition costs by considering any grant aid received or any loans borrowed by students or their parents, and from both federal and other sources, to be applied first to tuition payments, with any excess funds then attributable to non-tuition expenses. Under our model students can only be said to borrow for non-tuition costs if the amount they borrow exceeds their tuition charges after grants and scholarships from all sources have been taken into account. This allows for a consistent evaluation of borrowing for non-tuition costs.
Citations
- We include independent students as a single category, because NPSAS does not contain information on parental income and because substantially less variation in income levels exists for these students. For instance, about half of all independent students earn less than $20,000 per year, while about 20 percent earn over $50,000. In contrast, among dependent students less than 20 percent of students are from families making less than $20,000 and 20 percent are from families earning more than $125,000.
- Beth Akers, Kim Dancy, and Jason Delisle, The Affordability Conundrum: Value, Price, and Choice in Higher Education Today (New York: Manhattan Institute, April 12, 2017), source.
- Ethan Senack, Fixing the Broken Textbook Market: How Students Respond to High Textbook Costs and Demand Alternatives (Washington, DC: Student Public Interest Research Groups, January 2014), source.
- Kristin Blagg, Craig Gundersen, Diane Whitmore Schanzenbach, and James P. Ziliak, Assessing Food Insecurity on Campus (Washington, DC: Urban Institute, August 2017), source.
- Ibid.
- Federal Student Aid (website), “Federal Student Loan Portfolio,” U.S. Department of Education, March 2018, source.
- Federal Student Aid (website), “Don’t Ignore Your Student Loan Payments or You’ll Risk Going into Default,” U.S. Department of Education, n.d. source.
- Aliza F. Cunningham and Deborah A. Santiago, Student Aversion to Borrowing: Who Borrows and Who Doesn’t (Washington, DC: Institute for Higher Education Policy and Excelencia in Education, December 2008), source.
- Benjamin M. Marx and Lesley J. Turner, Student Loan Nudges: Experimental Evidence on Borrowing and Educational Attainment (College Park, MD: University of Maryland, January 2018), source.
- Federal accountability measures are currently confined to federal loan outcomes, but recent attempts to include private and institutional debt in an accountability framework have caused some concern for administrators. In particular, the Gainful Employment regulations codified in 2014 intended to hold colleges accountable for all student debt and stoked debate about the appropriate way to address money borrowed for living expenses.
- U.S. Department of Education, “Obama Administration Announces Final Rules to Protect Students from Poor-Performing Career College Programs,” press release, October 30, 2014, source.
- Ben Barrett and Amy Laitinen, Off Limits: More to Learn Before Congress Allows Colleges to Restrict Student Borrowing (Washington, DC: New America, May 2017), source.
- Debbie Cochrane and Laura Szabo-Kubitz, States of Denial: Where Community College Students Lack Access to Federal Student Loans (Oakland, CA: The Institute for College Access and Success, June 2016), source.
- Ibid.
- Ibid.
- Robert Kelchen, Braden J. Hosch, and Sara Goldrick-Rab, “The Costs of College Attendance: Trends, Variation, and Accuracy in Institutional Living Cost Allowances” (paper presentation, Association of Public Policy and Management, October 2014), source.
- Based on authors’ calculations using 2016 National Postsecondary Student Aid Study (NCES 2018484, restricted use data license), source.
Borrowing Rates Over Time
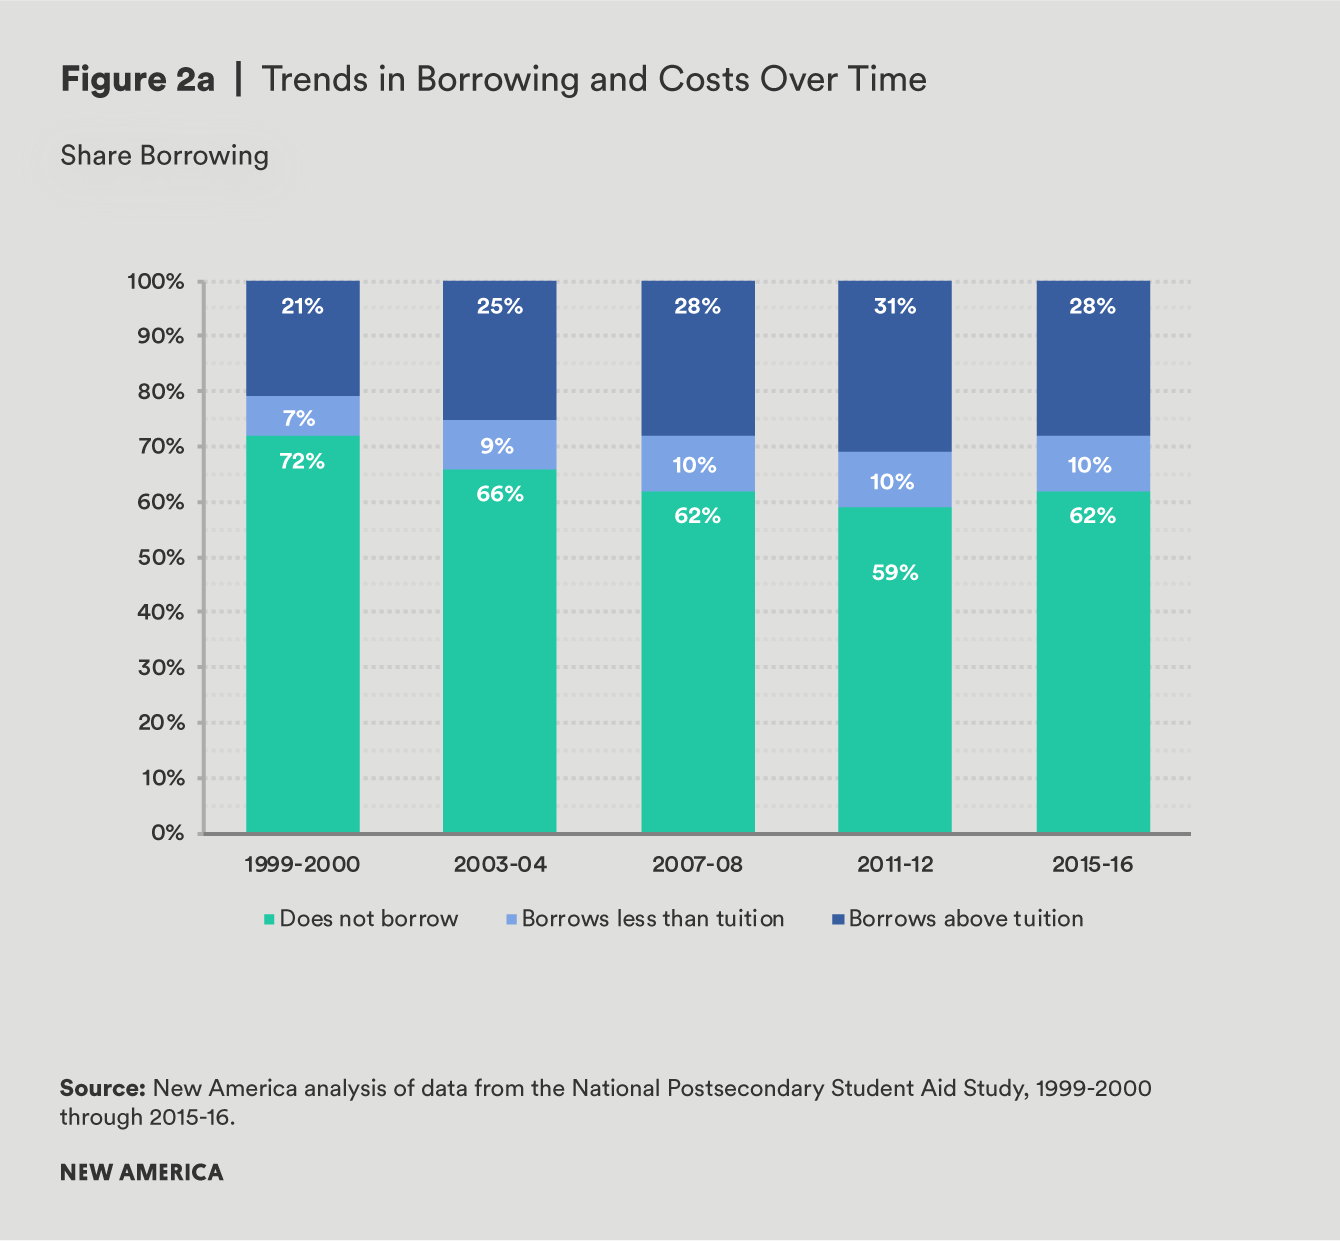
While the media often portray student debt as a near-universal experience, it is actually far from it. Just 38 percent of undergraduates took on any student debt during the 2015–16 school year: 10 percent of students borrowed below tuition costs, while 28 percent borrowed more than they paid in tuition and fees. However, many more students borrow today than in the past. In 1999–2000, only 28 percent of students borrowed, and 21 percent of undergraduates took on more than they paid in tuition and fees that same year.1
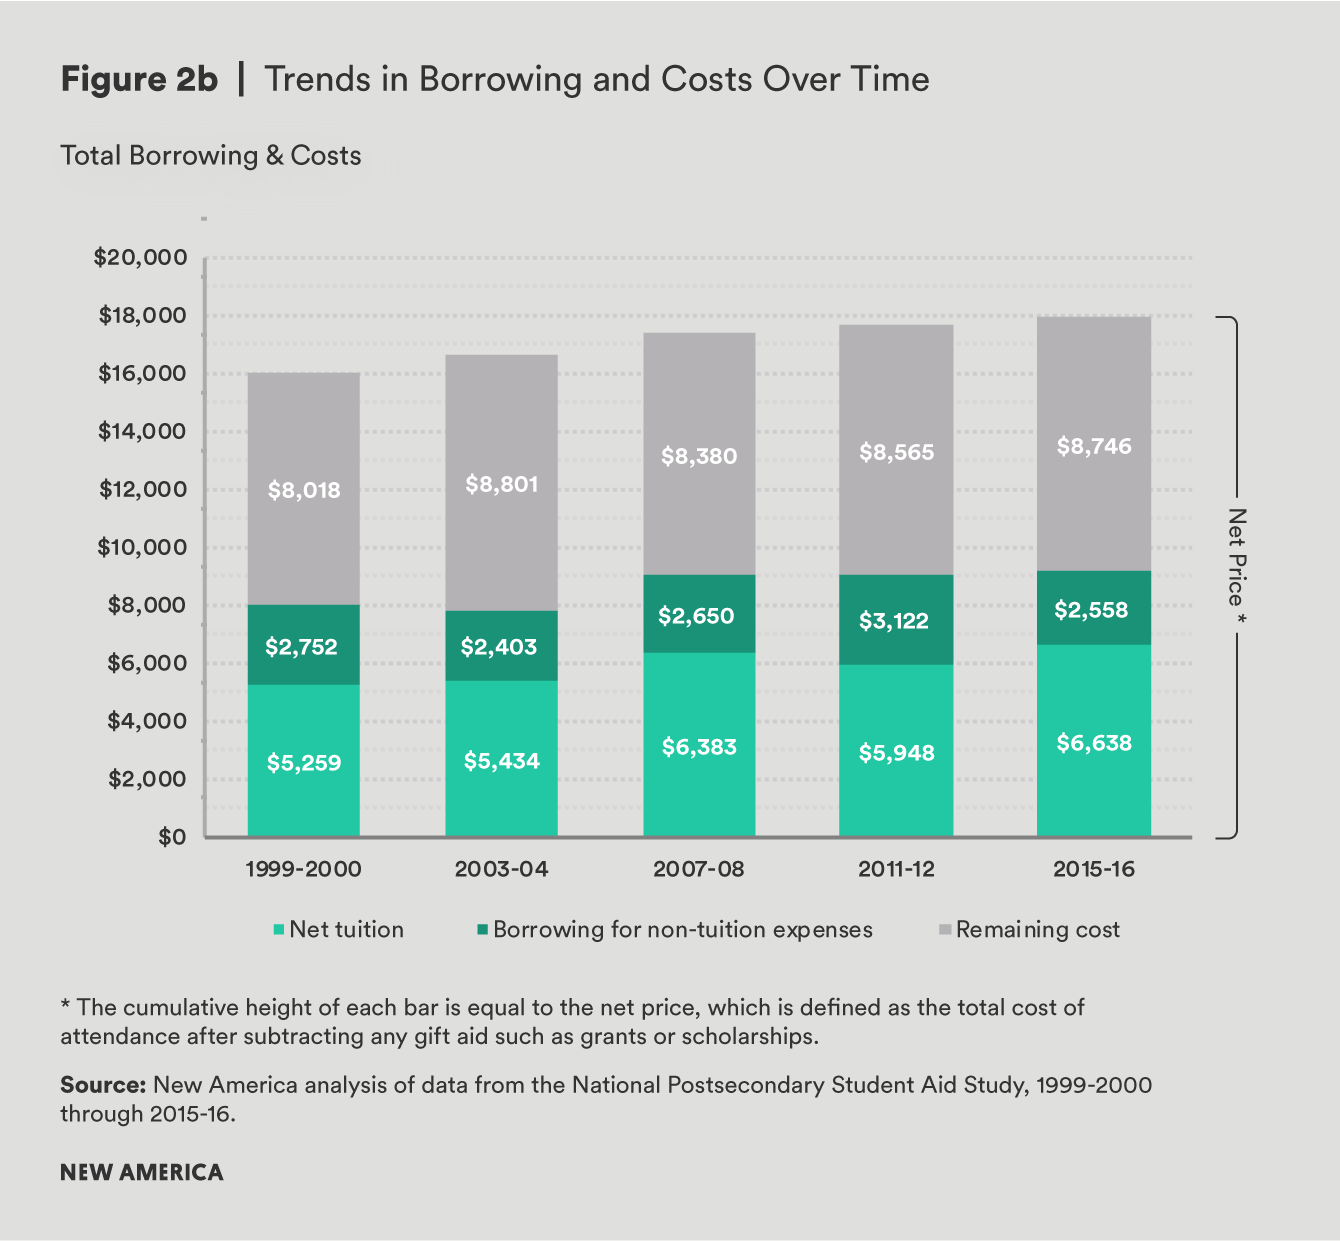
The typical undergraduate with debt now borrows, on average, $9,196 each year, including federal student loans, loans to parents, and other educational loan sources (see Figure 2). And even though undergraduate borrowing rates have increased significantly over the past 15 years, the amount of debt students take on has remained relatively flat after adjusting for inflation. This may be partially due to federal loan limits that have remain unchanged over that time and low utilization rates of private loans and loans to parents.2 The minimal growth in undergraduate student borrowing is made all the more surprising by the fact that the average net price, the amount students pay for tuition, has continued to tick up. In effect, the amount students borrow for their non-tuition costs has actually fallen over the last several years. The average borrower took out $2,558 more than the amount paid in tuition and fees in the 2015–16 school year, a figure that is about $800 less than the comparable amount in 1999–2000.
What are non-tuition expenses?
We use “non-tuition expenses” throughout this paper to refer to costs incurred by students such as housing and meals, transportation, books, personal expenses, and other miscellaneous items. While some non-tuition expenses may be more closely linked to a student’s educational experiences (such as books or a personal computer for completing assignments), research has shown that paying for basic needs like housing and meals is necessary for student success.3
The remainder of this analysis will delve into the amount students borrow across several characteristics. First, we explore how a student’s choice of institution and his or her family income relate to borrowing for non-tuition expenses, as well as how these two key factors interact. We then turn to an exploration of several other factors, including a student’s race, degree level, enrollment intensity, residency, and housing. Unless otherwise noted, all dollar amounts shown apply to the subset of undergraduates who borrow at least one dollar in student loans.
Citations
- Integrated Postsecondary Education Data System (IPEDS), Fall Enrollment Survey (IPEDS-EF: 95-99), National Center for Education Statistics, November 2017 and IPEDS Spring 2001 through Spring 2017, Fall Enrollment Component, National Center for Education Statistics, November 2017, source.
- FinAid (website), “Historical Loan Limits,” source.
- Benjamin M. Marx and Lesley J. Turner, Student Loan Nudges: Experimental Evidence on Borrowing and Educational Attainment (College Park, MD: University of Maryland, January 2018), source.
Borrowing for Non-Tuition Costs, Family Income, and Sector of Enrollment
Institution Sector
Borrowing behavior varies considerably according to the type of institution that a student attends. For instance, over half of students at private nonprofit and for-profit institutions took out loans in the 2015–16 school year, while just 14 percent of students at public two-year institutions did so.
Differences also emerge in the share of students borrowing in excess of tuition and fees across sectors. Of students at for-profit, private nonprofit, and public four-year institutions, a similar share borrow for non-tuition expenses. This means that much of the variation in the overall share of student borrowing can be attributed to differences in the share of student borrowers who take on debt for tuition costs only. In contrast, even though students at public two-year institutions have much lower rates of borrowing than the other three sectors, nearly all borrowers take on more than they pay in tuition and fees.


Similarly, among students who borrow, the average amount borrowed across all loan sources (including private loans and loans to parents) ranges from $9,000 to $11,000 per year, with the exception of borrowers at community colleges, who borrow far less. These similarities in overall borrowing amounts are complicated by the highly variable tuition that students pay. At public four-year institutions, borrowers pay about $5,000 in tuition and fees after accounting for grants and scholarships, while those at private nonprofit institutions pay over twice that figure, and community college students who borrow pay just one-tenth of that amount.
Related to this wide variation in the net price of tuition, the amount borrowed for non-tuition costs differs significantly across sectors. While students at for-profit institutions typically borrow less than they owe in tuition and fees, students at public four-year institutions apply about $4,000 toward non-tuition expenses.
Family Income Level
Across all sectors, family income is also closely related to whether or not a student borrows in excess of institutional charges.1 Although students from low- and high-income families borrow student or parent loans at roughly the same rate (40 percent), nearly a third of low-income students borrow more than they pay in tuition and fees. Among high-income students, however, just 20 percent borrow for their non-tuition expenses.

High-income students also borrow far more. With an average of $7,680 in total annual loan debt, low-income borrowers take on about half the amount of those in the highest income category. Despite borrowing less in total, low-income dependent borrowers are much more likely to borrow for their non-tuition costs. Whereas low-income borrowers take on $3,806 more than their net price of tuition, the average high-income borrower takes out $793 less than what he pays in tuition and fees.
In light of the heavy sorting that results between various sectors of higher education based on family income (see Figure 1), analyzing student borrowing rates across these two factors independently only provides a partial glimpse into student borrowing behavior. The following tables focus first on low-income students across sectors of enrollment, before turning to students with varying income levels at public four-year institutions, in order to exemplify broader trends in borrowing for non-tuition expenses at the intersection of family income and institutional sector (see appendix for a detailed breakdown of borrowing behavior by sector and enrollment).
Institutional Sector, Low-Income Students Only
When looking exclusively at low-income students, many of the same patterns seen for all students emerge. Low-income students at community colleges still borrow at much lower rates than low-income students in every other sector, and nearly all borrowing is driven by non-tuition costs for this income group. In contrast, low-income students at private nonprofit and for-profit institutions borrow at much higher rates than those enrolled in either community colleges or public four-year universities, but the share borrowing above the cost of tuition is much lower.


Low-income borrowers at public four- and two-year institutions borrow the lowest dollar amounts by a significant margin. Nonetheless, both groups rely on larger loan amounts to cover non-tuition expenses.
Family Income Level, Public Four-Year Schools Only
Taken together, it is clear that institutional sector is related to borrowing decisions, even among students from similar economic backgrounds. At the same time, students within a given sector can have vastly different experiences based on their family income. In order to explore this, we focus on students of all income levels attending public four-year schools (more detailed breakdowns of student borrowing across income and sector are available in the appendix).

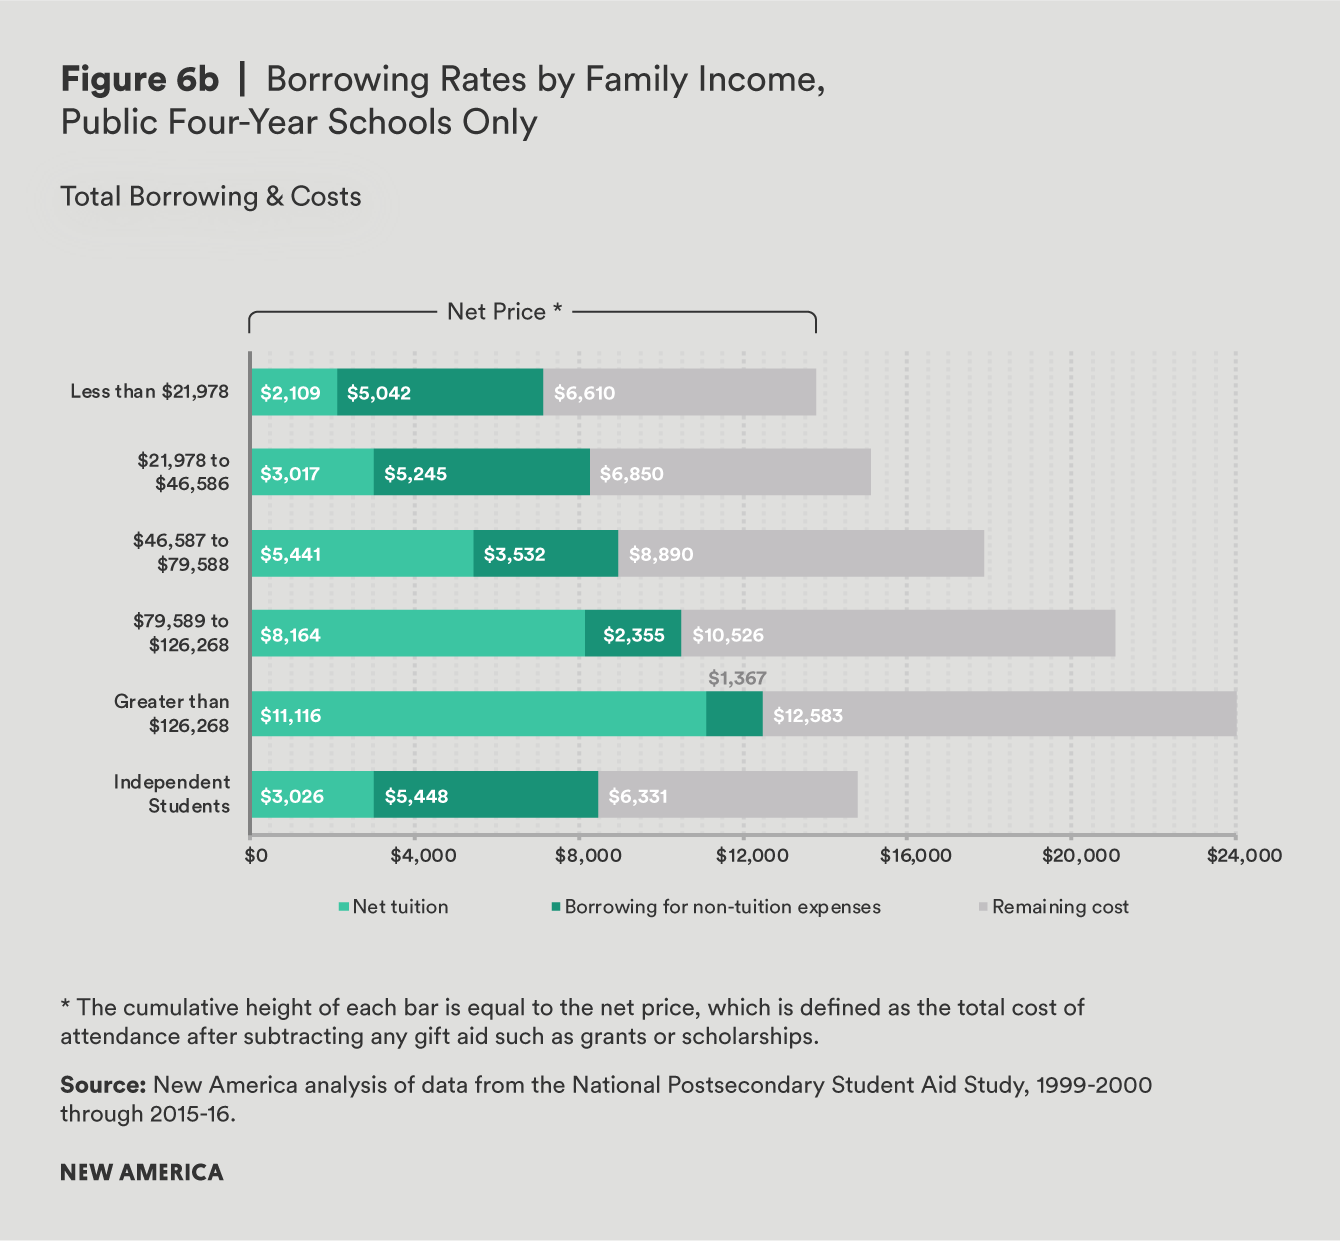
Among students at public four-year schools, those from low-income families are only slightly more likely to borrow than their upper-income peers. For instance, while 53 percent of low-income students at public four-year institutions borrow, 44 percent of those in the highest income quintile do the same. However, when it comes to borrowing for non-tuition costs, 46 percent of low-income dependent students at public four-year schools borrow more than they pay in tuition and fees, compared to just 24 percent of high-income students in the same sector. This pattern is similar to what we see at private nonprofit and for-profit institutions, as well as community colleges, indicating that family income is related to whether or not students borrow for non-tuition costs regardless of the sector of the institution they attend.2
What may be surprising, however, is that even among students attending the same type of institution, the average low-income student borrows significantly less than a student from a higher-income family. For instance, while low-income students at public four-year schools borrow an average of $7,151, students at these schools from the highest income category borrow on average $12,484—or over $5,000 more. This pattern holds across all types of institutions (see appendix).
Importantly, although low-income students tend to borrow less overall–in part because they face lower tuition prices—the amount they borrow for non-tuition expenses tends to be higher within every sector of higher education. Since low-income students and their families have fewer resources to devote to the cost of college, this may explain why they are more likely to use loans to cover non-tuition expenses.
Citations
- We show family income for dependent students only. Because of the way NPSAS measures income information, parental income for independent students is not available. Instead, earnings for independent students often reflect their earnings while enrolled in school, however, these earnings are not always an accurate reflection of the economic circumstances of the student or her family.
- See Appendix for a full breakdown of these numbers by institutional sector and family income.
Borrowing for Non-Tuition Costs and Other Factors
While family income and institutional sector are critical to understanding student borrowing decisions, there are many other factors of interest. The following section highlights variation in the share of students who borrow and how those loans are allocated across tuition and non-tuition expenses according to a student’s race and ethnicity, degree type pursued, enrollment intensity, and residency status.
Race/Ethnicity
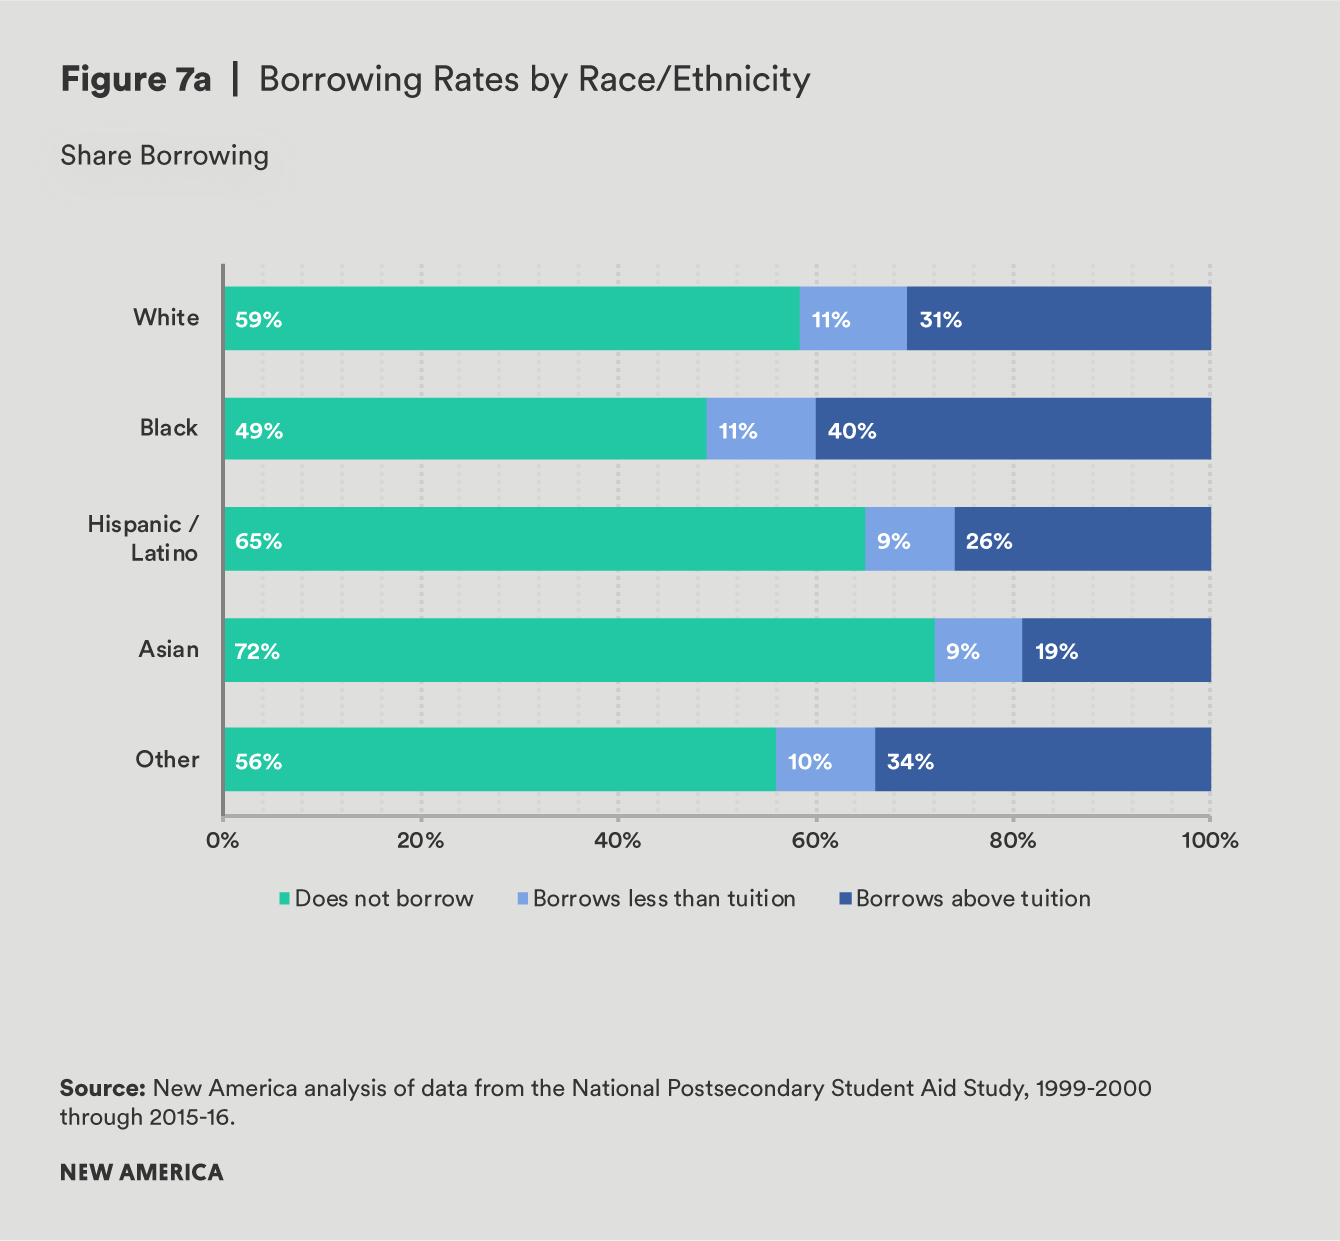
Black students were significantly more likely than any other racial or ethnic group to borrow for their education, but they are also far more likely to borrow in excess of the net price of tuition. In contrast, Asian students—the group which borrowed the least often—were also the least likely to borrow in excess of tuition. For white and Hispanic students, the share of students borrowing overall and the share borrowing above the cost of tuition were comparable.
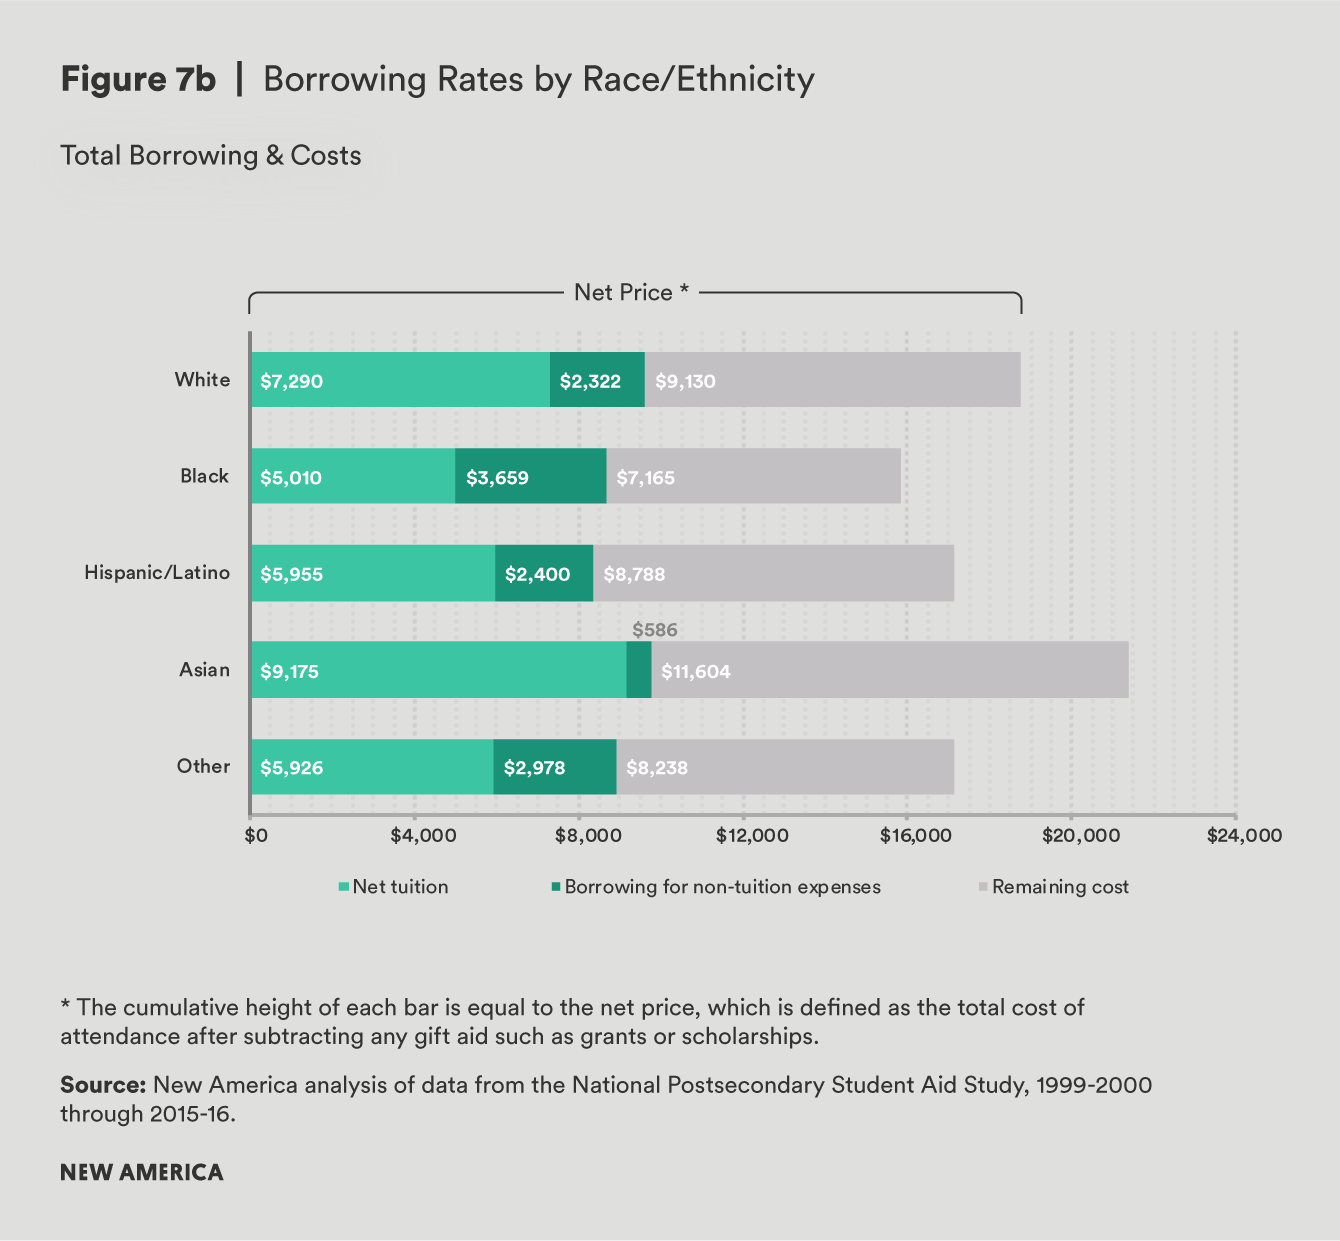
While there is wide variation in the rate at which students from different ethnic and racial groups borrow, among those who do, there is only a slight range in average annual loan amounts, from a low of $8,395 for Hispanic borrowers to a high of $9,761 for Asian borrowers. Upon closer inspection, however, there are key differences in the amount borrowed for non-tuition expenses among these groups. On average, black borrowers use more than $3,600 of their total loans for non-tuition costs, compared to white and Hispanic borrowers, who take out more than $1,000 less for their non-tuition expenses. At the low end, Asian students borrow only $586 for their non-tuition expenses.
Degree Type
A larger share of bachelor’s degree-seeking students borrow compared to other degree levels, followed by certificate-seeking students, and then associate degree-seekers, who borrow at the lowest rates. Notably, although a smaller share of students borrow, those in associate degree programs are just as likely to borrow in excess of their net tuition price as those enrolled in certificate programs.
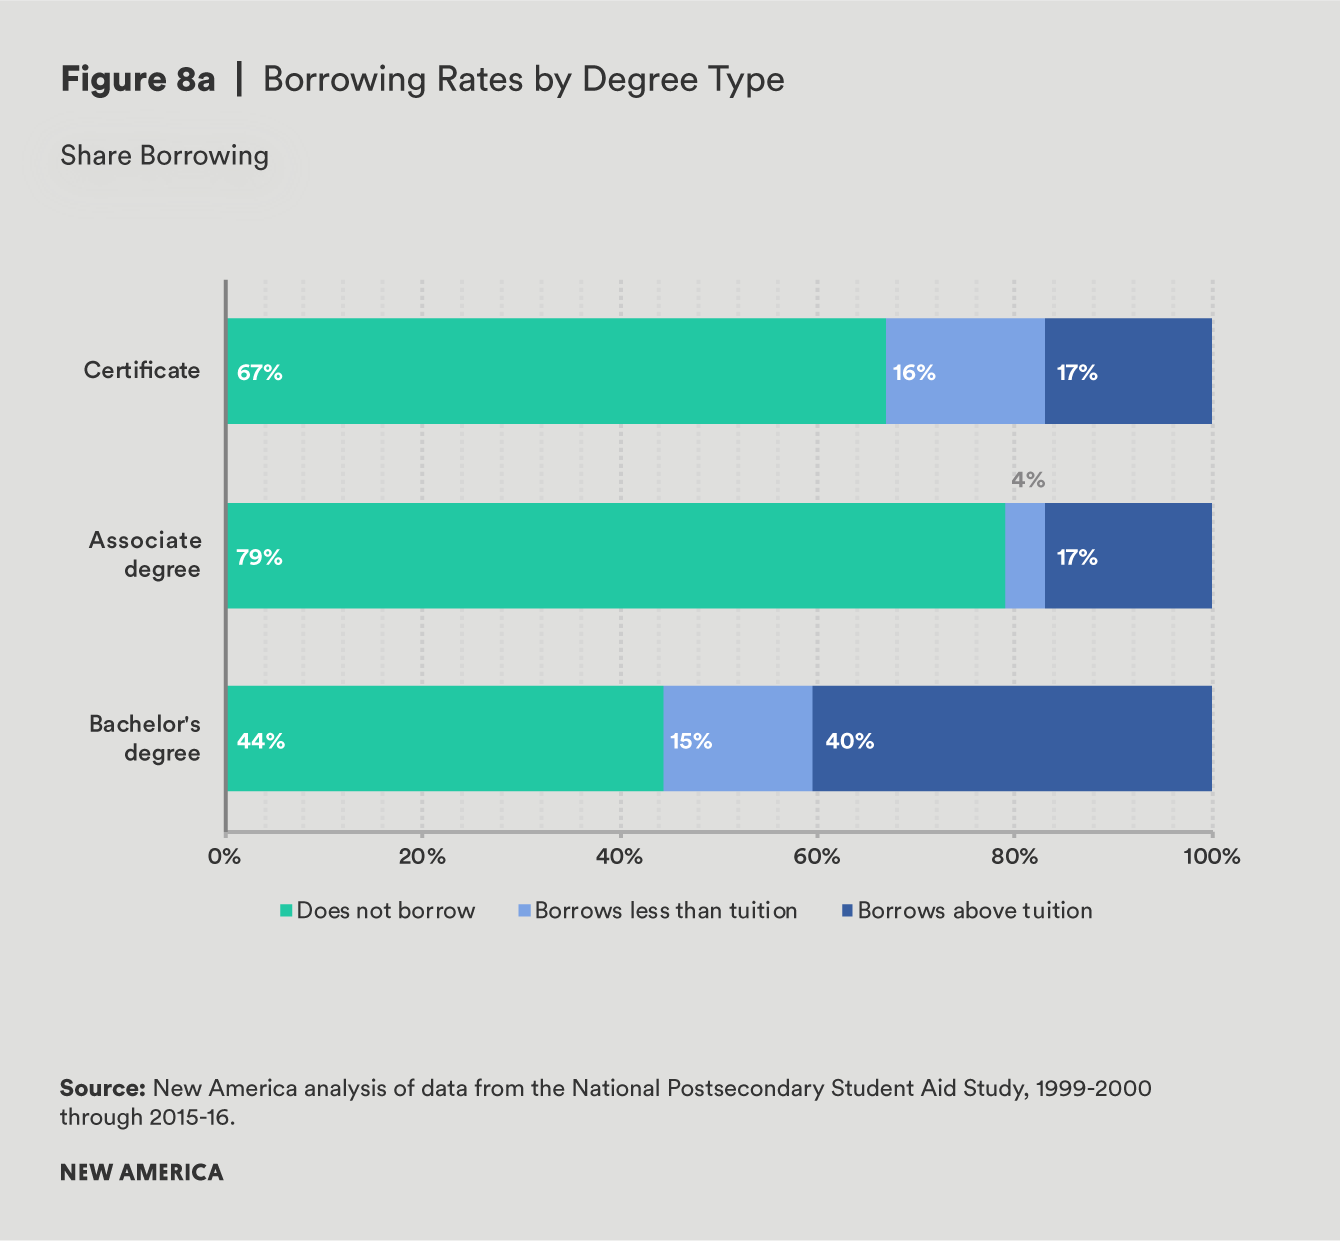
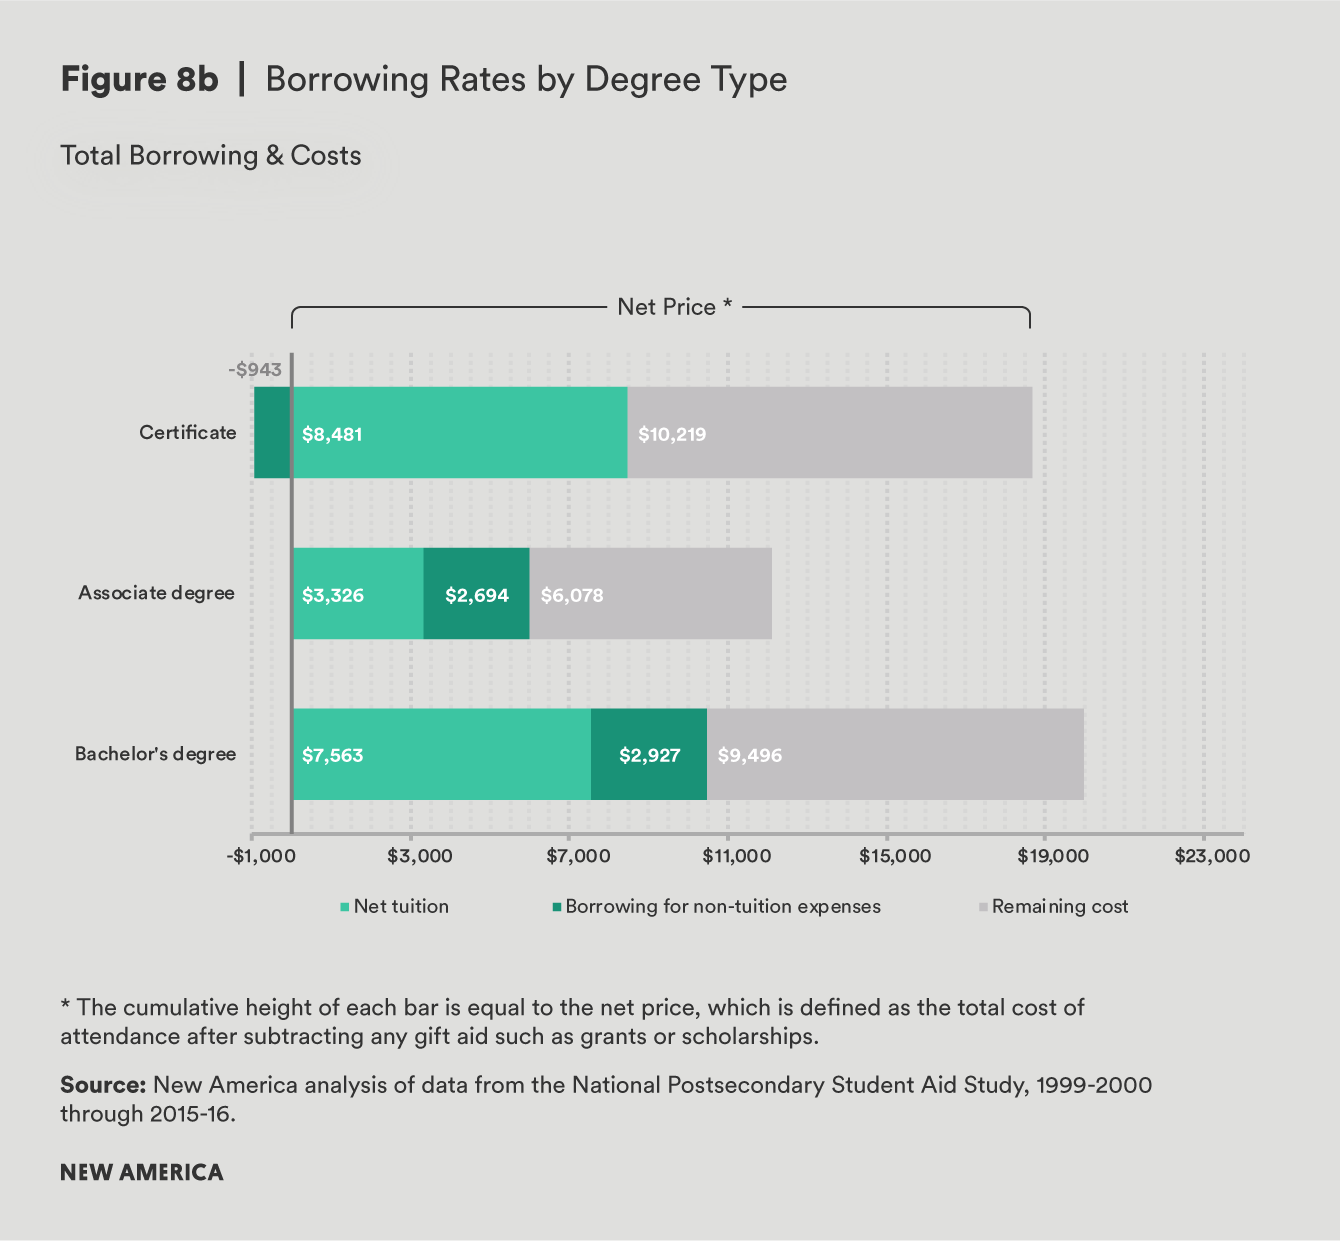
Overall, students in bachelor’s degree programs are not only far more likely to borrow, but they are also the largest share of students to borrow above the price of tuition. Whereas 40 percent of students pursuing a bachelor’s degree borrow more than they pay in tuition and fees, only 17 percent of students in an associate or certificate degree program do so. This is true despite the fact that the net prices students pay are actually higher for certificate-seeking students than those in bachelor’s degree programs. The average bachelor’s degree-seeking borrower takes out several thousand dollars more, yet pays less in tuition and fees than the average certificate-seeking borrower. As a result, the amount that can be attributed to non-tuition costs is higher for bachelor’s degree students.
Enrollment Intensity
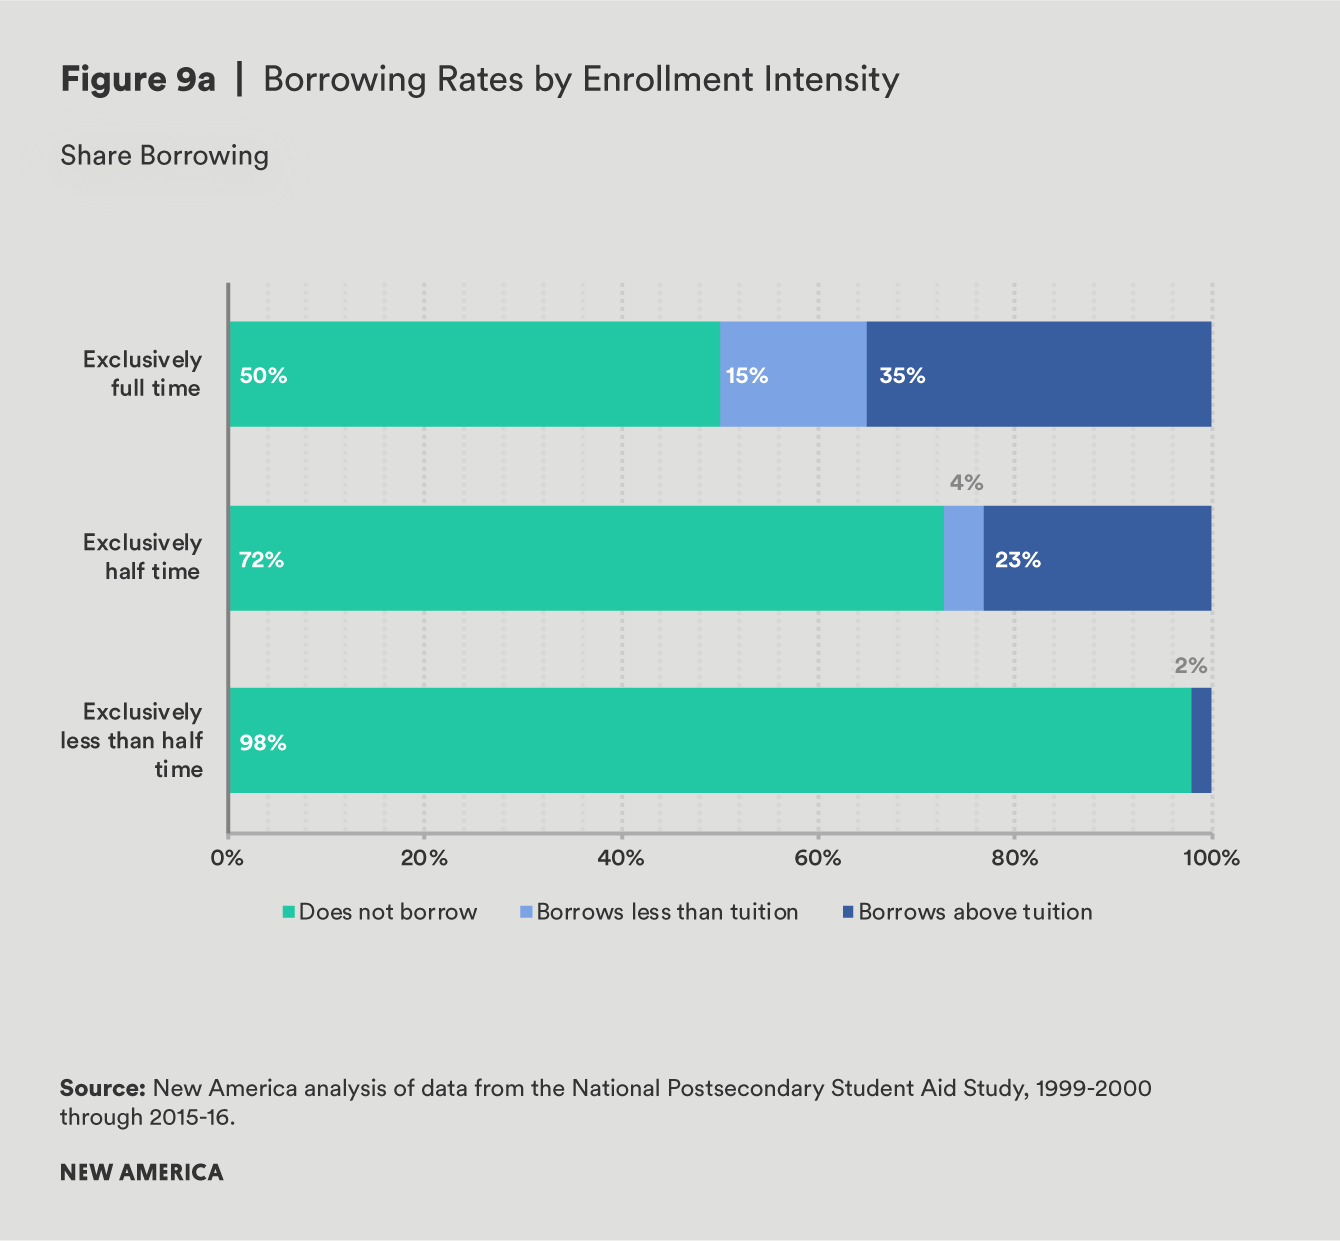
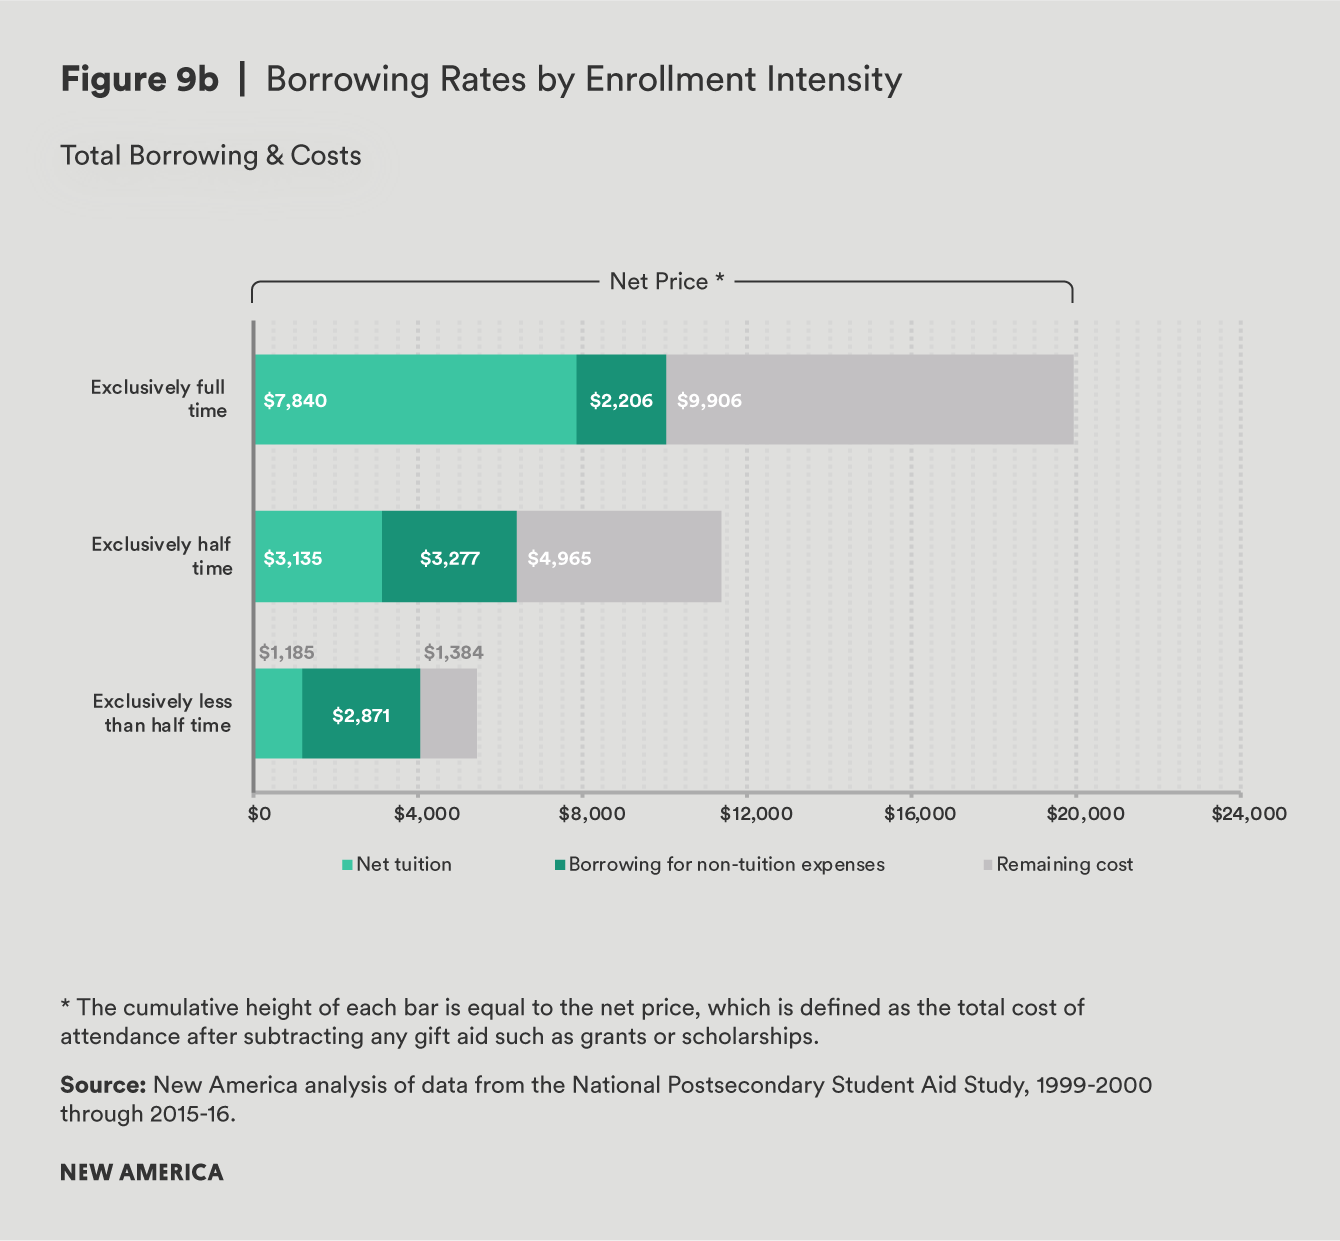
Student borrowers who enroll part time are much less likely to borrow than those who go to school full time. While 50 percent of full-time students borrow, only about 30 percent of those who enroll at least half time but less than full time take on debt. Among borrowers, those who enroll part time borrow nearly $4,000 less than those who enroll full time, but surprisingly, this does not necessarily mean part-time students borrow less for their non-tuition expenses. Gaps in total borrowing by enrollment intensity are more than offset by differences in the net tuition paid. In other words, the average part-time borrower faced a net tuition of just $3,061, nearly $5,000 less than that paid by the average full-time student. And as a result, part-time students applied more of their debt toward their non-tuition expenses.
One explanation for this counterintuitive finding is likely related to how loan limits are set. Unlike the federal Pell grant, loans are not prorated for part-time students. This means that students who enroll part time are still eligible to borrow the same amount for their non-tuition costs as their full-time peers. In some cases, there may be valid reasons for part-time students to borrow for their non-tuition costs, such as needing to borrow to reduce work hours while enrolled. Nonetheless, there could be valid concerns that these students are borrowing more than is absolutely necessary.
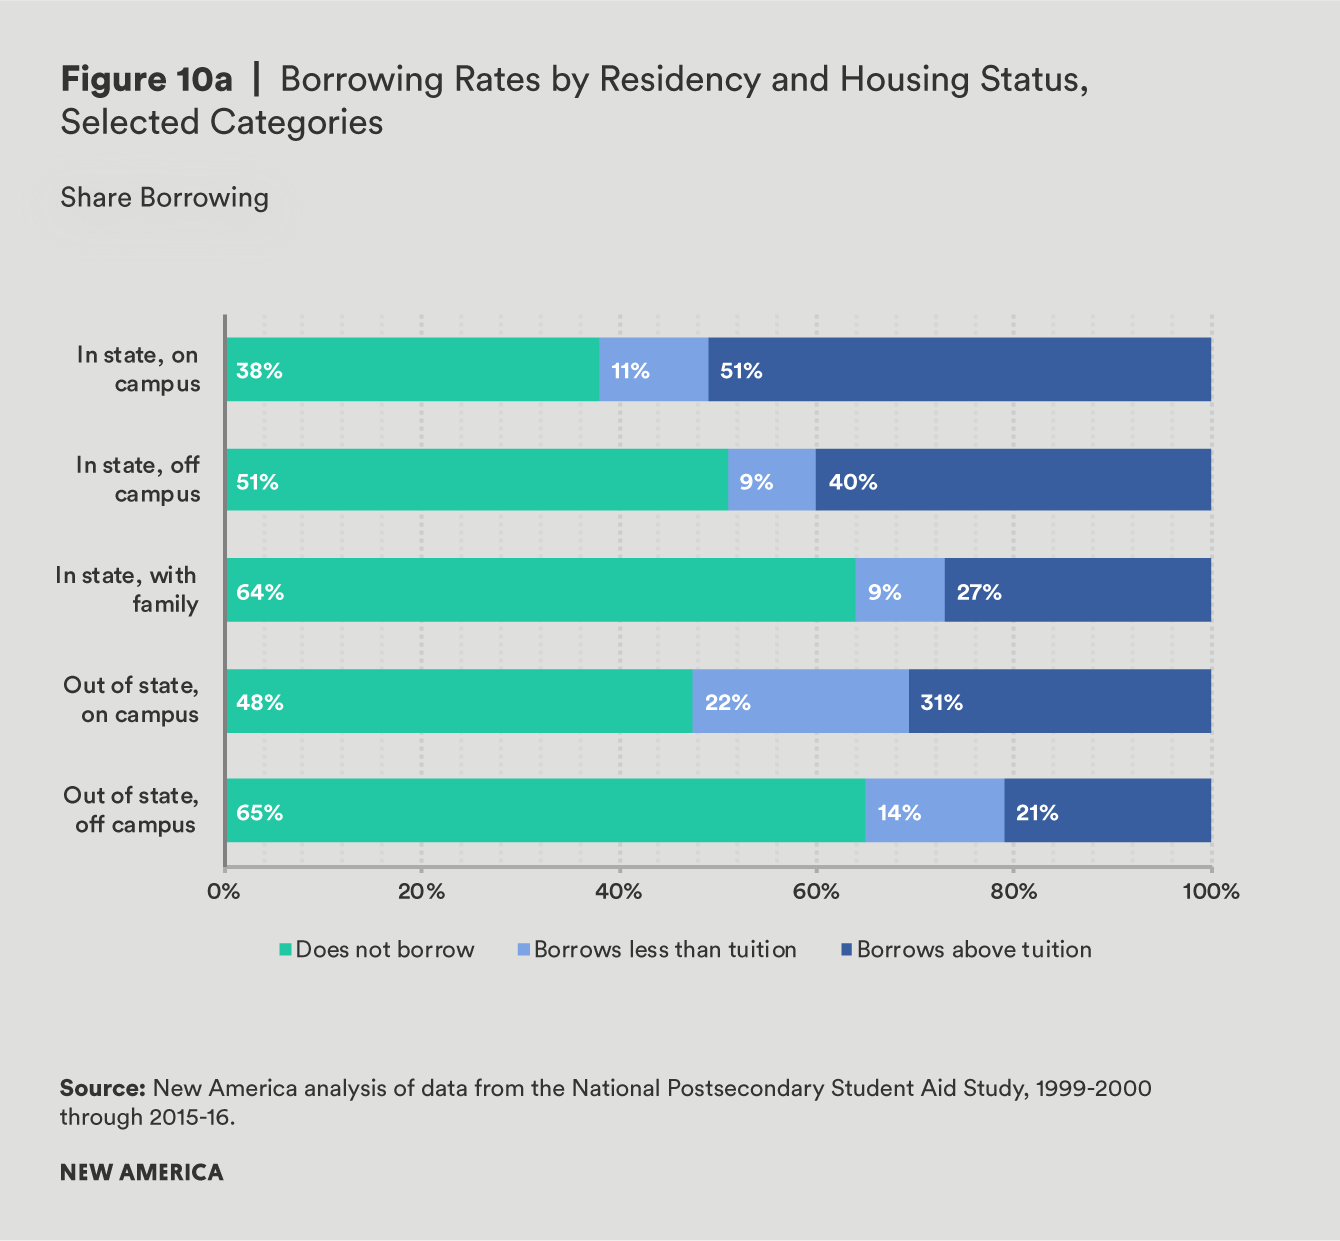
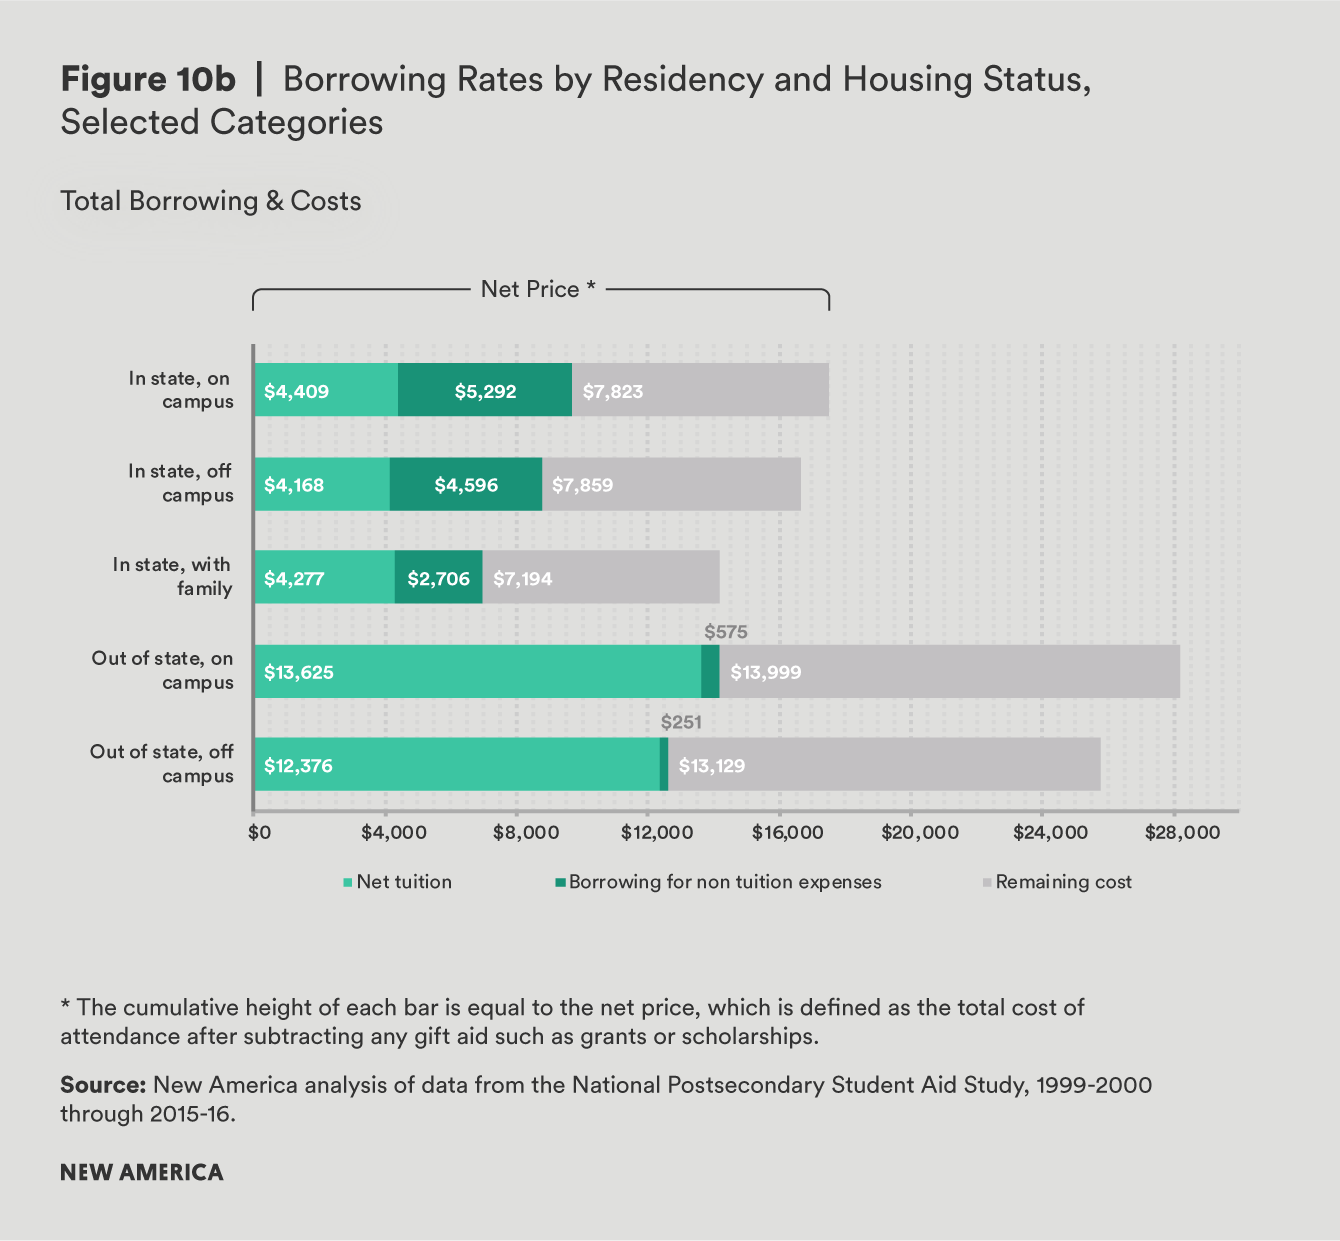
Residency Status and Housing
Where a student lives may also impact his borrowing decisions. At public four-year institutions especially, where students must choose whether to either attend college within or outside their home state and to live on or off campus, the likelihood that a student borrows, and the average amount of debt taken on, can differ dramatically.
While a larger share of those attending public four-year institutions in-state take out student loans relative to their out-of-state peers, the debt loads that out-of-state students assume are far greater than for those attending in-state. Students attending college out of state who live on campus borrow an average of $14,200, which is more than all other groups, and over twice the amount that students borrow if they are living in-state with their families. Regardless of whether they live on or off campus, students attending a public university in-state take on slightly more debt to cover their non-tuition costs than they did to pay for tuition. On the contrary, students attending college out of state borrow very little above the cost of their tuition: nearly all of the amount that out-of-state students borrow covers tuition.
Policy Implications
While the share of those taking on student debt has continued to climb, the data support the notion that much of the growth in borrowing can be traced to changes in tuition pricing, not shifts in student lifestyles. However, exceptions do exist: borrowing for non-tuition expenses is particularly common among low-income borrowers and those who attend low-cost schools—or both. Borrowing for non-tuition expenses also has differential effects across sectors, because enrollment and the share of students who borrow varies considerably.
According to the National Center of Education Statistics, more than 17 million undergraduate students were enrolled in higher education in the fall of 2015 (see table below). Of these, our estimates indicate that about 28 percent took on loans in excess of tuition and fees, which translates to about 4.7 million borrowers (with an additional 1.8 million borrowing less than they pay in tuition and fees). Applying similar calculations across sectors, we conclude that around 2.6 million of those borrowers attended public four-year schools, a little over one million attended private nonprofits, 800,000 attended public two-year schools, and an additional 370,000 attended for-profit institutions.
| Share Borrowing | Share Borrowing More than Tuition | Total Fall Enrollment | Number Borrowing | Number Borrowing More than Tuition | |
|---|---|---|---|---|---|
| Public 4-year | 47% | 37% | 6,926,519 | 3,255,464 | 2,589,453 |
| Private nonprofit | 58% | 38% | 2,822,122 | 1,636,831 | 1,080,503 |
| Private for- profit | 64% | 35% | 1,073,728 | 687,186 | 371,112 |
| Public 2-year | 14% | 13% | 6,224,304 | 871,403 | 801,530 |
| Overall | 38% | 28% | 17,046,673 | 6,477,736 | 4,696,655 |
Source: Borrowing rates from New America analysis of National Postsecondary Student Aid Study, 2015-16; enrollment figures from the National Center for Education Statistics Digest of Education Statistics, Table 303.25.
While a small share of students borrow in excess of their institutional charges, those who do are disproportionately low-income students who attend low-cost schools. But students at community colleges and for-profit institutions have the lowest odds of completing a degree,1 and default rates among these two sectors are nearly double that of four-year public or private nonprofit schools.2 This means that students at these schools who borrow are at heightened risk of taking on more debt than they can repay, regardless of whether or not they apply those loans to their tuition or their non-tuition costs. However, college administrators have much more control over tuition than non-tuition expenses, and many community colleges already charge very low or zero tuition to low-income students. As a result, attention in the debate over reducing risks for these students centers around borrowing for non-tuition expenses.
Even for those students who do borrow for non-tuition costs, many are left with thousands of dollars in educational costs not covered by loans or grants. For instance, the typical student from a family earning less than $22,000 a year borrows $3,800 more than he pays in tuition and fees, yet he has a significant gap in his overall need, with net enrollment costs amounting to $7,000 more than the grants and loans he receives. In these cases, the additional resources available in the form of student loans may help students meet basic needs. Combined, these factors mean that students must decide whether borrowing more could help them complete their degree or would merely saddle them with higher loan payments down the road.
Additionally, policymakers should take steps to to reduce the amount of debt students need to take on, to improve the quality of the education for which they are borrowing, or both. In order to reduce the risks associated with higher education, building a robust accountability system that limits the availability of low-quality degree programs might make it more likely that students who borrow for their living expenses are able to repay their debt, simply by ensuring that they are borrowing for programs with demonstrated economic value. Currently, the cohort default rate (CDR) serves as the main outcome standard directly tied to schools’ access to federal financial aid. While the CDR standard is designed to protect students and taxpayers from the negative consequences of student loan default, the use of a single metric for access to hundreds of billions in federal aid has led to unintended consequences, like funneling students into options that delay default until they safely clear the three-year accountability window or opting out of the loan program altogether. Federal policymakers could improve institutional quality by holding schools to a higher bar for student outcomes; reforming the accreditation process to emphasize the importance of student outcomes; and leveraging and coordinating state actors to set higher standards for colleges and protect borrowers from poorly performing institutions.
However, providing additional need-based grant aid to students for living expenses is the best strategy to simultaneously help students succeed in school and reduce the risks of financing higher education through debt. Rather than pouring resources into proposals to make college tuition free or debt free, a holistic approach to reducing student debt that considers both direct and indirect educational expenses and leverages federal, state, and institutional resources is needed.
Appendix: Borrowing for Living Costs by Institutional Sector and Family Income
Total Loans and Costs
| Income | Sector | Total Borrowing | Net COA | Net Tuition | Borrowing for Non-Tuition Expenses | Remaining Costs |
|---|---|---|---|---|---|---|
| $21,978 to $46,586 | Public 4-year | $8,261.74 | $15,087.84 | $3,016.74 | $5,245.00 | $6,849.60 |
| $46,587 to $79,588 | Public 4-year | $8,973.24 | $17,853.79 | $5,440.84 | $3,532.40 | $8,890.35 |
| $79,589 to $126,268 | Public 4-year | $10,519.48 | $21,042.17 | $8,164.15 | $2,355.33 | $10,525.79 |
| Greater than $126,268 | Public 4-year | $12,483.59 | $25,063.83 | $11,116.14 | $1,367.45 | $12,582.69 |
| Independent Students | Public 4-year | $8,474.59 | $14,805.95 | $3,026.41 | $5,448.18 | $6,331.43 |
| Less than $21,978 | Public 4-year | $7,151.00 | $13,754.80 | $2,109.01 | $5,041.99 | $6,609.79 |
| $21,978 to $46,586 | Public 2-year | $3,455.44 | $8,172.01 | $777.68 | $2,677.76 | $4,716.57 |
| $46,587 to $79,588 | Public 2-year | $4,004.27 | $10,120.81 | $2,282.27 | $1,721.99 | $6,116.54 |
| $79,589 to $126,268 | Public 2-year | $4,345.11 | $10,543.03 | $2,509.95 | $1,835.16 | $6,197.92 |
| Greater than $126,268 | Public 2-year | $4,144.36 | $10,894.06 | $2,766.47 | $1,377.90 | $6,749.70 |
| Independent Students | Public 2-year | $5,270.68 | $9,369.59 | $883.97 | $4,386.72 | $4,098.90 |
| Less than $21,978 | Public 2-year | $3,758.30 | $7,549.29 | $356.76 | $3,401.54 | $3,791.00 |
| $21,978 to $46,586 | Private nonprofit | $10,599.48 | $19,504.36 | $7,726.04 | $2,873.44 | $8,904.88 |
| $46,587 to $79,588 | Private nonprofit | $13,130.38 | $24,026.06 | $10,693.89 | $2,436.49 | $10,895.69 |
| $79,589 to $126,268 | Private nonprofit | $15,943.76 | $28,430.67 | $14,347.83 | $1,595.93 | $12,486.92 |
| Greater than $126,268 | Private nonprofit | $16,471.93 | $35,135.47 | $20,756.57 | -$4,284.64 | $18,663.54 |
| Independent Students | Private nonprofit | $8,935.45 | $17,563.91 | $7,062.76 | $1,872.70 | $8,628.76 |
| Less than $21,978 | Private nonprofit | $10,064.90 | $18,368.09 | $6,610.80 | $3,454.09 | $8,303.20 |
| $21,978 to $46,586 | Private for profit | $9,120.05 | $19,189.30 | $10,557.59 | -$1,437.54 | $10,069.29 |
| $46,587 to $79,588 | Private for profit | $13,070.79 | $23,750.55 | $13,796.91 | -$726.12 | $10,679.76 |
| $79,589 to $126,268 | Private for profit | $12,749.30 | $23,881.41 | $14,478.31 | -$1,729.01 | $11,132.12 |
| Greater than $126,268 | Private for profit | $14,803.80 | $27,306.87 | $17,062.10 | -$2,258.29 | $12,503.07 |
| Independent Students | Private for profit | $8,736.66 | $18,505.24 | $8,640.10 | $96.57 | $9,768.58 |
| Less than $21,978 | Private for profit | $8,995.79 | $18,364.58 | $8,587.51 | $408.27 | $9,368.79 |
| Less than $21,978 | All Sectors | $7,680.31 | $14,775.41 | $3,874.23 | $3,806.08 | $7,098.19 |
| $21,978 to $46,586 | All Sectors | $8,421.05 | $15,875.27 | $4,688.66 | $3,732.39 | $7,467.26 |
| $46,587 to $79,588 | All Sectors | $9,558.66 | $18,669.19 | $6,830.24 | $2,728.42 | $9,115.87 |
| $79,589 to $126,268 | All Sectors | $11,386.25 | $21,989.67 | $9,432.65 | $1,953.60 | $10,605.23 |
| Greater than $126,268 | All Sectors | $13,615.30 | $28,133.42 | $14,409.29 | -$793.99 | $14,519.49 |
| Independent Students | All Sectors | $7,977.48 | $15,422.10 | $5,078.95 | $2,898.53 | $7,444.70 |
Share Borrowing
| Sector | Income | Borrows Less than Tuition | Borrows Above Tuition | Does Not Borrow |
|---|---|---|---|---|
| Public 4-year | Less than $21,978 | 6% | 47% | 47% |
| Public 4-year | $21,978 to $46,586 | 7% | 47% | 47% |
| Public 4-year | $46,587 to $79,588 | 14% | 44% | 42% |
| Public 4-year | $79,589 to $126,268 | 20% | 32% | 48% |
| Public 4-year | Greater than $126,268 | 20% | 24% | 56% |
| Public 4-year | Independent Students | 4% | 37% | 60% |
| Private nonprofit | Less than $21,978 | 16% | 55% | 29% |
| Private nonprofit | $21,978 to $46,586 | 21% | 52% | 27% |
| Private nonprofit | $46,587 to $79,588 | 25% | 47% | 28% |
| Private nonprofit | $79,589 to $126,268 | 25% | 39% | 35% |
| Private nonprofit | Greater than $126,268 | 28% | 21% | 51% |
| Private nonprofit | Independent Students | 14% | 38% | 49% |
| Public 2-year | Less than $21,978 | 0% | 10% | 89% |
| Public 2-year | $21,978 to $46,586 | 1% | 11% | 89% |
| Public 2-year | $46,587 to $79,588 | 3% | 14% | 83% |
| Public 2-year | $79,589 to $126,268 | 3% | 14% | 83% |
| Public 2-year | Greater than $126,268 | 2% | 8% | 89% |
| Public 2-year | Independent Students | 1% | 14% | 86% |
| Private for profit | Less than $21,978 | 27% | 37% | 35% |
| Private for profit | $21,978 to $46,586 | 40% | 29% | 31% |
| Private for profit | $46,587 to $79,588 | 38% | 31% | 30% |
| Private for profit | $79,589 to $126,268 | 34% | 27% | 39% |
| Private for profit | Greater than $126,268 | 32% | 33% | 34% |
| Private for profit | Independent Students | 27% | 35% | 38% |
| All Sectors | Less than $21,978 | 7% | 32% | 61% |
| All Sectors | $21,978 to $46,586 | 8% | 33% | 58% |
| All Sectors | $46,587 to $79,588 | 13% | 33% | 54% |
| All Sectors | $79,589 to $126,268 | 17% | 28% | 55% |
| All Sectors | Greater than $126,268 | 19% | 21% | 60% |
| All Sectors | Independent Students | 7% | 26% | 67% |
More About the Authors

Ben Barrett