Building and Scaling the Foreclosure and Eviction Analysis Tool (FEAT)
Abstract
More than 10 million Americans lose their homes each year due to eviction and mortgage foreclosure. And yet, most local leaders don’t know where within their cities evictions and foreclosures occur, how rates change over the course of the year, or who is most at risk.
When local decision makers can access and analyze eviction and foreclosure (EF) data, they use the insights to keep more people housed. Over the last five years, the Future of Land and Housing program at New America has worked at the federal and local level to help local decision makers access EF data and equip them with the tools to understand it.
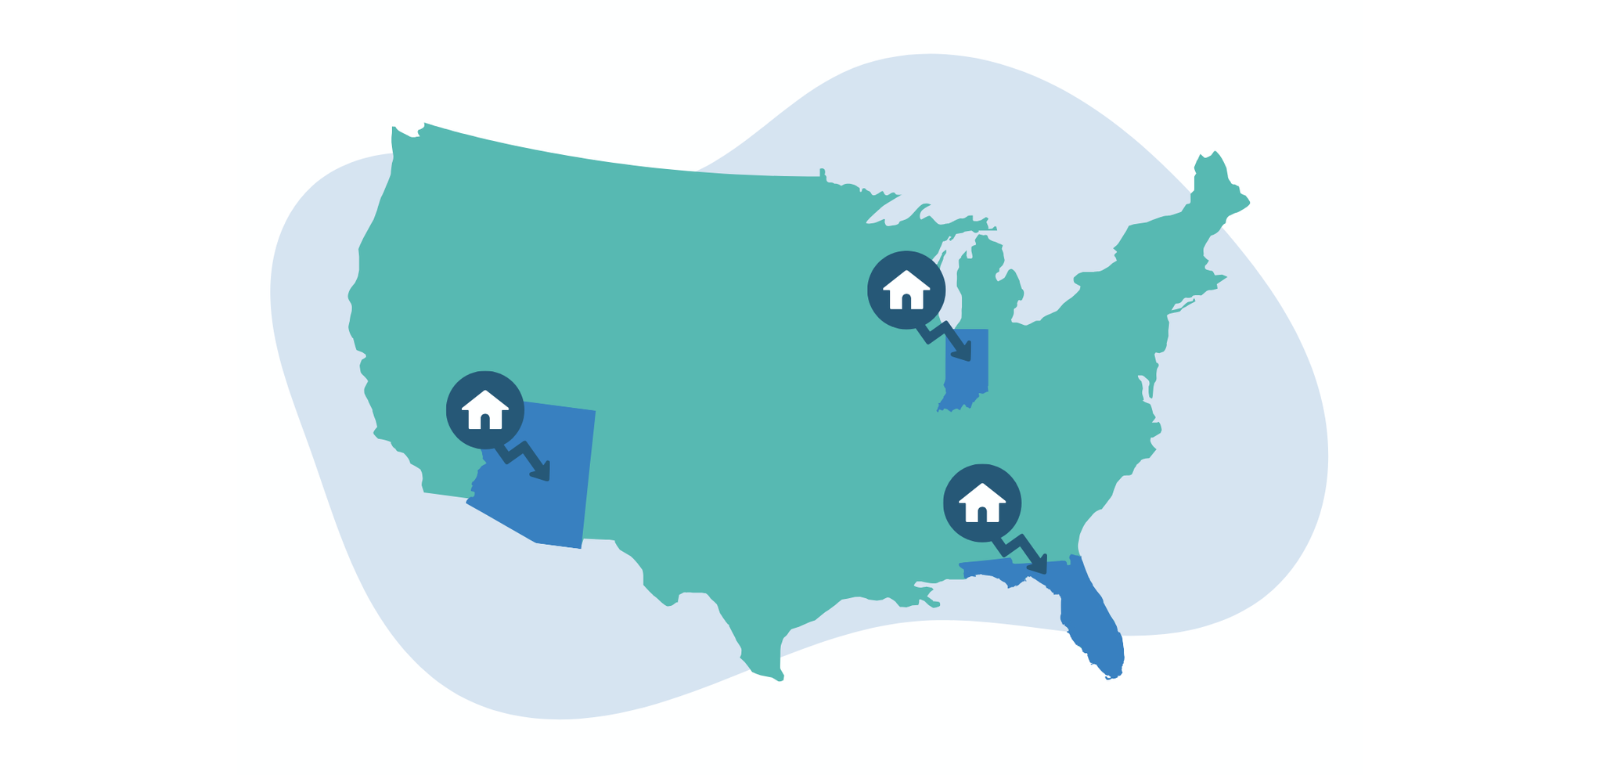
This report details the development of the Foreclosure and Eviction Analysis Tool (FEAT), a first-of-its-kind web application that allows users to understand where housing loss is most acute, when during the year housing loss is occurring, and who is most impacted, as well as the process and lessons learned from partnerships in three states—Arizona, Florida, and Indiana—to leverage FEAT to establish statewide eviction and foreclosure dashboards.
Acknowledgments
Building eviction and foreclosure data infrastructure is a long journey that requires many committed individuals and organizations. For our small role in building this infrastructure nationally and in the cities and states with whom we have been privileged to work, we’d like to acknowledge the following individuals and organizations.
The DataKind team, and in particular Caitlin Augustin, Larry Kilroy, and Jacob Harris, for partnering on the development of the Foreclosure and Eviction Analysis Tool. Thank you also to the Eviction Lab team, and in particular Peter Hepburn, Carl Gershenson, and Juan-Pablo Garnham, for being key partners in building FEAT’s Eviction Tracking System data pipeline.
Each of our state scaling partners, who led the journey of establishing statewide eviction and foreclosure data dashboards in Arizona, Florida, and Indiana. In particular we’d like to acknowledge Patricia Solis and Lora Phillips at Arizona State University’s Knowledge for Exchange Resilience; Shea Lemar, Brajesh Karna, Yueling Li, and Sandeep Sabu at Arizona State University’s Geospatial Research and Solutions Program; Maxine Becker at Wildfire AZ; Anne Ray and Renz Torres at the Shimberg Center for Housing Studies at the University of Florida; and Matt Dietrich, Ally Scott, Jay Colbert, and Marc McAleavey at Indiana University–Purdue University Indianapolis’ Polis Center.
The many organizations and individuals who are a part of the Eviction Data Coalition. These individuals and organizations offered their insights, expertise, and support in too many ways to name over the last three years, and our work in the eviction space would not be possible without them.
And finally, we would like to show our appreciation for New America colleagues Jodi Narde, Kelley Gardner, and Naomi Morduch Toubman, and graphic designer A’lysia Alcorn, for their support in the design, layout, and editing of this guide.
Support for this project was generously provided by the Rockefeller Foundation and Schmidt Futures’ Social Safety Net Product Studio.
Editorial disclosure: The views expressed in this report are solely those of the author(s) and do not reflect the views of New America, its staff, fellows, funders, or board of directors.
Downloads
Introduction: You Can’t Fix What You Don’t Measure
More than 10 million Americans lose their homes each year due to eviction and mortgage foreclosure.1 Evictions and foreclosures lead to homelessness, job loss, adverse mental and physical health impacts, educational attainment gaps for children, and downward economic mobility. They disproportionately impact Black and Latino communities and families with small children.2
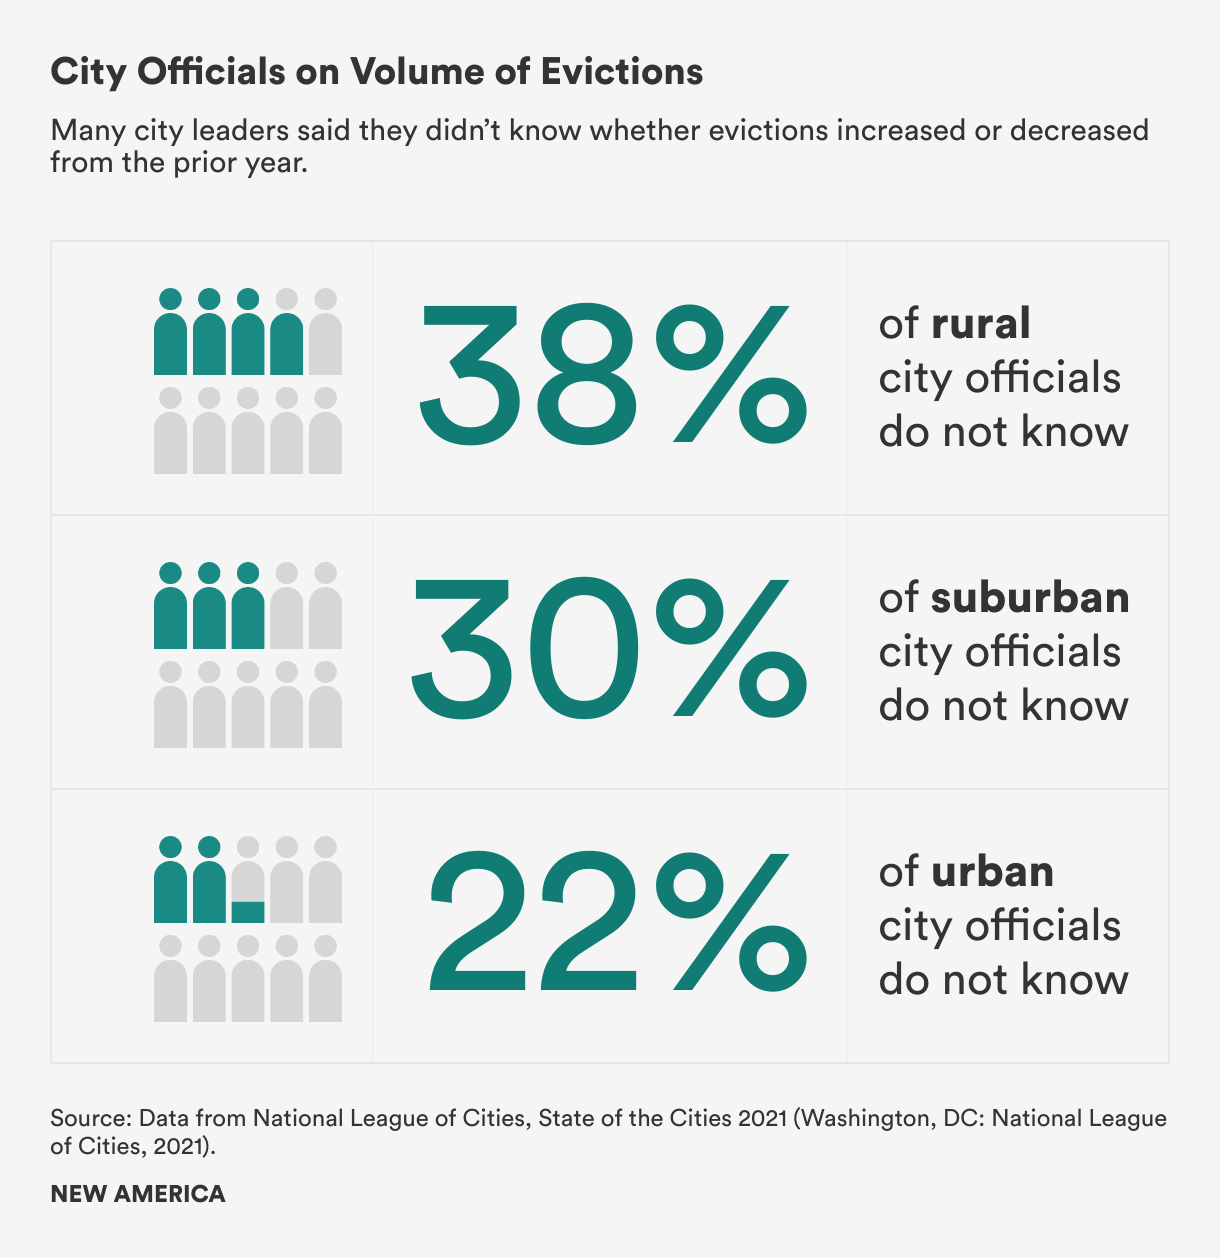
And yet, these devastating events happen in the shadows. The federal government does not collect and share data on evictions or foreclosures. In 2021, a survey from the National League of Cities found that 38 percent of rural officials, 30 percent of suburban officials, and 22 percent of urban officials didn’t know whether evictions had increased or decreased in the prior year,3 let alone where within their cities evictions were most acute, how rates changed over the course of the year, or who was most at risk.
Further, the federal government collects almost no data on evictions, and a New America report found that one-third of U.S. counties do not have access to their topline annual eviction and foreclosure rates.4 The Eviction Lab and the Legal Services Corporation have undertaken substantial work to develop partial eviction databases, and enterprising local researchers and legal aid providers have managed to gather detailed eviction and foreclosure (EF) data in their jurisdictions. Notwithstanding these efforts, we know very little about where evictions and foreclosures are most acute, how rates change over the course of the year, or who is most at risk.
This is an unacceptable state of affairs.
If America is serious about making sure people have a roof over their heads and ending the affordable housing and homelessness crises that voters list as a top concern5 heading into the 2024 election, then we must start tracking the number of people who lose their homes each year. Every governor, mayor, and city council in the United States should have comprehensive and real time information about evictions and foreclosures in their communities, just like they have comprehensive information about crime, education, and jobs.
When local decision makers—including but not limited to elected officials, court staff, legal aid providers, and advocates—can access eviction and foreclosure data, and have the tools to analyze that data, they can use the insights to target programs and policies to keep more people housed. But currently, the subset of local decision makers who can access and use data in this way is small and self-selecting.
Who Are the Local Decision Makers Using Eviction and Foreclosure Data?
Local decision makers use eviction and foreclosure data for program and policy decisions, advocacy, budgeting, research, and direct legal support. These stakeholders include but are not limited to:
- State and local elected officials (e.g., governors, mayors, city councilmembers, county board of commissioners, etc.);
- Court staff;
- Social service agencies;
- Community and faith-based service providers;
- Legal aid providers;
- Researchers;
- Journalists; and
- Tenant organizers and other advocates.
Over the last five years, the Future of Land and Housing program at New America has worked at the federal and local level to help local decision makers access EF data and equip them with the tools to understand it. This has included policy and advocacy efforts to develop a national EF data infrastructure, as well as hands-on work with local partners to build their capacity to access and understand this data.
This report provides a brief overview of these efforts to date, starting with the development and rollout of the Foreclosure and Eviction Analysis Tool (FEAT), a first-of-its-kind web application that allows users to understand where housing loss is most acute, when during the year housing loss is occurring, and who is most impacted. This report also focuses on partnerships in three states—Arizona, Florida, and Indiana—to collect statewide EF data and use FEAT to establish public dashboards displaying useful insights.
Citations
- Yuliya Panfil, “America Needs A National Housing Loss Rate,” Social Innovation (blog), Federation of American Scientists, February 22, 2024, source.
- Julia Craven, “Eviction Is One Of The Biggest Health Risks Facing Black Children,” New America, December 7, 2024, source.
- Christiana K. McFarland, Brooks Rainwater, Erica Grabowski, Joshua Pine, and Anita Yadavalli, State of the Cities 2021 (Washington, DC: National League of Cities: 2021), source.
- Tim Robustelli, Yuliya Panfil, Katie Oran, Chenab Navalkha, and Emily Yelverton, Displaced in America: Mapping Housing Loss Across the United States (Washington, DC: New America, 2020), source.
- Leigh Ann Caldwell, “Skyrocketing rents and home prices may be pivotal in the 2024 election,” Washington Post, May 28, 2024, source.
Closing the Eviction and Foreclosure Data Gap
“‘What do we expect the data from our court systems to do?’ Is it to keep a very basic record of the things that transpire in their walls, or is it to [provide] critical information sharing that helps us solve problems in our public and private systems?”—Participant in the New America Spring 2023 eviction data focus groups
The eviction and foreclosure (EF) data knowledge gap stems in large part from the fact that EF data—which is primarily generated by local courts—is difficult to access and use. Courts typically do not process, store, and share this data in ways that make it useful for tracking evictions or that will provide actionable information for preventing evictions.1
Further, without a state or federal level mandate and few incentives (and associated funding) to collect and share EF data, local leaders lack the resources to systematically collect and analyze this data and use insights to drive down evictions and foreclosures. The variation in data access and quality—combined with the lack of a mandate—means that many municipalities across the United States do not have the data infrastructure in place to use data-driven insights from EF data in an ongoing and meaningful way.
When decision makers have reliable and current data on who loses their homes and why, they can more effectively target resources, pass policies to address specific vulnerabilities, and align housing investments with the scale of the housing assistance need. But building effective EF data infrastructure takes time and resources, and there is currently neither a federal mandate nor much funding for local leaders to undertake this effort. For this reason, it’s critical to simultaneously work at the federal level to make long-term investments in EF data, while also working locally, where possible, to equip municipal leaders with this data right now.2
Federal Action
Federal action—in the form of funding, programs, and policies—is critical to building a robust EF data infrastructure. New America has produced several reports and resources that identify the most salient deficiencies in data infrastructures and recommendations for improving them.3 Much of this work has been through an Eviction Data Coalition that New America stewards, comprised of more than 50 local and national housing leaders, technologists, policymakers, legal experts, court clerks, and public information officers.
In 2021, the Eviction Data Coalition released eight recommendations for creating national and local eviction data systems, which the U.S. Department of Housing and Urban Development (HUD) adopted in its report to Congress on the feasibility of a national eviction database.4
Three Years Later: Progress on Eviction Data Recommendations
Since the release of eight recommendations for creating national and local eviction data systems, New America and the Eviction Data Coalition have produced several resources to move the needle towards a more robust data infrastructure. To date, this has included:
- Court Eviction Data Standards to help generate high-quality court data. These data standards provide guidance to courts on which eviction-related information should be collected to allow for actionable analysis and tracking of evictions.
- Analytic tools and resources to help build local capacity for high-quality data analysis, including the Foreclosure and Eviction Analysis Tool and Understanding Evictions: A Guide to Using Local Court Data, which outlines 14 common questions that can be asked and addressed using court eviction data.
- Policy recommendations for federal government action to provide the funding and technical assistance needed to unlock access to court eviction data and build local capacity to use it. These recommendations build off insights from focus groups with users of local court eviction data.
Local Action
Improving national EF data infrastructure is a long-term effort with potentially transformative impact. All the while, Americans continue to face evictions and foreclosures at alarming rates, and local leaders need access to whatever data is available right now to intervene and keep families housed.
Working locally over the last five years, New America has collaborated with over two dozen cities and counties and three states to build their capacity to access and analyze eviction and foreclosure data. These insights have led to direct action on the ground.
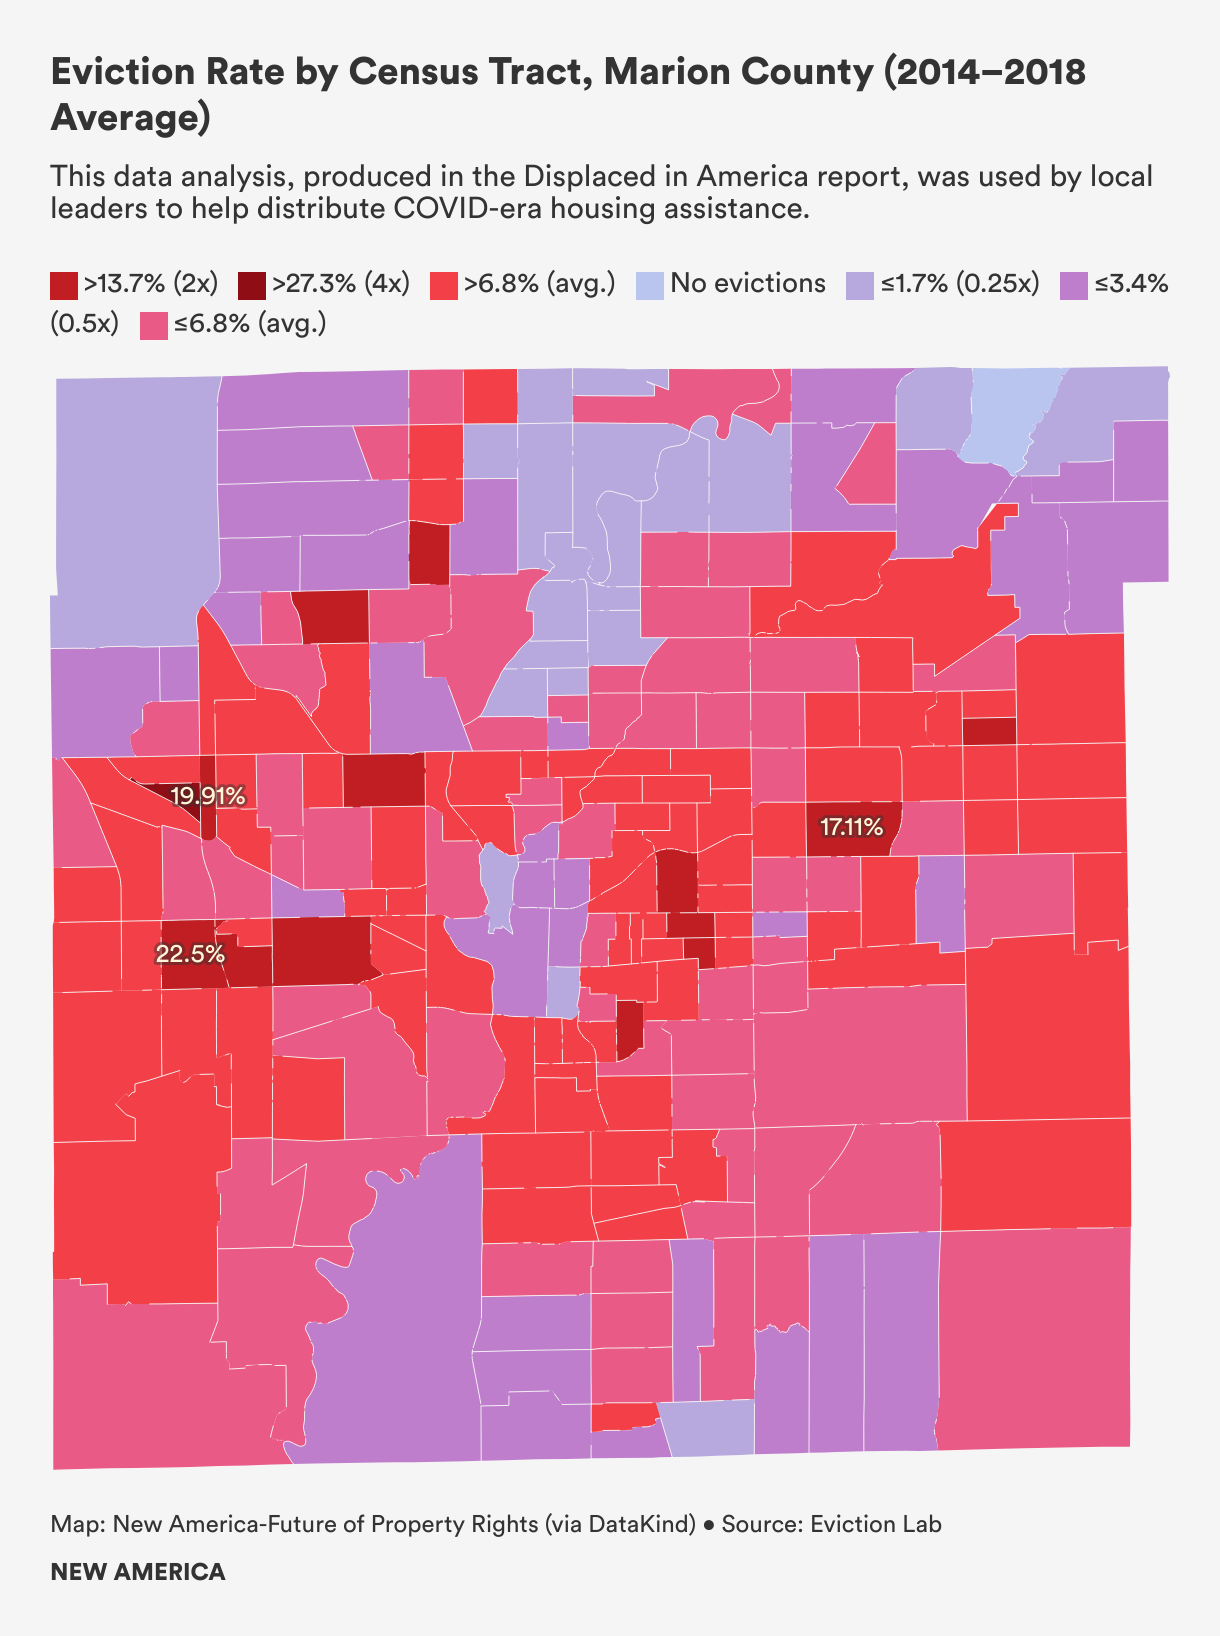
At the outset of the COVID-19 pandemic in March 2020, for example, the Deputy Mayor of Indianapolis had to distribute $15 million of Coronavirus Aid, Relief, and Economic Security (CARES) Act funding across the city to keep people stably housed. Using census-tract level heat maps of evictions and foreclosures from the five years prior to the pandemic (2014–2018), city leaders were able to see which neighborhoods had historically been hardest hit by housing loss as a way to determine how to allocate this federal housing aid.
In Tempe, Arizona, the City Council used our findings that non-citizens were being evicted at higher rates to propose standing up a Spanish language legal aid clinic. And in Winston-Salem, North Carolina, our findings about racial disparities in housing loss gave advocates the data to back what they were already seeing in their communities, forcing conversations about discriminatory housing practices.
Watching local leaders strategically use eviction data in real-time to inform important housing decisions motivated the development of the Foreclosure and Eviction Analysis Tool (FEAT) and its piloting to unlock statewide analysis of EF data in Arizona, Florida, and Indiana. The remainder of this report details the development and piloting of FEAT and critical lessons learned from municipalities’ use of the tool to scale this analysis statewide.
Citations
- Sabiha Zainulbhai, “What Can Court Data Actually Tell Us About Evictions?” New America, April 20, 2023, source.
- New America’s policy work around improving housing loss data has to date focused on evictions, however the majority of the actions discussed here are equally applicable to foreclosure data.
- Yuliya Panfil, Sabiha Zainulbhai, and Tim Robustelli, Why is Eviction Data so Bad?Recommendations for Improving the Local and National Landscape (Washington, DC: New America, 2021), source.
- Office of Policy Development and Research, Report to Congress on the Feasibility of Creating a National Evictions Database (Washington, DC: U.S. Department of Housing and Urban Development, 2021), source.
Building the Foreclosure and Eviction Analysis Tool
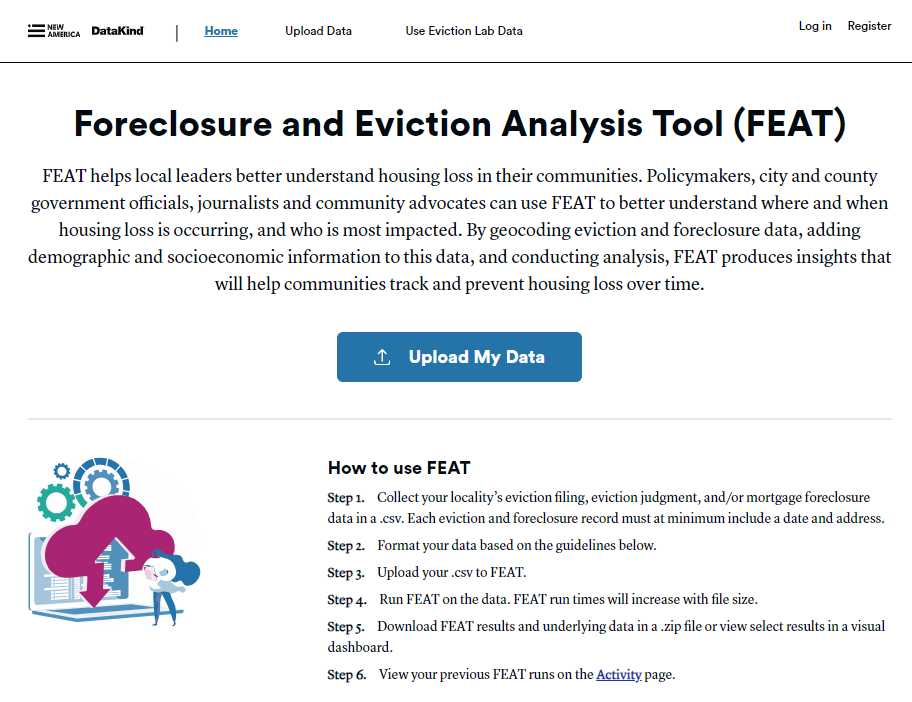
The Foreclosure and Eviction Analysis Tool (FEAT) is an easy-to-use web application that ingests local eviction and foreclosure data and analyzes it to help local housing leaders understand where housing loss is most acute, when during the year housing loss is occurring, and who is most impacted.
Over the course of three years, New America, in partnership with data science organization DataKind and 14 cities and counties, built FEAT in stages. Starting with the development of a beta version of FEAT stored in a GitHub repository in 2021, the FEAT web application (www.featapp.org) was released in 2023.
To date, multiple city and county leaders, researchers, and community-based organizations have used FEAT to access housing loss data for the first time and to generate insights about evictions and foreclosures that helped them provide targeted rent assistance, stand up legal aid clinics, and otherwise develop data-driven interventions to improve local housing security.1
In 2021, New America’s Future of Land and Housing program and DataKind developed a beta version of FEAT, which was housed in a Github repository and could be downloaded and run on local court-generated eviction or foreclosure data using the programming language Python.
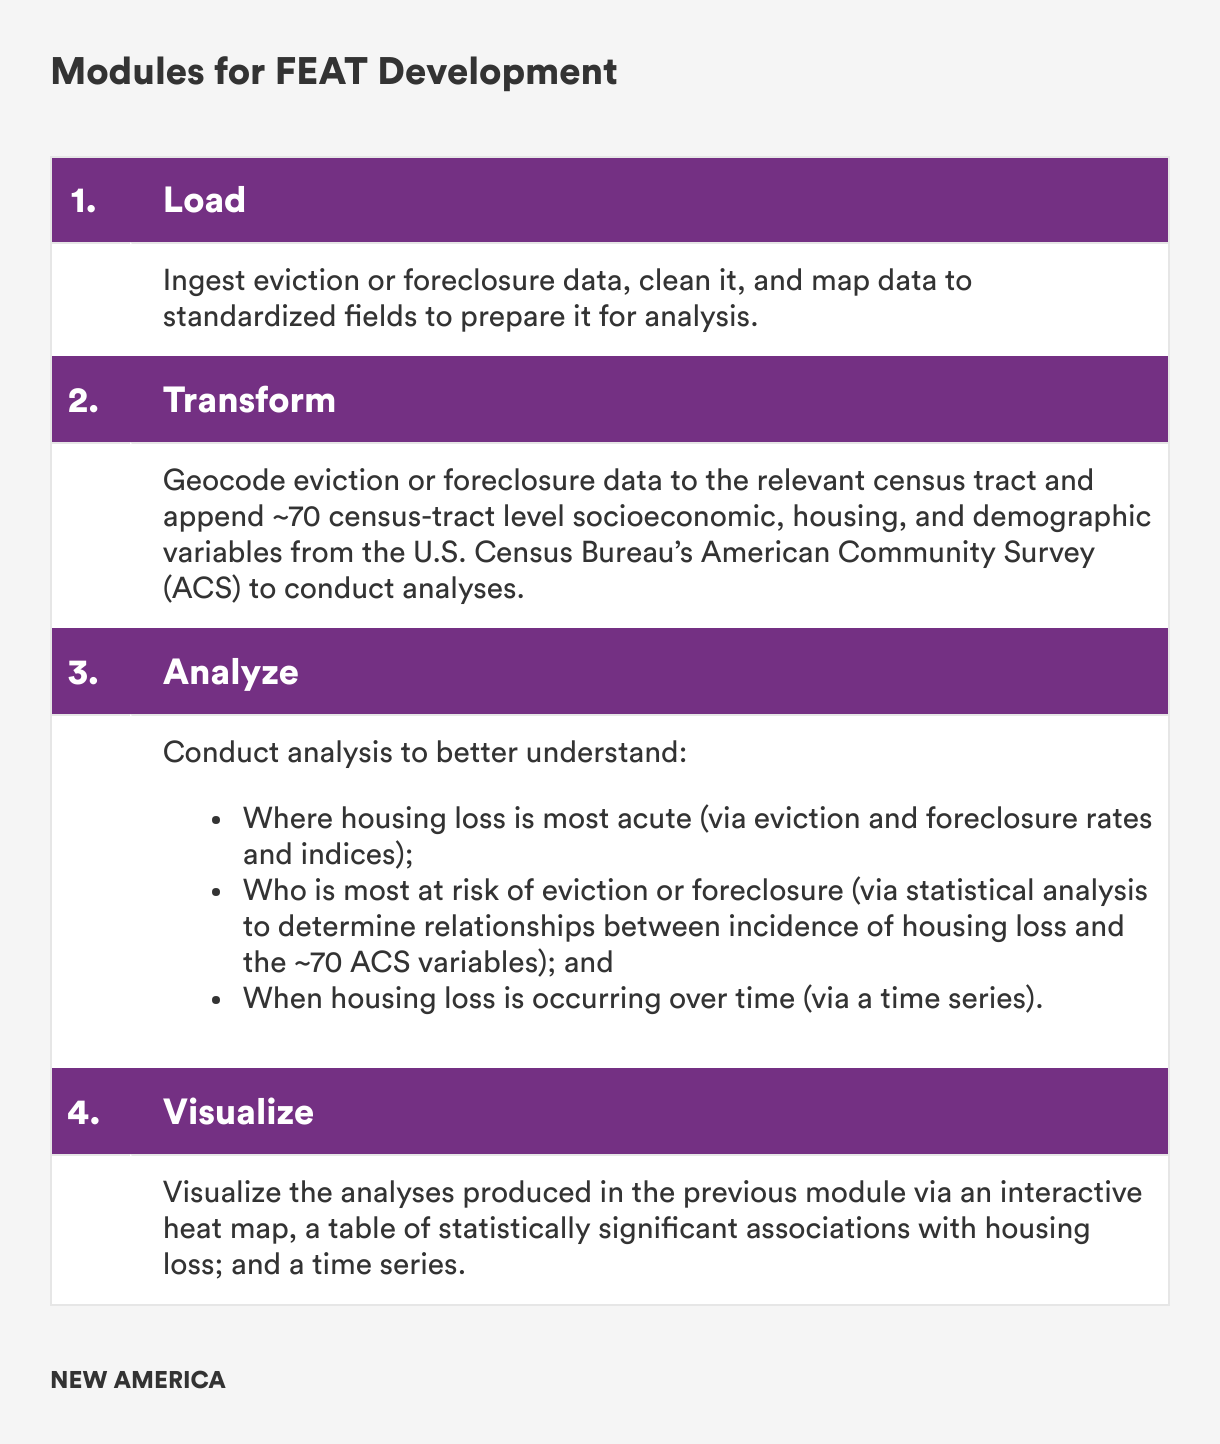
The tool was composed of four modules, shown below, each covering an important function in the data processing and analysis pipeline: “Load,” “Transform,” “Analyze,” and “Visualize.”
Partnering with Local Housing Leaders
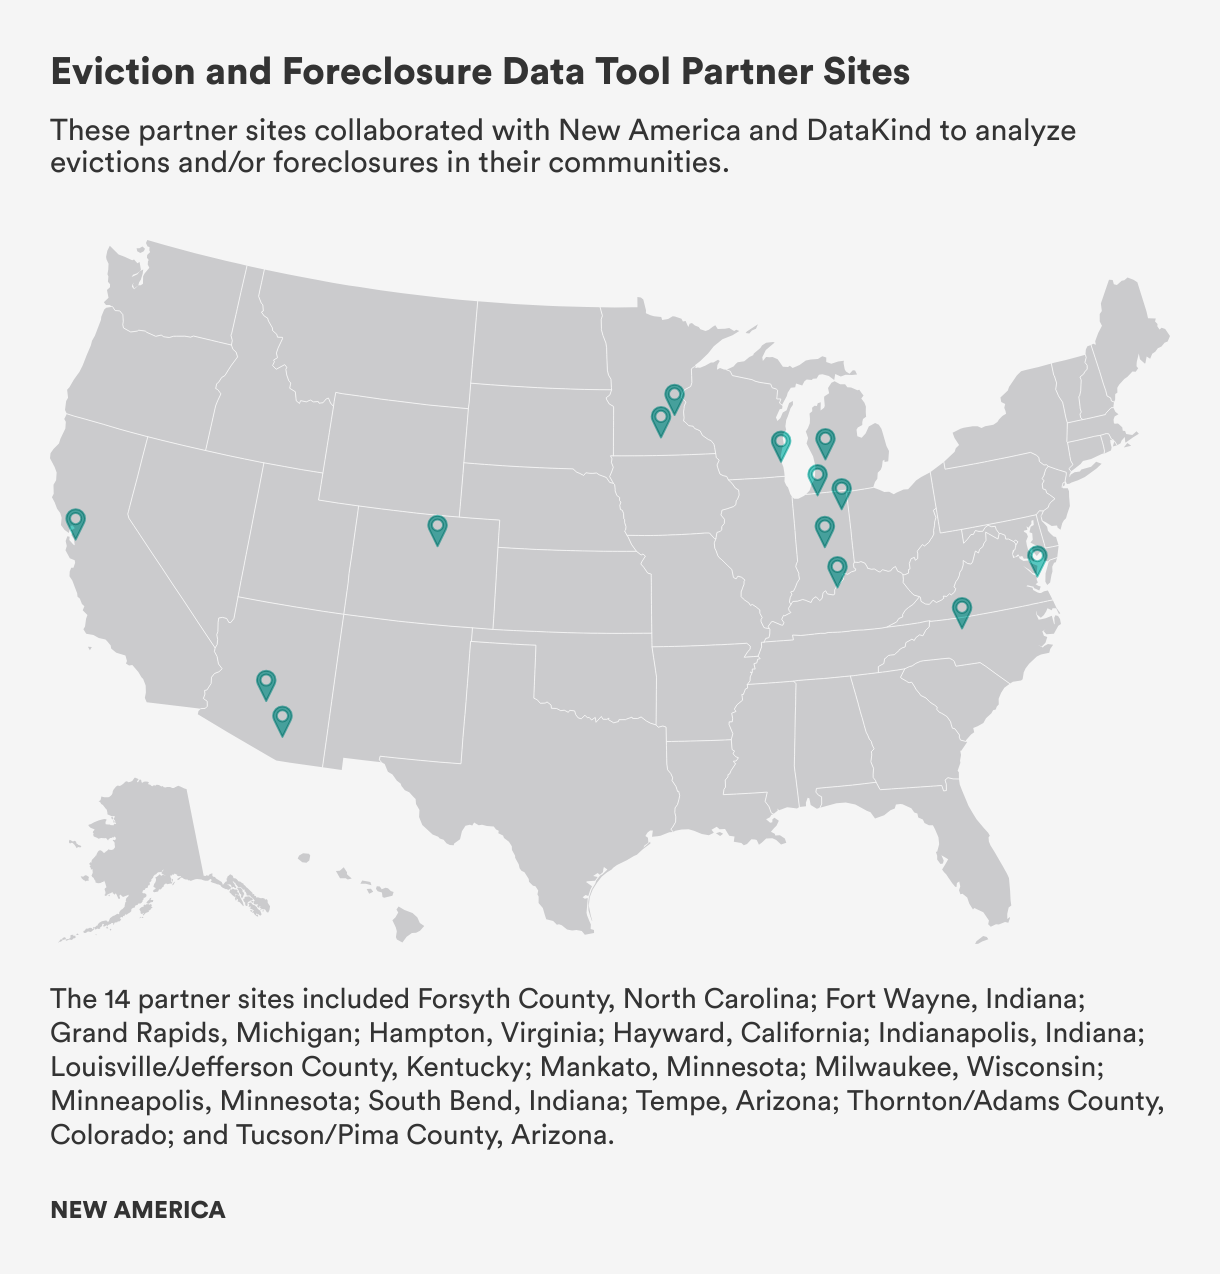
To ensure FEAT’s development was informed by the needs and data capacities of local housing communities, we partnered with 14 cities and counties, or “partner sites,” across the United States. Partner sites helped test FEAT and provided feedback at various stages of development.
To test the tool, partner sites needed to access their local eviction and foreclosure (EF) data. For those that did not have access, we provided guidance on potential places to source this data2 and offered guidance on pathways and strategies for access. For some partner sites, participating in the FEAT build provided a catalyst to put in place the partnerships needed to unlock data in the first place.
Case Example: City of Hayward, California
Due to strict record sealing laws in California, the City of Hayward did not have an agreement in place to receive eviction data from the Alameda County Court. After partnering on the development of FEAT, city housing leaders established a relationship with court staff with whom we discussed the data needs of the city and how the county court could help fulfill those needs, while adhering to privacy laws. These conversations unlocked access to eviction data dating back to 2000 in the city of Hayward, allowing housing leaders to better understand if local interventions are helping to prevent housing instability and displacement of residents.
Beta Launch and Web Application
The beta version of FEAT launched in the spring of 2022. Despite the utility of FEAT analysis, a tool stored in a GitHub repository posed a barrier to entry for many FEAT users. Many users, often staff of legal aid organizations and city housing and planning departments, did not have the time or expertise to navigate the software and technical components of FEAT Beta. Many who did possess the technical skills—those in government geographic information systems (GIS) and information technology (IT) departments—often did not have the housing expertise to interpret the data and contextualize the analysis FEAT produced.
In response, we developed a web application for FEAT, dubbed “FEAT 1.0.” The web app contains similar analytic functionalities to FEAT Beta but with an easy-to-use interface that a wide range of local housing stakeholders can use to understand and track evictions and foreclosures in their community. It is accompanied by a comprehensive step-by-step user guide.
While developing the FEAT web app, we made two substantial enhancements to the FEAT Beta design, based on user testing with different audiences.
- We built a pipeline from Eviction Lab’s Eviction Tracking System into FEAT. This means that for users who are unable to access local court eviction data, FEAT 1.0 provides analysis on existing eviction filing data for the 10 full states and 34 cities contained in Eviction Lab’s Eviction Tracking System.
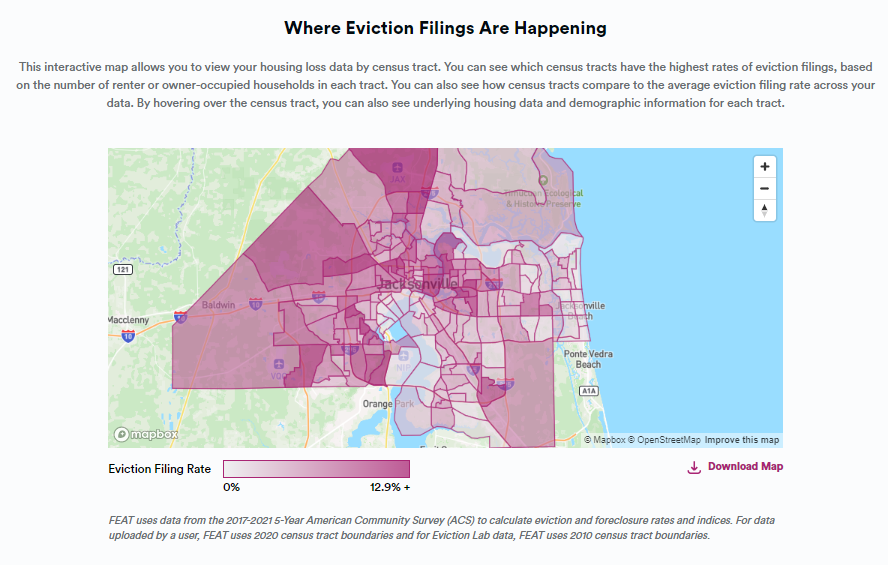
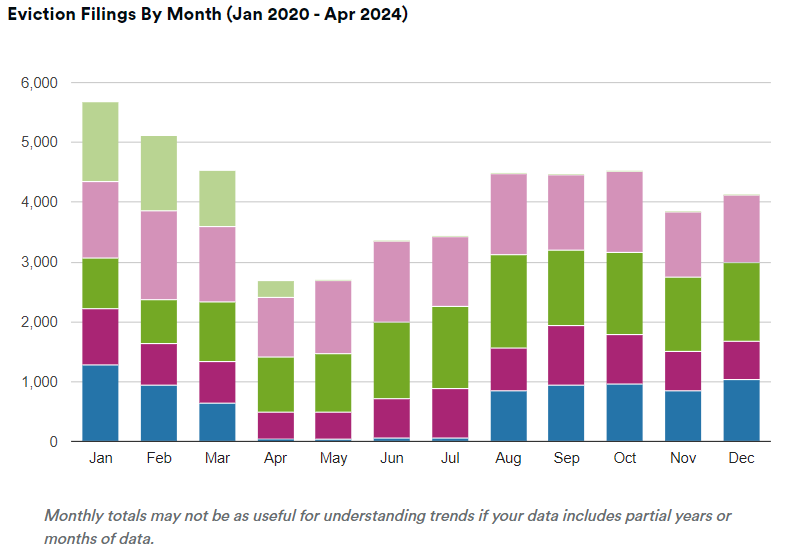
- Whereas FEAT Beta produced files that a user could then plug into GIS or other software to create visualizations, FEAT 1.0 includes built-in visualizations: a census tract-level eviction and foreclosure heat map; a chart of statistically significant demographic correlates of housing loss; and a time series.
Since its release in December 2023, the FEAT web app has been used by journalists, researchers, policymakers, and service providers in at least 21 states across the U.S.
Using FEAT to Build Statewide Dashboards in Arizona, Florida, and Indiana
A tool is only as good as its uptake, and the only way to ensure a tool like the Foreclosure and Eviction Analysis Tool (FEAT) serves local communities is to drive its adoption and ownership by local leaders. For this reason, in parallel to developing FEAT, we partnered with high-capacity organizations with statewide reach in Arizona, Florida, and Indiana to use FEAT to create statewide eviction and foreclosure (EF) data dashboards. Our goal was to provide these partners with tools and technical support to access EF data statewide, use FEAT to build dashboards responsive to the needs of local housing communities, and engage with these communities to use the insights to inform housing policy, advocacy, and programming decisions.1
Each state scaling partner made significant progress in advancing efforts to collect and analyze EF data statewide within the 12-month partnership. In December of 2023 our partner in Indiana, the Polis Center at Indiana University–Purdue, released its dashboard, making Indiana the first state in the country to have full and publicly available data on evictions and foreclosures. Our Arizona partner, the Knowledge Exchange for Resilience (KER) at Arizona State University (ASU), released the Arizona statewide dashboard in May 2024. Our Florida partner, the Shimberg Center for Housing Studies at the University of Florida, plans to release its statewide dashboard in the coming months.
In each state, partners followed a similar roadmap, starting with gathering the data needs of local housing communities and culminating in unveiling statewide EF dashboards. Because each state partner operated in a different data, legal, and housing context, their strategies differed accordingly. The differing contexts that each partner operated in allowed us to better understand the range of challenges and facilitators for sourcing EF data, creating dashboards, and working with communities to use the dashboard insights to develop data-driven policies and programs that reduce housing instability.
FEAT State-Scaling Roadmap
Step 1: Partner Selection
Step 2: User-Centered Design with Local Housing Communities
Step 3: Unlocking Access to Statewide Data
Step 4: Analyzing the Data Using FEAT
Step 5: Building Data Dashboards
Step 6: Dashboard Rollout and Impact
Step 1: Partner Selection
New America believed an organization charged with building a statewide EF data dashboard should possess the following qualities.
- The necessary mix of skills: Ideally, an organization would have housing, information technology (IT), and data visualization capacity on-staff. If not, the organization would be able to source these capacities.
- Strong networks statewide: Expressed through relationships with county and state leaders, courts, housing communities, and other stakeholders crucial to developing and then using an EF data dashboard.
- Flexibility and autonomy: To take on and execute projects like a statewide EF data dashboard.
- Legitimacy: A respected partner with a track record in the community is critical for driving acceptance, trust, and uptake of an EF data dashboard.
- Sustainability: A partner must have long-term capacity and funding to sustain both the dashboards and the data pipelines that feed them.
In each state, based on the above criteria, we partnered with a research center within a large, public university to collect, develop, and steward a publicly accessible, statewide EF dashboard—we refer to these programs throughout as “state-scaling partners” or “state partners.”2
- Arizona: Arizona State University’s Knowledge for Exchange Resilience (KER) and Geospatial Research and Solutions Program (GRS); and Wildfire AZ (“Wildfire”)
- Florida: DataKind engaged the Shimberg Center for Housing Studies at the University of Florida (“Shimberg”)
- Indiana: Indiana University–Purdue University Indianapolis’ Polis Center (“Polis Center”)
While each state partner differed in their focus and expertise (e.g., Arizona State University’s KER focuses on resilience and GRS focuses on geospatial analysis; the Shimberg Center focuses on housing; and the Polis Center focuses on data for good), they all share a belief that stable housing advances well-being and that better local data is foundational to improving local policy. Further, each state-scaling partner had a multidisciplinary team with a mix of geospatial and data skills; statewide reach and credibility for providing reliable data analysis on pressing problems; and the human resources and financial capacity to undertake this effort.
With the Polis Center in Indiana and ASU and Wildfire AZ in Arizona, New America provided modest sub-grants to undertake this effort; in Florida, the Shimberg Center worked closely with DataKind to use FEAT to produce Florida-specific housing loss dashboards.
Step 2: User-Centered Design with Local Housing Communities
Across all three states, scaling partners began by convening community sessions with the intended users of the dashboards. This included local government leaders (at the city, county, and, sometimes, state level); court entities; community-based service providers; journalists; legal aid organizations; and researchers.
In these sessions, state partners inquired about the most pressing EF prevention needs, how participants anticipated using the data dashboards, what types of information they would find most useful, and the way in which they would like it presented. In each state, this feedback formed the basis for dashboard development.
Step 3: Unlocking Access to Statewide Data
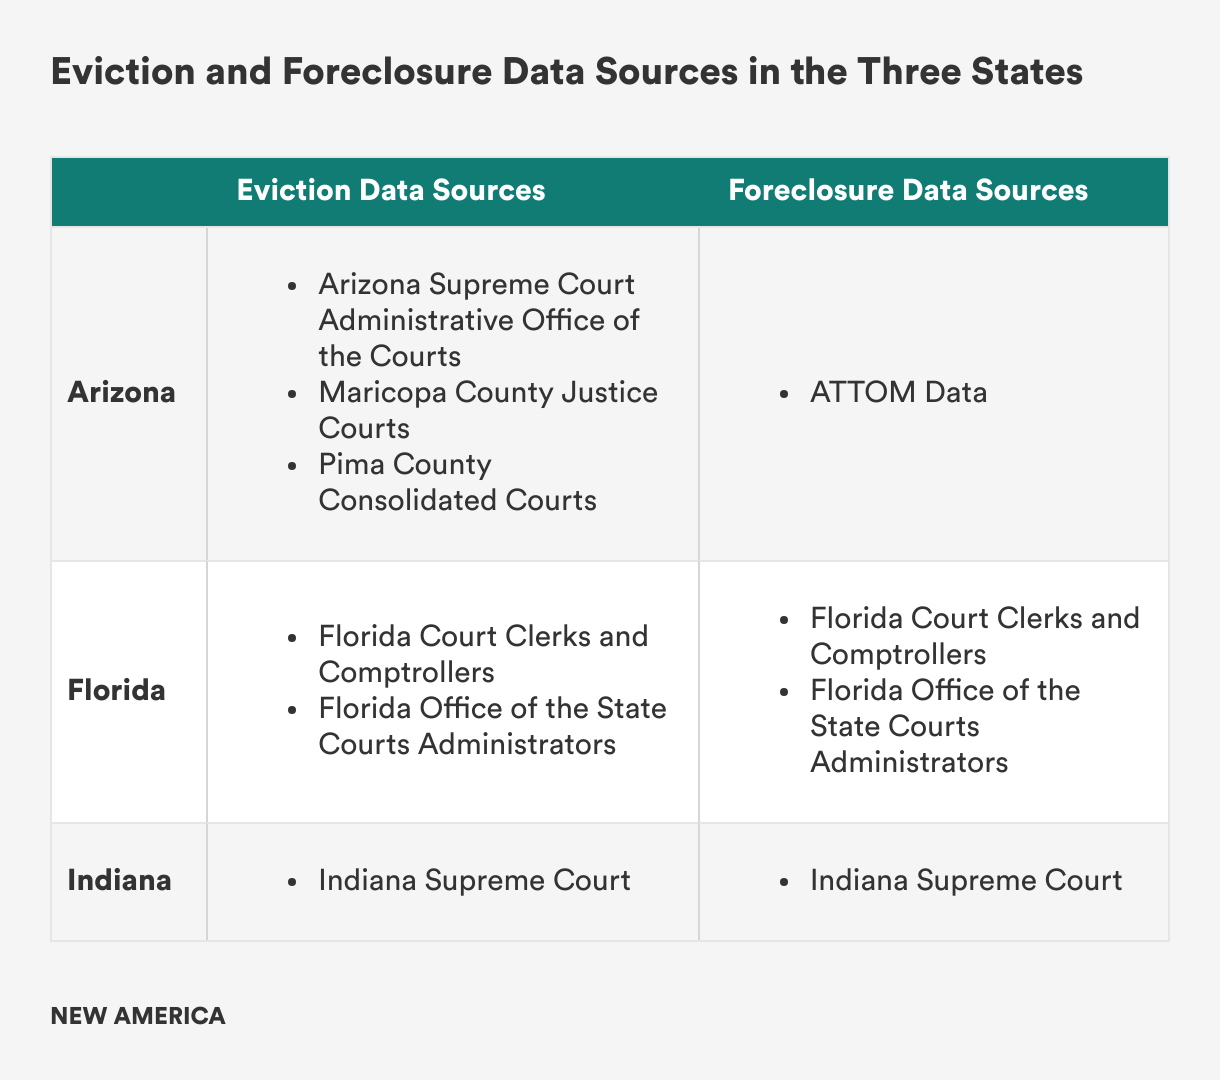
The primary source of data on evictions and foreclosures—local court records—varies widely in its quality and availability. Each state partner operated in a different EF data landscape, requiring different strategies for its collection. The table below shows the data sources for EF data in each state.
Arizona: Victories and Setbacks
In Arizona, the road to accessing EF data was less straightforward, in part due to the lack of a unified court system. The Arizona Supreme Court Administrative Office of the Courts (AOC) oversees data collection for 13 out of Arizona’s 15 counties, while Maricopa and Pima Counties—the two largest counties—each maintain their own processes and case management systems. Neither the AOC nor Pima County had a practice of making eviction data publicly available, with the exception of county-level eviction filing figures maintained by the Arizona Supreme Court. Maricopa County, despite previously sharing address-level eviction data once a month with a list of stakeholders, had halted this practice after the passage of Arizona’s eviction record sealing legislation in 2022.
Over the next 12 months, New America, ASU, and Wildfire AZ worked persistently to unlock data access across the state. After a meeting in early summer of 2023, in which New America and ASU shared the goal of the state-scaling effort, the AOC agreed to enter into a data-sharing agreement with full access to eviction data across the 13 counties covered by the AOC.
While a data-sharing agreement was reached, the process highlighted the lack of standardized procedures for data provision, relying heavily on individual relationships to broker the arrangement. With no processes in place about whether to provide this data, the decision rested on the unilateral decision of court executives.
In Maricopa County we worked for many months with a close court partner to find a data access arrangement that was compliant with Arizona’s eviction record sealing legislation. That legislation, enacted in 2022, mandates that all dismissed eviction cases be sealed. Prior to this law, the Maricopa Justice Courts (MJC) kept Maricopa housing researchers and advocates well-informed about the local state of evictions, via a monthly mailing. After the law was passed, and without clear implementation guidance, court staff erred on the side of releasing limited and less granular data on a delayed basis.
Over the course of several months and multiple conversations, we worked with MJC on a solution that met our requirements for data access while complying with their eviction record sealing law: MJC would share topline counts of all eviction filings with ASU, but would only share address-level data for unsealed eviction judgments after the cases were settled.
In the remaining county, Pima County, the Pima County Consolidated Justice Court agreed to provide data, but entering into a data-sharing agreement took many months. When ASU received the data they realized they could only query the prior two weeks of filings, rather than the full historical record agreed. ASU and Pima County Court administrators worked for another two months to resolve this hiccup. Foreclosure data access was not offered by any of the parties, and as a workaround we facilitated a purchase of foreclosure data from the company ATTOM Data.
Florida: Building on Existing Data Framework
In Florida, Shimberg came into the partnership with statewide access to EF data. The Shimberg Center’s Florida Housing Data Clearinghouse obtains its data from two sources: the Florida Court Clerks and Comptrollers (FCCC) network and the Florida Office of the State Courts Administrator (OSCA). The FCCC network is a membership organization of court clerks from all 67 Florida counties.
The organization collects address level EF data from each county and provides it to the Shimberg Center on a quarterly basis through a data-sharing agreement. While the data is provided for free, the process is not automated, and it often takes significant time to collect data from all 67 counties.
Separately, OSCA provides Shimberg with monthly EF counts from each Florida county, once per year. Shimberg uses OSCA figures as a quality control check on the more detailed data provided by the FCCC network.
Indiana: A Streamlined Data Scenario
In Indiana, the Polis Center successfully collected EF data from all 92 counties across the state by entering into a data-sharing agreement with the Indiana Supreme Court. When it comes to data access, Indiana’s unified court system allowed for efficiency, simplifying the process and enabling the Polis Center to submit one bulk data request to the Supreme Court for statewide data.
Another major facilitator was a change in the way that Indiana courts code eviction cases in their system, instituted in 2021, that allows court staff to more easily respond to requests related to eviction court records. Still, it took four months from the time the request was submitted to the time the Polis Center received the first tranche of data.
Step 4: Analyzing the Data Using FEAT
Even once the necessary data is obtained, working to clean, standardize, and address discrepancies in the data so it is ready for analysis can present a whole new set of challenges.
Arizona
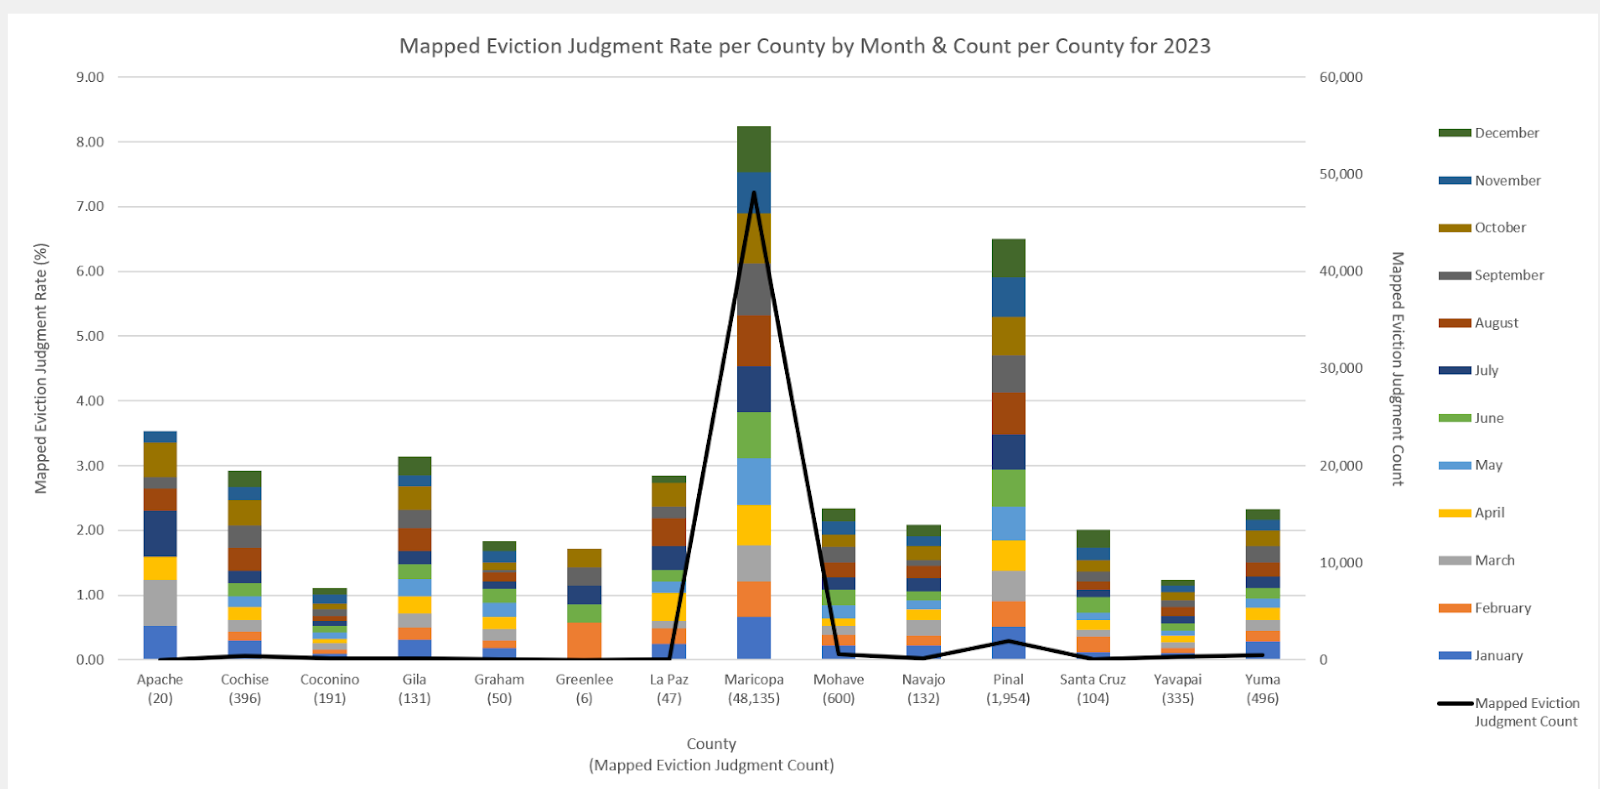
The bulk eviction data obtained from the Arizona Supreme Court required significant back and forth with staff at the AOC to understand which cases represented evictions (as opposed to other civil cases). The eviction data from MJC was limited to eviction cases and shared with a detailed data dictionary, however one-third of the cases had been dismissed and were therefore sealed. Thus, ASU possessed the raw case counts for the full set of eviction filings and eviction judgments, but only the address information to map two-thirds of these cases. To adapt to this data limitation and ensure it was clearly communicated to users, ASU’s geospatial analysts decided to define and use “mapped eviction judgments” as their unit of measure for the Arizona heat maps. The Arizona dashboard contains extensive text to explain the difference between an eviction filing, an eviction judgment, and a “mapped” eviction judgment.
Given the complexities of the foreclosure process, the ATTOM data purchased by ASU similarly required back and forth to understand how to combine data fields to accurately represent a completed foreclosure.
Florida
The Shimberg Center has entered into a partnership with Eviction Lab, whereby the university shares its Florida-wide data for use in the Eviction Tracking System, and Eviction Lab geocodes it, processes it, and shares the clean data back with the Shimberg Center. While Shimberg’s FEAT dashboard is under construction, the center uses this data on an ad hoc basis to share insights with researchers, advocates, and policymakers.
Separately, the Shimberg Center has a data-sharing agreement with DataKind and New America, whereby Shimberg shares its raw data with DataKind for processing. DataKind is in the process of building a Florida-wide EF dashboard using this data.
Indiana
The data obtained from the Indiana Supreme Court had been compiled from court systems across Indiana, and had been cleaned and validated. Still, working with the data required an in-depth knowledge of legal terms and processes across jurisdictions—to understand how each court handles and categorizes the data and to further standardize the data for analysis. This was especially true for classifying eviction judgments across jurisdictions. Despite the streamlined data collection process, the Polis Center worked closely with staff at the Indiana Supreme Court over the course of several months to refine and clean the dataset and figure out how to interpret it.
Step 5. Building Statewide Data Dashboards
Arizona
Determining how to display data from different data sources, each of which covers different time periods and has different limitations, in a way that is easily understandable was challenging. But the ASU team’s geospatial and data expertise allowed them to develop a dashboard that visualizes eviction judgments and mortgage foreclosures across different administrative boundaries including counties, census tracts, and legislative boundaries.
The dashboard also contains “Evictions 101” and “Foreclosures 101” tabs to explain the terminology and legal processes behind these two forms of displacement. In early feedback, dashboard users found these tabs helpful in contextualizing and grounding the rest of the dashboard analysis.
Florida
DataKind is in the process of developing a statewide dashboard that the Shimberg Center will integrate into its website in the coming months.
Indiana
With a team of data analysts comfortable working with large datasets and data visualization skills, the Polis Center team was well-suited to stand up a dashboard building off FEAT analysis using ArcGIS. In addition to census-tract analysis that shows where eviction filings, eviction judgments, and mortgage foreclosures are most acute across Indiana, the dashboard incorporates information about eviction record sealing rates, case processing times, rental index priority indices, and other inputs identified during the user sessions. Feedback from local housing communities also led the team to include resident stories to show the everyday impacts of evictions on Hoosiers across the state.
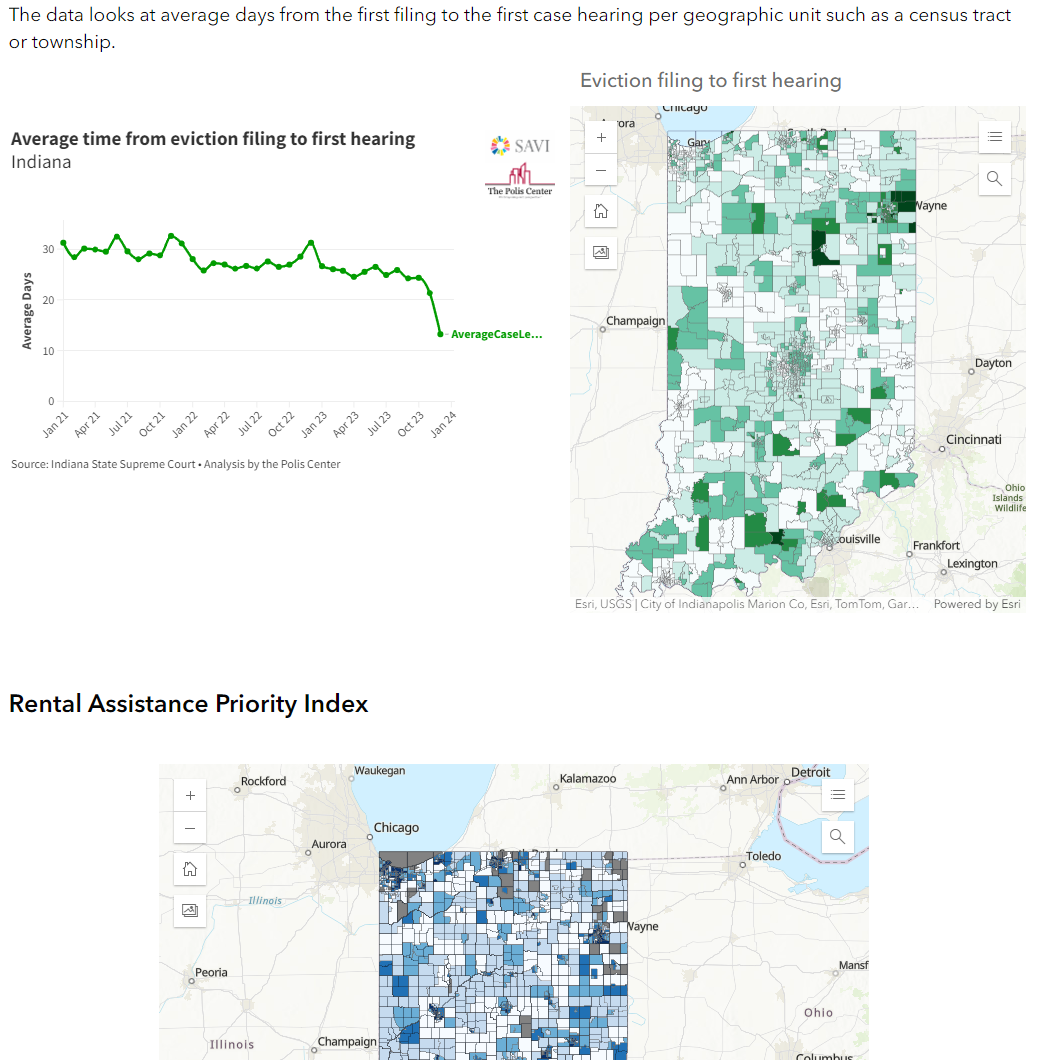
This marked the first time that statewide eviction and foreclosure data would be made publicly available statewide in Indiana.
Step 6. Dashboard Rollout and Impact
We are just beginning to see the ways in which the data our partners have made available in Arizona, Florida, and Indiana is driving change on the ground. Gleaning and disseminating insights from EF data analysis is a large undertaking that is distinct from building a dashboard. Because of resource limitations, we have not been able to support our state-scaling partners to undertake this phase of the work, and so each has pushed it forward as their own resources have allowed.
Arizona
ASU released the Arizona statewide dashboard in May 2024. Its statewide reach, and focus on census-tract level insights, provides a level of transparency and comparison that can be used by existing housing coalitions to support continued advocacy and education related to evictions and foreclosures, as well as existing policies and programs such as Pima County’s robust Emergency Eviction Legal Services program.
Since the dashboards release, Arizona journalists have begun to use it to inform their reporting. The dashboard creators have been invited to present the dashboard to local and statewide audiences, including the Tucson/Pima County Eviction Prevention Collaboration and the Phoenix Community Alliance.
Florida
Despite not having a public FEAT dashboard to display yet, the Shimberg Center has been accessing EF data since at least 2020 and has already seen the impact of this data, some of it processed using FEAT Beta. Shimberg receives two to three requests per quarter from researchers, lawyers, and community advocates who use EF data for various purposes, from studying correlations between natural disasters and evictions to targeting emergency rental assistance funding distribution and legal support.
In Central Florida, an Eviction and Foreclosure Working Group convened by Bright Community Trust has consistently used FEAT-processed data from the Shimberg Center to understand housing loss and allocate rental assistance. State Representative Anna Eskimani has publicly commented on the use of FEAT outputs to target emergency rental assistance in the program’s final days.
Looking ahead, the Shimberg Center is particularly interested in the use of its foreclosure dashboard, as Center staff predict that foreclosures may rise again in the state as a result of high home prices, natural disasters, and other climate impacts.
Indiana
In the first month after its December 2023 launch, the Polis Center dashboard was viewed more than 5,000 times. The dashboard is already being used by legal aid organizations, advocates, journalists, and continuum of care providers across the state. Indianapolis’ largest public hospital is using the dashboard to track evictions as a social determinant of health for its patient population, and one of Indiana’s largest housing developers, Glick Properties, is using the dashboard to understand eviction hotspots in its investment portfolio.
Citations
- We chose to scale at the state level for two reasons. First, we found the state level provides the right balance of efficiency and localization and statewide reach. Second, we believe the benefits of a robust data infrastructure should extend to all cities and counties within a state, and not only those with existing technical capacity, human resources, and political will to build dashboards.
- In Arizona, we brought in a secondary partner, housing organization Wildfire AZ, to supplement the mapping expertise of our scaling partner, Arizona State University’s Knowledge Exchange for Resilience.
Lessons Learned from FEAT State-Scaling Efforts
From staffing and budgeting to disseminating insights based on housing loss analysis, the following lessons learned are intended to shed light on the process of scaling the Foreclosure and Eviction Analysis Tool (FEAT) and provide tips for jurisdictions interested in replicating these efforts.
Staffing and Budgeting
Data Efforts Must Be Adequately Supported with Financial and Human Resources
The collection and use of eviction and foreclosure (EF) data requires significant staff capacity in the form of time, financial resources, and labor. Absent a mandate, funding is the most powerful tool for cementing data use as a priority. Whether these efforts are undertaken to the degree required, and on a regular and systematized basis, often hinges on whether there is adequate funding and staffing provided for these efforts.
Creating Eviction and Foreclosure Data Dashboards Requires Multidisciplinary Teams
The quality and complexity of EF data requires both housing expertise and data proficiency. Undertaking meaningful analysis of this data will require a multidisciplinary team with a range of skills, including data management, geospatial analysis, information technology (IT), and data visualization, as well as deep knowledge of the legal processes around eviction and foreclosure. Assessing the skill sets on the team—whether those are in-house or through partnerships (e.g., with local legal aid providers)—and filling any gaps in expertise is essential.
If Data Pipelines Are Not in Place, Accessing the Data Can Cause Significant Delays
Even under the best circumstances, requesting and obtaining court data is a lengthy process. That is because in most jurisdictions—at least the ones New America has worked with—access to this data involves several steps (typically the submission of a bulk data request followed by entry into a data-sharing agreement with the court) that are not bound by delineated timelines. Processes that in theory could take a matter of weeks typically stretch to several months. A data collection effort must assume roadblocks and significant delays and have ample staff capacity to engage consistently and persistently to overcome them.
Understanding User Needs
Gather the Insights of Target Dashboard Users, Early and Often
Gathering insights from the range of potential users is a critical first step in developing the dashboard. While there will be similarities in the types of information dashboard users are most interested in (e.g., the location of eviction hot spots), other needs vary according to local pressures, policies, and even geographic features.
Hosting community sessions and running a user-centered dashboard design process that involves the range of potential users will help prioritize data analysis that meets the needs of local communities and integrate design elements that ensure dashboards are presenting insights in the most useful way.
Be Aware That User Needs Will Not Align Perfectly with Data Access and Quality
User needs will not align perfectly with what is feasible, given the limitations around data access and quality. For example, some users may be interested in insights that require obtaining data beyond what can be accessed from courts, such as the prevalence of out of state landlords among top evictors or whether eviction and foreclosure hotspots are coinciding with flood zones and other climate vulnerable parts of their community. It is still important to start with blue sky suggestions as these can be prioritized for future consideration.
Data Access
Understand That Courts Often Lack the Capacity and Incentives to Provide Public Court Data
The reason it is so difficult to obtain eviction data is that it’s time consuming and tedious for court staff to provide it, and there’s often no mandate, nor much of an incentive, for courts to share data with non-court users. Even when a court has a process for bulk data requests, court staff are typically provided little time and resources to fulfill these requests. In courts without rules on the books around provision of data it is in fact not a part of a court’s job. For these reasons, providing data in the particular format or on the particular timeline that the public needs to conduct meaningful analysis often falls to the bottom of the long list of a court staff’s tasks. Understanding this dynamic is critical to working within the system to align incentives and access the necessary data. Here are some strategies that have worked well.
- Find and partner with the local data guardian: In jurisdictions where there are not clear data-sharing processes, find the individual who is either formally appointed to manage data-sharing or who has informally taken this role upon themselves. Advocating for your data needs with the right individual is key in both formal and informal data-sharing arrangements with court systems.
- Be clear about the benefits of data transparency for courts: Courts nationwide are under pressure to cut caseloads and processing times. For that reason, it’s helpful to make the case that improved data access can help decrease evictions and foreclosures, and therefore decrease caseloads.
Align Incentives for State and Municipal Leaders to Unlock Court Data Access
City, county, and state officials can be powerful allies in unlocking access to court EF data. In addition to believing that better data will help decrease evictions and foreclosures, many municipal staff can make the case to their colleagues and superiors if EF data efforts are tied to other major initiatives or incentives.
- Appeal to innovation: Local government staff are motivated by the recognition of being innovators and leaders. For this reason, we have found it effective to tie data-sharing efforts to larger themes of “transparency” and “innovation” and to existing learning cohorts like the National League of Cities’ and Stanford Legal Design Lab’s Eviction Prevention Learning Lab.
- Appeal to inter-municipal competitiveness: Municipalities within a state are often in competition with one another, and a municipality is often motivated by being the “first” to adopt an innovation. For this reason, once a municipality within a state has agreed to share data, it is sometimes effective to share this precedent with other municipalities.
Municipalities Can Work Together to Open Data Doors
There’s no need to reinvent the wheel when it comes to data requests, structure, and format. Once a single municipality in a state has developed a process for requesting and sharing data, often through a data-sharing agreement, that process can be replicated in other municipalities. This also applies to the data fields and specifications within the data request; in fact, for purposes of standardization it is optimal for all municipalities to provide data in the same format.
Data Analysis and Dashboard Design
Even “Clean” Data Will Require Significant Effort to Prepare for Analysis
Given the quality and complexity of eviction and foreclosure data, working with this data will require a multidisciplinary team with a range of data skills and housing expertise.
Raw data feeds from county clerks’ offices are often provided in pipe-delimited formats that contain different variable names than what data analysis tools like FEAT are set up to ingest. A team working with these files must have both IT skills and housing knowledge to correctly convert data from courts to a format that FEAT and other tools can read. It is helpful to have a counterpart at the court who is knowledgeable about and responsive to questions about how the data is generated, how it should be interpreted, and any limitations in its quality or comprehensiveness.
Pairing Data Analysis with Local Eviction and Foreclosure Expertise Is Essential
The complexity and variation in eviction and foreclosure legal processes across the United States, in combination with often poor-quality data, presents an opportunity for data inaccuracies and misinterpretation. Experts with deep knowledge of the relevant legal processes and housing policies and programs must participate in the EF data analysis process.
For example: Mortgage foreclosures involve multiple court filings over a many month period, and the process varies by state. It is essential to have a granular understanding of the local mortgage foreclosure process to pull out the correct court filing for inclusion into FEAT.
Simple Is Best
Remember that a dashboard containing multiple datasets and filters can become difficult to understand, and, therefore, be less useful. For most dashboard and data analysis, simplicity is best.
Dashboard Rollout and Use
Developing a Dashboard Is 95 Percent of the Work, but the Utility Is in the Last 5 Percent: Converting Analysis into Insights
It is incredible how much work goes into being able to say that “Neighborhood x has the highest foreclosure rate in the city” or “Evictions are highest in month y.” Equally incredible: Many dashboard developers do all the work necessary to surface these insights but stop short of actually publishing them in plain text on the dashboard interface. Users must be able to easily find these insights without having to do a lot of additional investigation or digging. Therefore, regardless of how “user friendly” a dashboard is, it is essential that in addition to the data analysis and visualizations, a dashboard contains a set of “key takeaways” based on needs identified by users during the dashboard design process.
Invest in Communicating Insights: Just Because a Dashboard Is Released Does Not Mean It’ll Be Used
Dashboards must be continuously socialized, updated with new data, and adjusted in response to policy and legal changes and user feedback. In an ideal case, dashboard development should plan and budget for at least two more years of funding post-release.
Plan to spend significant time communicating about the existence and functionalities of a dashboard to local housing communities who can benefit from its use, even if users were consulted in the lead-up to dashboard development.
A suggested dashboard socialization process includes: a public release event; a mass email distribution; briefings and embargoed viewings for local housing reporters; individual briefings and demos for key users from government agencies, legal aid organizations, service providers, and advocacy groups; and written collateral on your website to accompany the dashboard itself.
Plan on (and budget for) repeating this process each time the dashboard is updated with new data.
Conclusion
Over the last five years, New America and a host of other organizations have worked persistently to move the needle towards helping local leaders access and analyze eviction and foreclosure data, and to use those insights for better housing policy and programs.
To undertake this work at scale requires significant investment and support from a range of government and non-government actors. This includes:
- Providing funding and technical assistance for municipalities to invest in the resources needed to overcome barriers in data collection and use;
- Building capacity of local leaders to analyze housing loss data and use it for decision-making, including through the Foreclosure and Eviction Analysis Tool;
- Developing and maintaining nationwide initiatives (e.g., coalitions, learning labs, fellowships, and networks) that convene jurisdictions and provide expert guidance, technical support, and opportunities for peer learning related to housing loss data and analysis and prevention and policy;
- Investing in advocacy for policies and programs that facilitate better eviction and housing loss data, including the implementation of data standards and standardized court forms; and
- Supporting narrative change around the importance of tracking housing loss, using real stories and case studies to demonstrate what is possible when data is publicly available.
A robust data infrastructure that provides meaningful and actionable insights on who is losing their housing and where would have innumerable short- and long-term benefits. One that cannot be underestimated is the future visioning that this would allow for, where creating housing policies and programs is based on need instead of scarcity, and on ensuring security instead of alleviating precarity.
More About the Authors

Yuliya Panfil
Senior Fellow and Director, Future of Land and Housing

Sabiha Zainulbhai
Deputy Director, Domestic Housing