The Cost of Connectivity 2020
Abstract
In our most extensive Cost of Connectivity report to date, we find further evidence that consumers in the United States pay more on average for monthly internet service than consumers abroad—especially for higher speed tiers. This year’s report examines 760 plans in 28 cities across Asia, Europe, and North America, with an emphasis on the United States. Our latest research on internet affordability is especially timely as millions of people have moved to online classrooms, telework, and telehealth during the ongoing COVID-19 pandemic. Access to the internet is far from equal, and the digital divide disproportionately affects Black, Indigenous, and people of color (BIPOC) communities and low-income households. We’ve long known that cost is one of the biggest barriers to internet adoption, and it is likely to become an even bigger barrier as jobs and incomes are lost during the COVID-19 pandemic.
This report begins with an overview of our research methodology. We then present our findings in three parts: First, we examine the total cost of connectivity, network technologies, monthly prices, advertised speeds, and broadband affordability across international markets. Second, we examine the litany of ancillary fees and hidden costs that consumers must navigate to determine the total price of internet service. Third, we examine municipal networks, affordability, and the lack of pricing transparency in the U.S. market. Finally, we present U.S. policy recommendations that build upon our study’s implications and conclude with key takeaways.
Acknowledgments
This report would not have been possible without the help of a talented and resourceful team. The authors would like to thank Austin Adams, Lisa Johnson, Sarah Morris, Amir Nasr, and Joshua Stager for their thoughtful edits and valuable input on research design; Lukas Pietrzak for enthusiastic research support; Naomi Morduch Toubman for patient guidance and support in designing the data visualization; Katherine Garrison, Coral Negrón, and Zhaoying (Joy) He for preliminary data analysis; and Maria Elkin, Samantha Webster, and Joe Wilkes for creative communications support.
Executive Summary
In this year’s Cost of Connectivity report, we find further evidence that people can expect to pay more for internet service in the United States than in Asia or Europe. Our previous studies—published in 2012, 2013, and 2014—consistently showed that U.S. consumers paid higher costs for slower speeds than consumers abroad. Some of these trends continue in the 2020 report. Our research has additional urgency this year, as many people rely on the internet to navigate new realities presented by the COVID-19 pandemic. This year’s report is also our most extensive to date, examining 760 plans in 28 cities across Asia, Europe, and North America, with an emphasis on the United States. In our dataset, 296 plans are located in the United States and 462 plans abroad.
Across North America, Europe, and Asia, we find the highest average monthly prices in the United States. This trend is consistent across different network technologies: cable, DSL, and fiber. Fiber plans are the most expensive option in all three markets, with the United States being the most expensive. Cable and DSL plans are less expensive, but still higher in the United States than in Europe. We find the fastest advertised speeds in Asia. Asia also leads on value, as measured by standardizing the relationship between cost and advertised download speed. Europe leads on affordability, as measured by monthly prices at minimum broadband tiers.
We find substantial evidence of an affordability crisis in the United States. Based on our dataset, the most affordable average monthly prices are in Asian and European cities. Just three U.S. cities rank in the top half of cities when sorted by average monthly costs. The most affordable U.S. city—Ammon, Idaho—ranks seventh. The overwhelming majority of the U.S. cities in our dataset rank in the bottom half for average monthly costs. Internet policy scholar Jonathan Sallet recommends that $10 per month is an affordable benchmark for low-income households. Only six plans in our U.S. dataset meet this $10 benchmark at any speed tier (only four meet Sallet’s 50/50 Mbps recommendation), and all six are offered in Ammon. Out of 290 plans in our U.S. dataset, 118 have advertised initial promotional prices of $50 and under—and only 64 of these plans advertise speeds that meet the current FCC minimum definition for broadband. In addition, some ISPs have abandoned low-income neighborhoods in a form of “digital redlining.” Moreover, COVID-19 has exacerbated a longstanding digital divide that disproportionately affects low-income households and Black, Indigenous, and people of color (BIPOC) communities. As jobs and incomes are lost, this affordability crisis is poised to worsen. Congress and the FCC must take immediate action to stop digital redlining and help more people get online.
Consumers must navigate a maze of additional fees and hidden costs to determine the total price of internet service. These additional costs include equipment rental fees, installation and activation fees, data overage penalties, and contract termination fees—and they are often substantial. For instance, modem rental fees in the United States can add an additional 75 percent to the cost of monthly internet service, while abroad they may add an additional 30 percent. These ancillary fees create complicated pricing structures that make it difficult for consumers to compare plans and understand the total price they can expect to pay.
Municipal networks appear to offer some of the best value in the United States. In the U.S. market, prices vary widely across the country—but municipal networks tend to offer the fastest, most affordable options. Of the 14 U.S. cities in our study, the lowest average price is in Ammon, Idaho, a city with a municipally-owned open access network. A growing body of evidence indicates that these locally-owned networks yield significant cost savings for consumers, yet at least 20 states restrict or outright prohibit these networks from existing. These laws must be repealed so every community can invest in its own infrastructure.
The U.S. market suffers from a lack of competition. The U.S. market for internet service is dominated by just four companies: AT&T, Charter, Comcast, and Verizon. This lack of choice directly affects the cost and quality of internet service. The extent of ISPs’ market power is documented throughout this year’s report, from high monthly prices to the pervasiveness of early termination fees and lock-in contracts that inhibit competition. ISPs also broker exclusive deals with landlords to gain a monopoly on apartment buildings, leaving residents with no other choice of provider. The government should ban these exclusivity deals and strengthen antitrust enforcement in this market.
ISPs are not transparent with consumers, the government, or researchers. Many U.S. consumers struggle to determine the total cost of internet service due to poor transparency, highly complex pricing structures, and confusing itemized billing. Moreover, no government agency collects pricing data from ISPs, so it is difficult for policymakers to help consumers navigate this complex market. It is also extremely burdensome for independent researchers to study internet pricing. ISPs do not disclose accurate data about their networks, so it is difficult for researchers to determine where service is even available. Comparative analysis is challenging, too, due to a lack of standardization across providers and the complex plan structure. Therefore, it is critical that the government collect better data on internet deployment, availability, and pricing. ISPs should also disclose pricing terms in a “broadband nutrition label,” a standardized format that would help consumers comparison-shop and know what they are paying for.
Introduction
New America’s Open Technology Institute’s (OTI) latest Cost of Connectivity report comes at a difficult time for the world. The ongoing COVID-19 pandemic has changed daily life for billions of people, and many households are relying heavily on the internet for work, school, commerce, and social connection. In 2020, internet access is clearly an essential service, yet it remains unaffordable for many people. In this year’s report, we find that people can still expect to pay more for internet service in the United States than in Asia or Europe. Our previous studies—published in 2012, 2013, and 2014—consistently showed that U.S. consumers paid higher costs for slower speeds than consumers abroad. Some of these trends continue in our 2020 report. When measured by costs for each Mbps of advertised download speed, U.S. plans lag behind Asia but may be on par with Europe.
This year’s report contributes to a growing body of literature on internet affordability. In a recent study, price comparison service Cable.co.uk found that the United States ranked 119th out of 206 countries in internet affordability at $50 per month on average, and that due to a “lack of competition in the marketplace… Americans pay far more than they should compared to much of the rest of the world.”1 New York University economist Thomas Philippon points to internet service markets in the United States as an example of how increased corporate concentration leads to significantly higher prices.2 He estimates that the collective prevalence of monopolies and oligopolies across sectors typically costs American households over $5,000 annually each.3 In markets where ISPs (internet service providers) face little to no competition, consumers are the ones who suffer—they’re forced to pay higher prices, penalties for exceeding data caps, and, if they’re lucky enough to have more than one option for internet service, high switching costs.
What is Broadband?
A quick note on terminology: we differentiate between “internet” and “broadband” in our report. Broadband refers to high-speed internet access that delivers faster speeds via digital subscriber line (DSL), cable, fiber, wireless, or satellite.
We use broadband when referring to plans that advertise speeds at or above minimum broadband speeds, and internet everywhere else. To determine whether a plan is capable of broadband speeds, we rely on a plan’s advertised speeds and the FCC’s minimum broadband definition.4 The FCC’s definition of broadband has changed over the years to reflect consumers’ needs. In 2015, the FCC updated its definition for broadband to a minimum of 25 Mbps download and 3 Mbps upload speeds, which is often delineated as 25/3 Mbps.5 This change increased the minimum speeds for broadband adopted in 2010, 4 Mbps download and 1 Mbps upload, which we had used in our previous Cost of Connectivity reports as a baseline benchmark for data collection.6
Current FCC Commissioner Jessica Rosenworcel has called for increasing the national broadband standard from 25 Mbps to 100 Mbps.7 OTI has also advocated for a new, higher threshold for broadband at 100 Mbps download speed, while also expressing support for an even higher standard of 1 Gbps download speed, the equivalent of 1,000 Mbps.8
These standards are an important reflection of users’ needs. While high-speed internet may not be required for some activities, most households need over 25 Mbps. According to a Pew Research Center survey conducted in 2016, the typical U.S. household uses five devices, and nearly one-in-five households use at least 10 devices.9 While speeds below 25/3 Mbps may be sufficient for a single device, these households with five or more users or devices require over 25 Mbps for even moderate internet use, which the FCC defines as “basic functions plus one high-demand application: streaming HD video, multiparty video conferencing, online gaming, telecommuting.”10 These considerations are especially pertinent as the world grapples with the COVID-19 pandemic, which has shifted workplaces, classrooms, and many other aspects of daily life online for millions of people. As internet usage increases to reflect this shift, we need to consider how people are making trade-offs between speed, affordability, and shared devices in a household.
Given the importance of broadband as a national standard, we chose to look at all available standalone internet plans in each of the 28 cities we studied. This approach provides a more comprehensive picture of the state of internet access, and a robust dataset to analyze. In total, we examine 760 plans across Asia, Europe, and North America.
The lack of consumer choice in the U.S. internet service market is well documented. Most households are served by only one or two ISPs, effectively locking them into a monopoly or duopoly market.11 The Institute for Local Self-Reliance found that residents often have few, if any, choices when shopping for internet service, and they are usually limited to one of only six companies: AT&T, CenturyLink, Charter, Comcast, Frontier,12 or Verizon.13 Many areas aren’t served by any of these providers, including rural communities that the private sector has ignored and low-income urban neighborhoods that providers selectively avoid (a practice known as digital redlining).14
The lack of competition exacerbates the digital divide—not just between urban and rural communities, but also between households that can afford a home internet connection and those that cannot. Study after study has found that cost remains one of the biggest barriers to internet adoption.15 Without robust competition, prices tend to increase. Households increasingly rely on the internet for school, work, community, job opportunities, medical care, access to social safety net benefits, and so much more—and navigating the new realities of the COVID-19 pandemic has intensified this dynamic and laid bare the impact of the digital divide.
As we weather this public health crisis and its economic fallout, access to the internet is critical, and the disparities in access have never been more clear. In an April 2020 survey, 53 percent of U.S. adults said that the internet has been essential for them during the pandemic.16 But access to the internet is far from equal, and the digital divide disproportionately affects low-income households and Black, Indigenous, and people of color (BIPOC) communities. As the economy slows and companies lay off millions of workers, more and more people are struggling to pay for basic necessities—including internet service. The survey also found that 28 percent of consumers reported concerns about how to pay their home internet bills over the coming months, with higher percentages reporting these concerns from Black and Brown communities and low-income households.17 The digital divide is more stark than ever.
This report begins with an overview of our research methodology. We then present our findings in three parts: First, we examine our global dataset, focusing on the total cost of connectivity, network technologies, monthly prices, advertised speeds, value (based on the relationship between average monthly cost and average advertised download speed), and broadband affordability. Second, we examine the litany of ancillary fees and hidden costs that consumers must navigate to determine the total price of internet service. Third, we examine the U.S. market, focusing on its municipal networks, marginalized communities, and lack of pricing transparency. Finally, we present recommendations for U.S. policymakers that build off our research.
Citations
- “The Cost of Fixed-Line Broadband in 206 Countries,” Cable.co.uk, Existent Ltd., 2020, source
- See, e.g., Thomas Phillipon, The Great Reversal (Cambridge, MA: Belknap Press, 2019).
- David Leonhardt, “Big Business Is Overcharging You $5,000 a Year,” New York Times, November 10, 2019, source
- While this official definition for “broadband” exists, no government agency has set benchmarks for how to measure or verify these speeds. See, e.g., Peter Boothe and Georgia Bullen, “How fast is my Internet? Speed Tests, Accuracy, NDT & M-Lab,” Measurement Lab, March 26, 2019, source for more information.
- 2015 Broadband Progress Report and Notice of Inquiry on Immediate Action to Accelerate Deployment, Federal Communications Commission, adopted January 29, 2015, released February 4, 2015, source
- Jameson Zimmer, “FCC Broadband Definition Has Changed Before and Will Change Again,” BroadbandNow, February 10, 2018, source
- Statement of Commissioner Jessica Rosenworcel, Dissenting, “Fourteenth Broadband Deployment Report Notice of Inquiry,” Rosenworcel Dissenting Statement, adopted August 8, 2018, released: August 9, 2018, 14, source
- Amir Nasr, Eric Null, Joshua Stager, Reply Comments of New America’s Open Technology Institute, GN Docket No. 18-238, WC Docket No. 11-10, (October 1, 2018), source
- “A third of Americans live in a household with three or more smartphones,” Pew Research Center, May 25, 2017, source
- “Household Broadband Guide,” Federal Communications Commission, last modified February 5, 2020, source
- Jonathan Sallet, “Tell The Story We Know: Broadband Competition is Too Limited,” Benton Institute for Broadband & Society, March 6, 2020, source
- Frontier has since filed for bankruptcy and has sold its operations in Washington, Oregon, Idaho, and Montana. It maintains operations in 25 states. Jon Brodkin, “Frontier Files for Bankruptcy, Says Its Broadband Service Won’t Get Any Worse,” Ars Technica, April 15, 2020, source
- H. Trostle and Christopher Mitchell, Profiles of Monopoly: Big Cable and Telecom, (Institute for Local Self-Reliance, July 2018), source
- See, e.g., Claire Park, The Cost of Connectivity in West Virginia, (Washington, D.C.: New America’s Open Technology Institute, April 1, 2020), source ; and Bill Callahan, “AT&T’s Digital Redlining of Dallas: New Research by Dr. Brian Whitacre,” National Digital Inclusion Alliance, August 6, 2019, source
- See, e.g., Monica Anderson, “Mobile Technology and Home Broadband 2019,” Pew Research Center, June 13, 2019, source and John B. Horrigan and Maeve Duggan, “3. Barriers to Broadband Adoption: Cost is Now a Substantial Challenge For Many Non-Users,” Pew Research Center, December 21, 2015, source
- Emily A. Vogels, Andrew Perrin, Lee Rainie, and Monica Anderson, “53% of Americans Say the Internet Has Been Essential During the COVID-19 Outbreak,” Pew Research Center, April 30, 2020, source
- See, Emily A. Vogels, Andrew Perrin, Lee Rainie, and Monica Anderson, “53% of Americans Say the Internet Has Been Essential During the COVID-19 Outbreak,” Pew Research Center, April 30, 2020, source
Methodology
Our methodology builds upon prior Cost of Connectivity studies and has been refined to reflect changes in the market. We carefully crafted this methodology as part of our commitment to research integrity and public transparency.
City Selection
We selected 28 cities across Asia, Europe, North America to research in this year’s study.
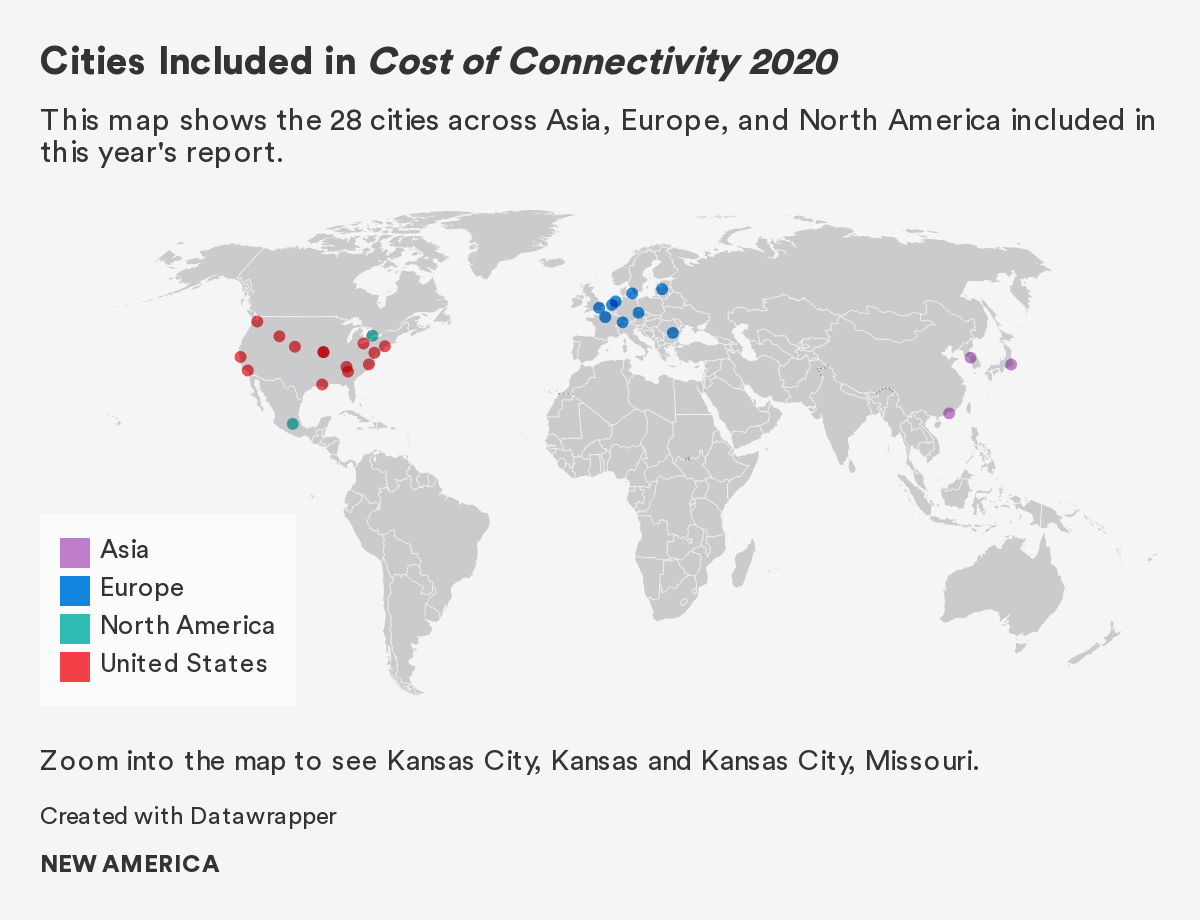
In Asia, we examined:
- Hong Kong, a Special Administrative Region of China;
- Seoul, South Korea; and
- Tokyo, Japan.
In Europe, we examined:
- Amsterdam, Netherlands;
- Bucharest, Romania;
- Copenhagen, Denmark;
- Dublin, Ireland;
- London, United Kingdom;
- Paris, France;
- Prague, Czech Republic;
- Riga, Latvia; and
- Zurich, Switzerland.
In North America, the majority are in the United States:
- Ammon, Idaho;
- Atlanta, Georgia;
- Chattanooga, Tennessee;
- Cleveland, Ohio;
- Fort Collins, Colorado;
- Kansas City, Kansas;
- Kansas City, Missouri;
- Lafayette, Louisiana;
- Los Angeles, California;
- New York, New York;
- San Francisco, California;
- Seattle, Washington;
- Washington, D.C.; and
- Wilson, North Carolina.
Outside of the United States, we also examined:
- Mexico City, Mexico; and
- Toronto, Canada.
We added six new cities to this year’s study: Ammon, Idaho; Atlanta; Cleveland; Fort Collins, Colo.; Seattle; and Wilson, N.C.18 We chose these additional cities to increase the diversity of our research sample based on geography, population density, city size, and network governance structure. We also considered unique local attributes. For instance, we added Cleveland because of local allegations of digital redlining.19
Though we may refer to metrics for Asia, Europe, North America, and the United States as a whole throughout the report, our analysis is limited to this 28-city dataset. While we expanded our city sample in this year’s report, we recognize that these cities may not be fully representative of their countries or continents.
Our dataset does not examine rural towns, as we determined the topic of rural connectivity was best examined through a separate report. In April, we published The Cost of Connectivity in West Virginia, which included extensive data collection in rural areas.20
Data Collection
This year’s report looks exclusively at standalone home internet plans available to new residential customers on providers’ websites. In the past, Cost of Connectivity included data on internet bundles that offered some combination of internet service with phone and/or television services. Bundling is still a widespread practice,21 but we focus on standalone internet plans exclusively this year to enable more robust and straightforward analysis on the costs of internet service alone. Some providers may provide clear cost breakdowns between each component of the bundle, but this level of transparency is not a uniform practice. Studying standalone internet plans enables us to make more streamlined price comparisons between plans as we take into account the lack of standard speed tiers and other plan aspects. Additionally, we do not include any mobile internet plans in this year’s report. While mobile is an important complement to fixed broadband service, it is not a substitute—an issue that we have emphasized before in our advocacy.22
We relied on a variety of publicly available sources to gather and verify data on all 760 standalone internet plans that we could locate across each city from June 2019 to March 2020. To collect this information, we navigated to available residential internet plans from the home page of the ISPs’ websites and, if prompted, manually entered addresses and zip codes corresponding to real homes in the community. For U.S. plans, we selected addresses by cross-checking the FCC’s fixed broadband deployment data with publicly available addresses in Google Maps.23 All addresses used in our data collection are included in Appendices B and C.
Many service providers operating in international regions don’t provide information on their websites in English. To collect data on these plans to the best of our ability, the research team relied on individual language proficiencies and/or Google Translate to help identify plan details.24 In some cases, information about a specific plan may be incomplete because it was not disclosed on a service provider’s website, or because researchers’ proficiency in the operative language limited our ability to collect this information.25
As in our studies from previous years, all data collected reflects advertised costs that a new consumer would pay and advertised speeds from ISPs, which does not necessarily reflect total actual costs a consumer would pay or speeds they would actually experience. In the absence of government-collected pricing data, advertising data remains one of the best, if limited, sources of public information on internet pricing. The price as advertised may in some cases include taxes, but providers did not always disclose this information. Across all of the providers’ websites, we gathered data on the following aspects if they were advertised:
- Monthly promotional and non-promotional pricing: The promotional price is a lower price offered initially before increasing to the non-promotional price after the promotion term expires. We also note the length a promotion is offered if it is disclosed; generally we record the length in months. Occasionally, ISPs advertise multiple promotions offered for different lengths. For instance, AT&T sometimes offers a $10/month promotion for 12 months, plus an ongoing $10/month stacked promotion. We notate this stacked promotion as “12/ongoing” in the “term of promo discount” column and include an explanation in the "notes" field. If the price changes during the length of a contract, the price listed reflects an average of the monthly subscription costs over the course of the contract term.26 If a provider offers a plan with a “price for life” promotion, we record the price as a promotional price and note "price for life" in “term of promo discount.” Providers often list either a promotional price or non-promotional price on a monthly basis, and we record both where available.
- Autopay/paperless billing discount: Separately from promotional pricing, providers sometimes offer a monthly discount if consumers enroll in autopay and paperless billing.
- Network technology: Our dataset records the network technology if the provider advertises the technology used. For the purposes of our report, we focus on plans that rely on DSL, cable, and fiber technologies, or some combination of the above.
- Download and upload speeds: We list all speeds in megabits per second (Mbps). We collect data on all plans listed on a provider’s website, even if it doesn’t meet the current FCC minimum definition of broadband at 25/3 Mbps.27 If a provider lists a range, we record the minimum speed. It is important to note that all internet speeds are based on advertised speeds, which does not always reflect the speeds users experience.
- Data caps and overage penalties: Data caps are limits on the amount a user, or a group of users on a shared plan, can download or upload in a single billing period. We record them in gigabytes (GB). Where the penalty for exceeding a data cap is an overage fee, we note the monetary amount and the data increment at which it occurs; for example, $10 for every 1 GB (notated as $10/GB). Where a provider may advertise unlimited data and instead implement a data cap after which a user experiences slowed speeds for a period of time—usually through the end of the billing cycle—this penalty is noted as “throttling” in the appropriate column and the point of data consumption at which throttling begins is noted in the “data cap” column. We do not record the reduced speeds when throttling occurs, though it is sometimes disclosed by the provider.
- Equipment costs and/or rental fees: We record any fees or costs associated with renting or purchasing a modem or router directly from the ISP. If providers provide the option to rent the equipment for a monthly fee or to purchase it for a one-time cost, both options and prices are recorded in our dataset. A consumer would not necessarily pay both rental and purchase fees or require both a modem and router. For example, Comcast offers consumers the option of renting a multifunctional device called a wireless gateway that combines both the functions of a modem and router.28 Providers may also offer the option for consumers to use their own equipment, but we do not account for this option in our dataset. If a provider waives such fees, we record the amount as $0 in the field, but note the amount that the fee would typically be if the provider discloses this information in “notes.”
- Installation fees: This one-time fee relates to the cost of a technician visit to set up service in a consumer’s home. We record free or waived installation fees as $0. A consumer does not have to pay an installation fee if they opt to self-install instead. Some providers charge either an installation or activation fee, or both.
- Self-installation fee: If a provider offered consumers an option to self-install, we record the one-time fee in our dataset. This option may not always be available, and requires that a consumer’s home already be wired for a provider’s service. We record free self-installation options as $0. A consumer does not have to pay a self-installation fee if they opt for professional installation instead.
- Activation fees: Activation fees are a one-time administration charge for a provider to activate a consumer’s service. Some providers charge either an installation or activation fee, or both.
- Contract lengths: Contract lengths are recorded in months. A handful of plans in our dataset require 7-day or 18-day contract lengths, which we convert to monthly increments assuming a 30-day month. Where prices vary depending on different contract lengths, we record the different contract terms as different plans. Month-to-month plans, which are often advertised as “no contract” plans, nonetheless require one month’s commitment, and thus, are notated by a “1” in the appropriate column.
- Contract termination fees: We record early termination fees if they are advertised as a one-time fee. Often, providers charge consumers a one-time fee or a certain amount for each remaining month on their contract for early termination. We record details on the latter scenario in the “notes” field for the relevant plan. If a provider requires payment for the remainder of the month upon early termination of a consumer’s contract, we record it as “not applicable.” Because internet service is billed in monthly increments, this “contract termination fee” would already have been captured in the monthly price field.
This approach means that we may not have captured all the related costs that a consumer would pay for internet access. For instance, we do not record any additional costs related to subscriptions that rely on a municipal network, such as the monthly utility fee charged by the city of Ammon, Idaho for plans on its open access network.29 We also do not include the one-time construction fee for new connections to Google Fiber.30 Some providers may also charge hidden fees that are not captured in our research.31 In addition, not every internet plan listed information on each aspect on which we were gathering data; the lack of data is signified by “no data” or a “—” in our data visualization and appendices. Some providers stated that certain aspects were not applicable to their offerings, which is noted in our dataset.
Plans are labeled by the city, ISP, and speed. If a provider offers multiple versions of a plan at the same speed, that differentiation is notated by a letter following alphabetical order after the speed in the plan label. For example, KCI offers two plans at 100 Mbps in Fort Collins, Colo. at contract terms of month-to-month and one year. Each plan is labeled as “Fort Collins, kci, 100A,” and “Fort Collins, kci, 100B.”
When prices are listed in foreign currencies, we convert prices to U.S. dollars (USD) to the nearest two decimal points based on the World Bank’s purchasing power parity (PPP) metric.32 Unlike direct exchange rates, which are often volatile and do not account for global income disparities, PPP conversion rates adjust for differences in the cost of living, price levels, and other factors that affect a consumer’s purchasing power. This conversion allows us to make more effective comparisons among the cities featured in the report. Throughout our report, dollar amounts are rounded to the nearest two decimal points, all prices are listed in USD, and all percentages are rounded to the nearest whole number.
The data we compiled is a near-comprehensive effort to include all available standalone internet plans that were listed publicly on the ISPs’ websites at the time of collection. Other internet plans may be available, but all analysis in this report is limited to the 760 plans included in our dataset and the information that was available at the time of data collection (see Appendices B and C). Our dataset does not necessarily represent the available plans for each city as a whole, as certain plans may not be available in all locations.
We do not include plans that are targeted toward Lifeline subscribers or standalone low-income internet offerings from providers in our dataset.33 Several ISPs, such as CenturyLink,34 Frontier,35 and RCN,36 offer Lifeline plans. AT&T,37 Charter (under its Spectrum brand),38 and Comcast39 do not participate in Lifeline but offer separate standalone internet plans for low-income consumers. These plans are omitted because providers shared little to no information about them on their websites. In addition, they are not located with the residential plans on providers’ websites, and required additional navigation to find. Often, we had to navigate to a provider’s discounts page or use a third-party search engine to locate these plans. Nonetheless, we discuss some of these plans for context in our findings on internet affordability.
Data Analysis
Our data analysis is divided into three parts: First, we examine international markets. Second, we examine four types of ancillary fees. Third, we examine the U.S. market.
For our analysis on international markets, we compare: (1) approximations for the total cost consumers can expect to pay for internet service; (2) monthly prices across network technology; (3) monthly prices; (4) advertised download and upload speeds; (5) value, based on average monthly costs for comparable average advertised download speeds; and (6) monthly prices for minimum advertised broadband tiers.
For our analysis on ancillary fees, we focus on four different components of internet service plans: (1) installation and activation fees; (2) equipment fees; (3) data caps and data overage penalties; and (4) contract terms and early termination fees.
For our analysis on the U.S. market, we examine: (1) municipal networks; (2) the disproportionate impact the lack of affordability has on BIPOC and low-income communities; and (3) the lack of pricing transparency.
An important caveat: All analysis is based on advertised costs and speeds, which may not reflect the actual prices consumers pay or the speeds they experience. In the absence of government collection of pricing data or ISP disclosure of their records, advertising data remains one of the best, if limited, sources of public information on internet pricing.
In the remainder of this section, we detail the methodology used to examine each component of internet service plans.
Network Technologies
The quality of internet service varies depending on network technology. DSL is not as fast or reliable as cable and fiber, and it generally provides slower speeds and higher latency than cable.40 DSL typically delivers 5 to 35 Mbps download speeds and 1 to 10 Mbps upload speeds.41 Cable and fiber, on the other hand, are capable of providing high speeds: Cable typically delivers 10 to 500 Mbps download speeds and 5 to 50 Mbps upload speeds, and fiber typically delivers 250 to 1,000 Mbps speeds.42 Fiber is also capable of providing symmetrical download and upload speeds, even at gigabit speeds, which translates to faster and larger data uploads for users.43 Higher upload speeds are particularly important in the ongoing COVID-19 pandemic because users who telework or participate in distance learning require them for stable video conference connections in real time.
To conduct our analysis, we examine the average monthly price for each network technology by group: DSL, cable, and fiber. We count ADSL, ADSL2+, and VDSL technologies as DSL. Fiber includes any services that specify fiber-to-the-home and fiber-to-the-node (FTTN) technologies. Services based on hybrids of these technologies are excluded from the single-technology groupings and this analysis. These combinations include ADSL/FTTN, DSL/fiber, cable/fiber, and fiber/copper-to-the-home.
Monthly Internet Prices
Comparative analysis of internet service plans is challenging due to a lack of standardization across providers and the complex structure of plans and pricing. In addition, our dataset includes cities of varying population density. To address these discrepancies to the best of our ability, we use a two-pronged approach in our analysis of monthly internet prices.
First, we compare monthly prices that are advertised on the provider’s website. Where only the promotional or non-promotional price is listed, we cite that number in our analysis. If providers list both a promotional and non-promotional price, we adopt the promotional price in our analysis unless specified.44
Second, we compare internet prices across cities with similar population densities. A given area’s population density affects the potential per-consumer return on internet infrastructure implementation costs, and can therefore be an important variable that impacts internet speeds and prices.45 We record population densities in population per square kilometer.
We do not include monthly or one-time autopay/paperless billing discounts, data overage penalties, equipment fees, installation fees, and activation fees in our analysis on monthly internet prices because the consumer experience varies so widely on these plan aspects. For instance, each individual consumer will choose whether to buy or rent the necessary equipment for internet service based on their own unique circumstances. Consumers can have different data overage fees, too, depending on users’ data usage. We choose to analyze these components separately from the monthly internet price. We also are unable to standardize for differences in contract terms, data caps, and upload speeds in our analysis. As a result, our analysis underestimates the monthly internet costs advertised to consumers.
In calculating the average and median prices for internet service, we omit multiple plans from the same provider with the same monthly pricing but different contract terms (i.e., contract lengths or installation fees). In the United States, we omit six plans from this analysis: three month-to-month KCI plans in Fort Collins, Colo.; the 12-month contract option for the 1,000 Mbps download speed plan advertised in Fort Collins, Colo. by Comcast under its Xfinity brand; the 24-month contract option for the 1,000 Mbps download speed plan advertised in Seattle by Comcast under its Xfinity brand; and the 200 Mbps download speed plan from Charter under its Spectrum brand advertised in Kansas City, Mo. because the plan has no monthly internet pricing data. We use the 290-plan U.S. dataset for monthly pricing analysis where applicable.
We omit 24 plans in Mexico City, and 22 plans in Toronto, and use the 706-plan U.S. and international dataset for all monthly pricing analysis where applicable. We omit the month-to-month, 3-month, 6-month, 9-month, and 18-month length plans advertised by Telmex in Mexico City, and the 12-month and 24-month plans offered by Gemstelecom in Toronto.
Advertised Download and Upload Speeds
We separately examine the average and median advertised download and upload speeds across plans in each city. We compare the “speed leaders” in each category and rank each city by the average speed of plans advertised in each city. Providers do not always advertise information on the download and/or upload speeds for each particular plan; plans in our dataset for Mexico City and Seoul have no data for upload speeds, and thus, both cities are omitted from this analysis on upload speeds.
Installation and Activation Fees
We examine installation, self-installation, and activation fees, and compare average advertised fees across continents and countries. Providers do not always disclose the fees on their websites or provide information on whether a certain fee was mandatory. Additionally, providers do not always offer an option to self-install. Plans in our dataset without the relevant information are omitted from this analysis.
Equipment Fees
We examine the average price consumers can expect to pay for one-time equipment purchase fees or monthly equipment rental fees for modem and Wi-Fi routers from the ISP across countries and continents. A consumer would not necessarily pay both monthly rental and one-time purchase fees, or require both a modem and Wi-Fi router. Providers do not always disclose the fees on their websites or provide information on whether a certain fee was mandatory, and plans in our dataset without the relevant information are omitted from this analysis. Los Angeles plans in our dataset, for instance, omit information on monthly modem rental fees, and are therefore excluded from this analysis.
Data Caps and Overage Penalties
We examine the average data cap across plans in our dataset. Data caps and their associated overage penalties impose additional costs on users should they go over their allocated data usage. We look at data overage penalties and data caps advertised by ISPs, if available. For instance, at the time of data collection, Wave advertised a data cap, but presented no information on the relevant overage penalty for users who exceed the data cap. Thus, we exclude Wave’s plans from this analysis. We conduct this analysis across cities. While we record throttling penalties in our dataset, our analysis is limited to monetary penalties for data overages. We round data caps to the nearest two decimal points in our report.
Contract Lengths and Early Termination Fees
We examine contract lengths and early termination fees, as they affect switching costs for consumers and can play an integral role in stifling competition. We compare median contract lengths and average early termination fees across cities and continents.
Citations
- “The Cost of Fixed-Line Broadband in 206 Countries,” Cable.co.uk, Existent Ltd., 2020, source">source
- See, e.g., Thomas Phillipon, The Great Reversal (Cambridge, MA: Belknap Press, 2019).
- David Leonhardt, “Big Business Is Overcharging You $5,000 a Year,” New York Times, November 10, 2019, source">source
- While this official definition for “broadband” exists, no government agency has set benchmarks for how to measure or verify these speeds. See, e.g., Peter Boothe and Georgia Bullen, “How fast is my Internet? Speed Tests, Accuracy, NDT & M-Lab,” Measurement Lab, March 26, 2019, source">source for more information.
- 2015 Broadband Progress Report and Notice of Inquiry on Immediate Action to Accelerate Deployment, Federal Communications Commission, adopted January 29, 2015, released February 4, 2015, source">source
- Jameson Zimmer, “FCC Broadband Definition Has Changed Before and Will Change Again,” BroadbandNow, February 10, 2018, source">source
- Statement of Commissioner Jessica Rosenworcel, Dissenting, “Fourteenth Broadband Deployment Report Notice of Inquiry,” Rosenworcel Dissenting Statement, adopted August 8, 2018, released: August 9, 2018, 14, source">source
- Amir Nasr, Eric Null, Joshua Stager, Reply Comments of New America’s Open Technology Institute, GN Docket No. 18-238, WC Docket No. 11-10, (October 1, 2018), source">source
- “A third of Americans live in a household with three or more smartphones,” Pew Research Center, May 25, 2017, source">source
- “Household Broadband Guide,” Federal Communications Commission, last modified February 5, 2020, source">source
- Jonathan Sallet, “Tell The Story We Know: Broadband Competition is Too Limited,” Benton Institute for Broadband & Society, March 6, 2020, source">source
- Frontier has since filed for bankruptcy and has sold its operations in Washington, Oregon, Idaho, and Montana. It maintains operations in 25 states. Jon Brodkin, “Frontier Files for Bankruptcy, Says Its Broadband Service Won’t Get Any Worse,” Ars Technica, April 15, 2020, source">source
- H. Trostle and Christopher Mitchell, Profiles of Monopoly: Big Cable and Telecom, (Institute for Local Self-Reliance, July 2018), source">source
- See, e.g., Claire Park, The Cost of Connectivity in West Virginia, (Washington, D.C.: New America’s Open Technology Institute, April 1, 2020), source">source ; and Bill Callahan, “AT&T’s Digital Redlining of Dallas: New Research by Dr. Brian Whitacre,” National Digital Inclusion Alliance, August 6, 2019, source">source
- See, e.g., Monica Anderson, “Mobile Technology and Home Broadband 2019,” Pew Research Center, June 13, 2019, source">source and John B. Horrigan and Maeve Duggan, “3. Barriers to Broadband Adoption: Cost is Now a Substantial Challenge For Many Non-Users,” Pew Research Center, December 21, 2015, source">source
- Emily A. Vogels, Andrew Perrin, Lee Rainie, and Monica Anderson, “53% of Americans Say the Internet Has Been Essential During the COVID-19 Outbreak,” Pew Research Center, April 30, 2020, source">source
- See, Emily A. Vogels, Andrew Perrin, Lee Rainie, and Monica Anderson, “53% of Americans Say the Internet Has Been Essential During the COVID-19 Outbreak,” Pew Research Center, April 30, 2020, source">source
- The 2014 report included 24 cities, and we include all but two of these cities in this year’s report. We omit Berlin, Germany because we were unable to find any standalone internet plans advertised on providers’ websites. We omit Bristol, Virginia because the city has since sold its municipal network: Brandon Bailey, “Sunset Digital to become Point Broadband,” NBC/CW WCYB-TV, May 2, 2019, source
- Bill Callahan, “AT&T’s Digital Redlining Of Cleveland,” National Digital Inclusion Alliance (blog), March 10, 2017, source
- Claire Park, The Cost of Connectivity in West Virginia, (Washington, D.C.: New America’s Open Technology Institute, April 1, 2020), source
- For instance, Sonic, an ISP that services the San Francisco and Los Angeles areas, offered bundle options with internet and phone services at the time of data collection. This approach means that at least several ISPs are excluded from our dataset.
- See, e.g., Amir Nasr, Claire Park, Eric Null, Comments of New America’s Open Technology Institute and Access Now, GN Docket No. 19-285, (November 21, 2019), source (“Specifically, mobile broadband is not a substitute for fixed broadband due to the functional difference in how consumers use the services. Mobile broadband is typically higher cost, less reliable (especially in rural areas), slower, and subject to data caps and expensive overage fees in comparison to fixed broadband. Further, mobile broadband is increasingly reliant on fixed broadband for backhaul and offloaded traffic. It would make no sense for the Commission to deem mobile broadband a substitute for fixed broadband when the former service is dependent on the latter.”)
- “Fixed Broadband Deployment,” Federal Communications Commission, June 2019, source
- Researchers’ language proficiencies included German, Korean, and Spanish.
- As indicated below, the lack of data is signified by “no data” or a “—” in our data visualization and appendices.
- For example, if a plan advertises a two-year contract with promotional pricing for the first 12 months, we calculate the average price for the entire contract term and record it as the monthly promotional price. For this particular example, we would take the average of 12 months at the promotional price and the sum of 12 months at the non-promotional price.
- 2019 Broadband Deployment Report, Federal Communications Commission, adopted May 8, 2019, released May 29, 2019source
- We record rental fees for Comcast’s wireless gateway under “modem rental fees” throughout our dataset and note that a consumer would not have to pay an additional fee to rent a router.
- See Becky Chao and Lukas Pietrzak, The Cost of Connectivity in Ammon, Idaho, (Washington, D.C.: New America’s Open Technology Institute, January 22, 2020), source for more information.
- “Google Fiber Fee Schedule,” Google Fiber, last modified April 13, 2020, source
- WTFee Survey 2018 Nationally Representative Multi-Mode Survey, (Consumer Reports: January 3, 2019), source ; Karl Bode, “Hidden Fees Mean US Cable & Broadband Bills Can Be 45% Higher Than Advertised,” techdirt, October 1, 2019, source
- “GDP, PPP (current international $),” World Bank, source
- Lifeline is the federal subsidy program for internet and phone services. For more information, see “What is Lifeline?” in the “COVID-19 Exacerbates Affordability Problems, Particularly for BIPOC Communities and Low-income Households” section of this report.
- “Lifeline,” Community Development Program, CenturyLink, last accessed May 27, 2020, source
- “Frontier Lifeline Program,” Frontier Communications Corporation, last accessed May 27, 2020, source
- “Lifeline,” RCN telecom Services, last accessed May 27, 2020, source
- “Frequently Asked Questions,” Low-Cost Home Internet, AT&T, last accessed May 27, 2020, source
- “Spectrum Internet Assist,” Charter Communications, last accessed May 27, 2020, source
- “Internet Essentials Brings Affordable High-Speed Internet Home,” Internet Essentials, Comcast, last accessed May 27, 2020, source
- Tyler Cooper, “DSL vs Cable vs Fiber: Comparing Internet Options,” BroadbandNow, last updated December 12, 2019, source
- Cooper, “DSL vs Cable vs Fiber: Comparing Internet Options.”
- Our analysis on monthly internet prices throughout this report defaults to promotional pricing, unless no information on promotional pricing is provided, in which case, we adopt the non-promotional pricing for that plan instead. We note all other exceptions to this rule.
- Visnja Cik Krizanovic, Drago Zagar, and Kresimir Grgic, “A framework for optimal techno-economic assessment of broadband access solutions and digital inclusion of rural population in global information society,” Universal Access Information Society, 17 (2018): 517–540, source
Global Findings
Across the Asian, European, and North American markets in our dataset, we (1) compare approximations for the total cost consumers can expect to pay for internet service; (2) examine how monthly prices change based on network technology; (3) compare monthly cost; (4) compare advertised download and upload speeds; (5) compare value, based on average monthly cost for comparable average advertised download speeds; and (6) examine the affordability of internet service plans, based on analysis of monthly prices at standardized tiers.
The Total Cost of Connectivity Depends on the Scenario
Many different components make up the total price that consumers pay for internet service. Internet service plans typically include a combination of one-time fees, monthly recurring fees, and, in certain circumstances, one-off fees for data consumption overages or contract termination fees based on advertised costs from providers’ websites. In the following table, we look at the average costs that consumers in each city can expect to pay for each of these components.
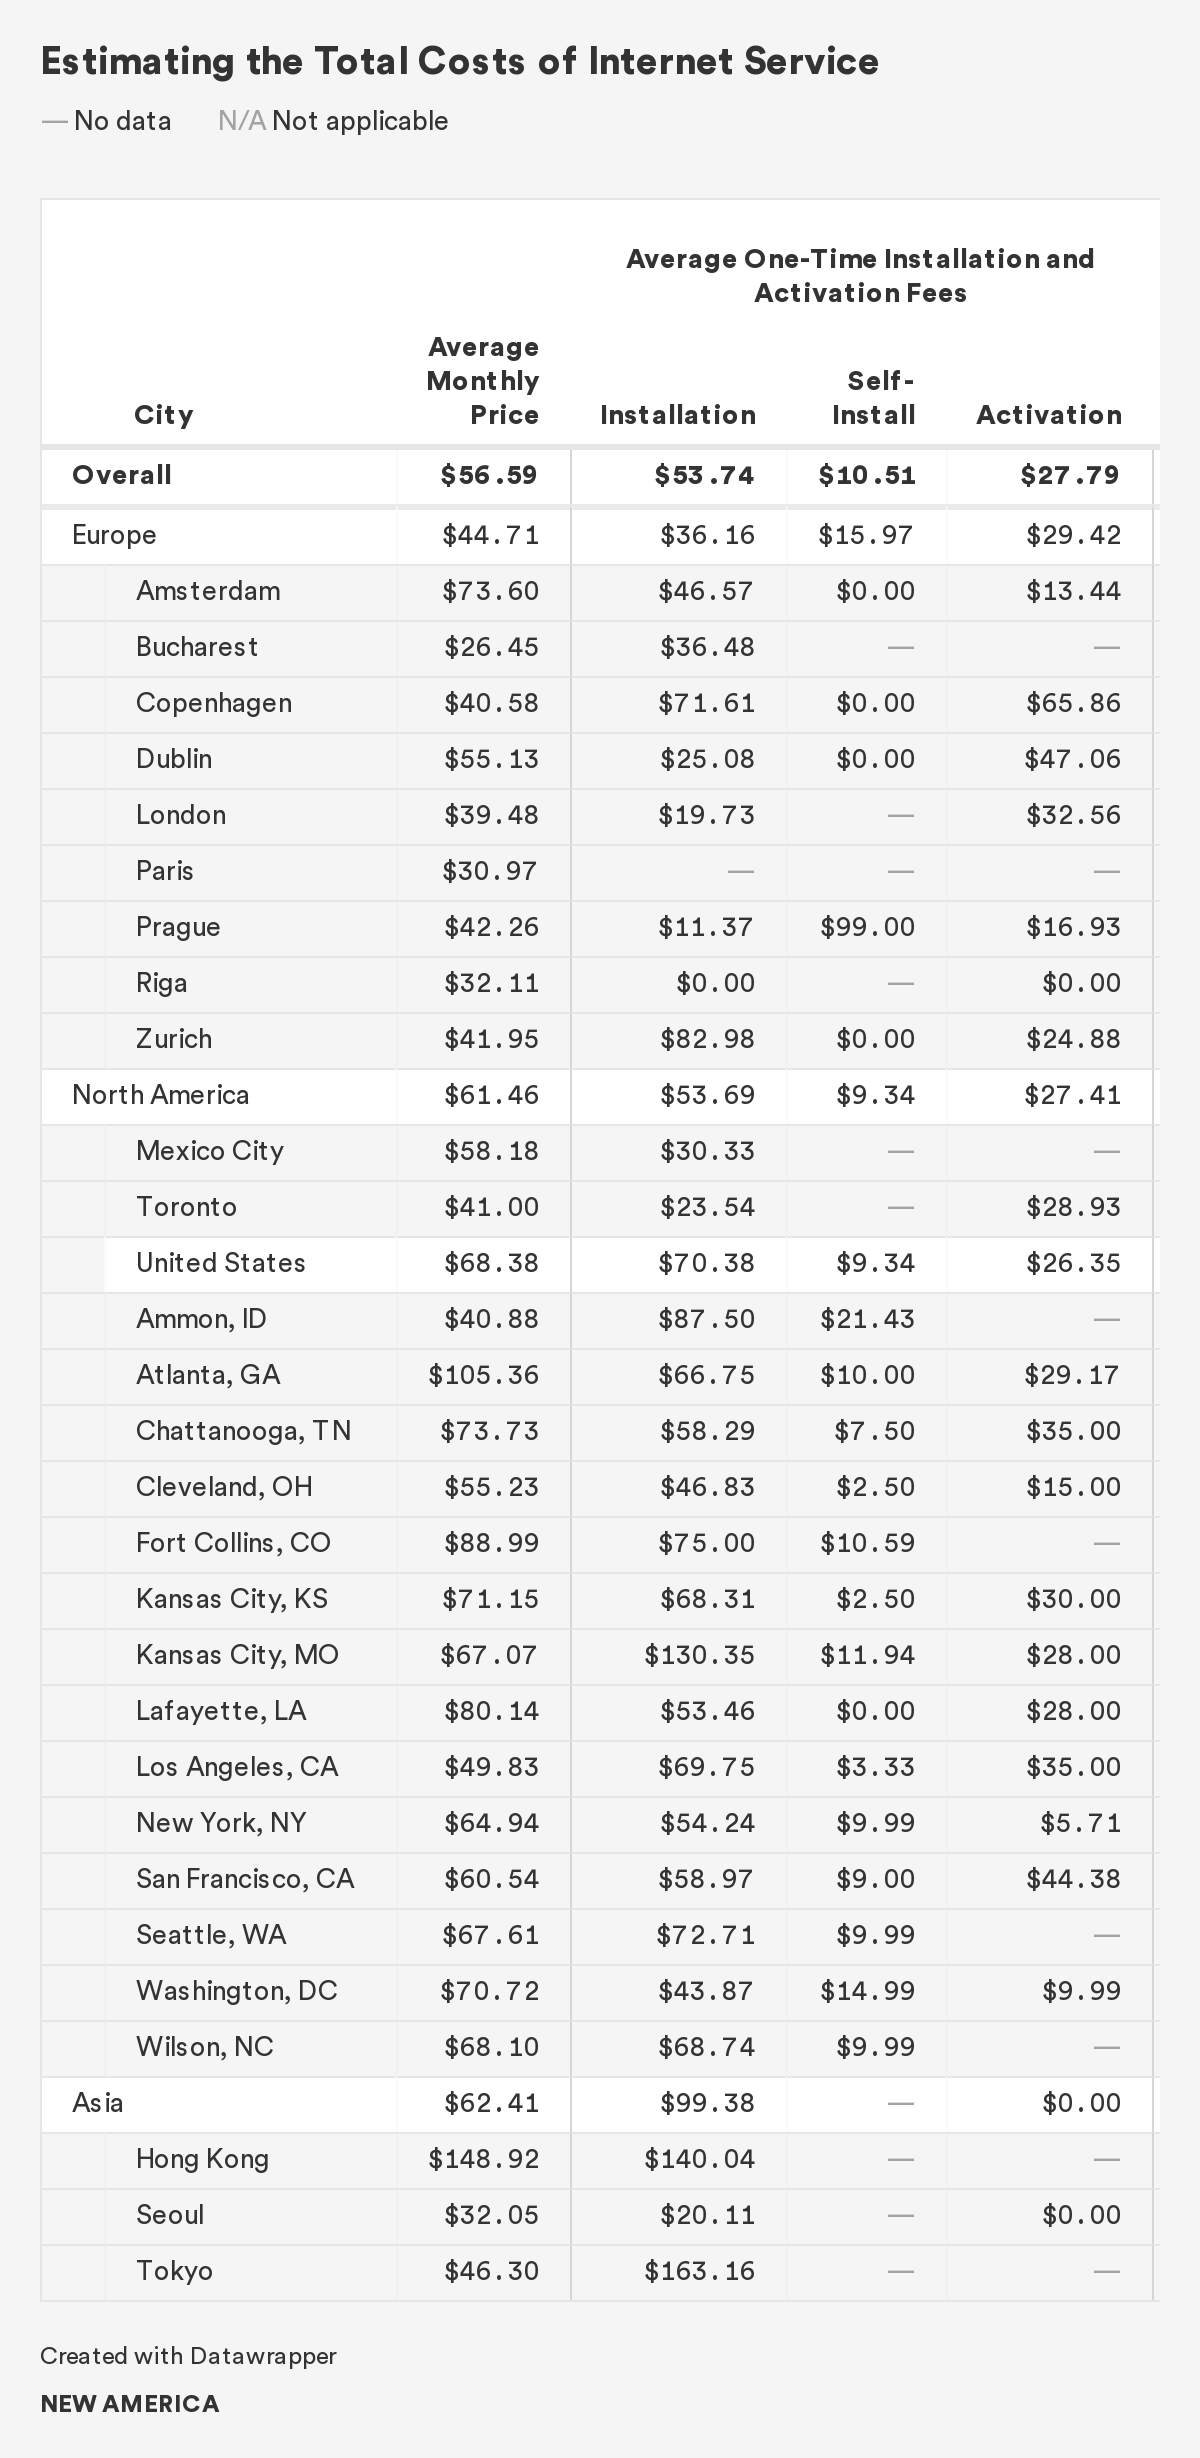
First, consumers pay a baseline monthly price for internet service. This price consists of either a promotional or a non-promotional rate. For the purposes of our analysis, we default to using a provider’s promotional price if available, and where unavailable, we adopt the non-promotional price for that plan.
Second, consumers pay additional fees to set up their service. They sometimes have the choice between paying a higher fee for professional installation that requires a technician or a lower self-installation fee for the consumer to set up their network themselves. Self-installation options are only available if a consumer’s home is already wired for service. Some providers charge an additional activation fee on top of installation fees. In our approximation of the total costs for internet service, we assume that the average consumer pays either a professional installation fee or self-installation fee, on top of an activation fee.
Third, consumers pay either monthly equipment rental fees for a modem and/or Wi-Fi router, or one-time fees upfront to purchase this equipment. We assume that the average consumer either rents or purchases their equipment, and that they require both a modem and Wi-Fi router for internet service because routers require a modem to connect to the internet, though sometimes a single device may be sufficient based on the individual consumer’s circumstances and the network requirements.46
Fourth, some providers have monthly limits on data usage and impose penalties if users go over this cap. Penalties can include overage fees and throttled, reduced speeds. We limit our analysis here to monetary penalties. These fees apply only if users exceed the data cap.
Fifth, providers often charge a one-time fee if consumers terminate their contracts early.
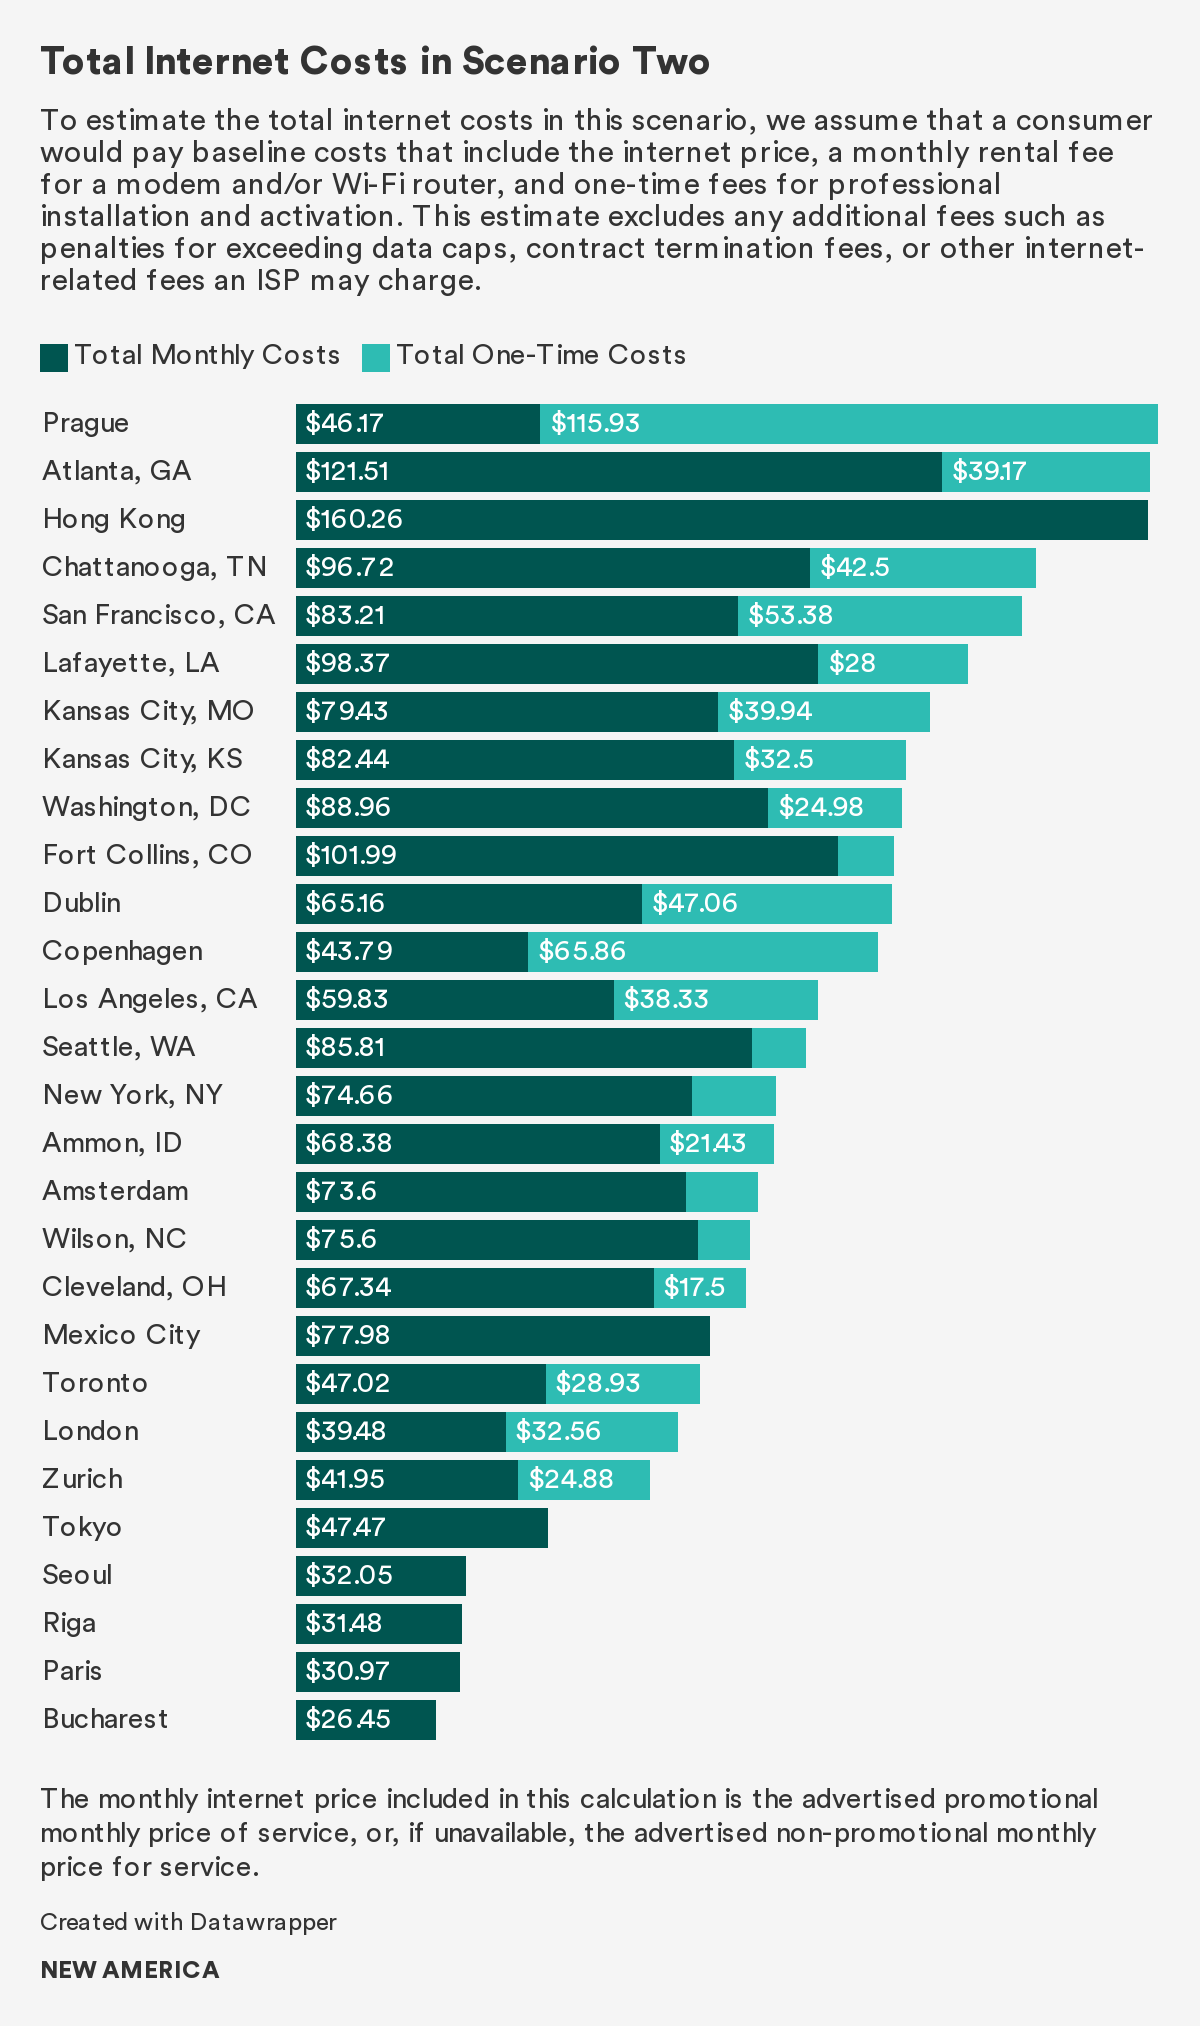
While total prices will vary based on the individual consumer’s scenario, we are able to examine a few baseline costs that apply to every consumer: monthly internet service, equipment, and installation/activation. We compare these approximations for total internet costs across four different scenarios: (1) consumers who opt for equipment rental and professional installation; (2) consumers who opt for equipment rental and self-installation; (3) consumers who opt for equipment purchase and professional installation; and (4) consumers who opt for equipment purchase and self-installation. In each of these scenarios, we assume that consumers pay the activation fee, too.
Consumers in Asia pay the most for these baseline costs, followed by consumers in the United States, and then those in Europe. These baseline costs are likely low average estimates for what consumers pay, especially because they exclude a litany of ancillary fees like taxes, surcharges, and other fees for “internet-related” items, as well as data overage penalties and contract termination fees when applicable. Our findings also rely on advertised prices and speeds, which may not reflect the actual prices consumers pay or the actual speeds they experience.47
In the first and second scenarios, consumers pay a monthly average of $84.37 ($68.38 for internet service plus $15.99 in equipment rental fees) in the United States, $46.83 ($44.71 for internet access plus $2.12 in equipment rental fees) in Europe, and $64.29 ($62.41 for internet service plus $1.88 in equipment rental fees) in Asia.
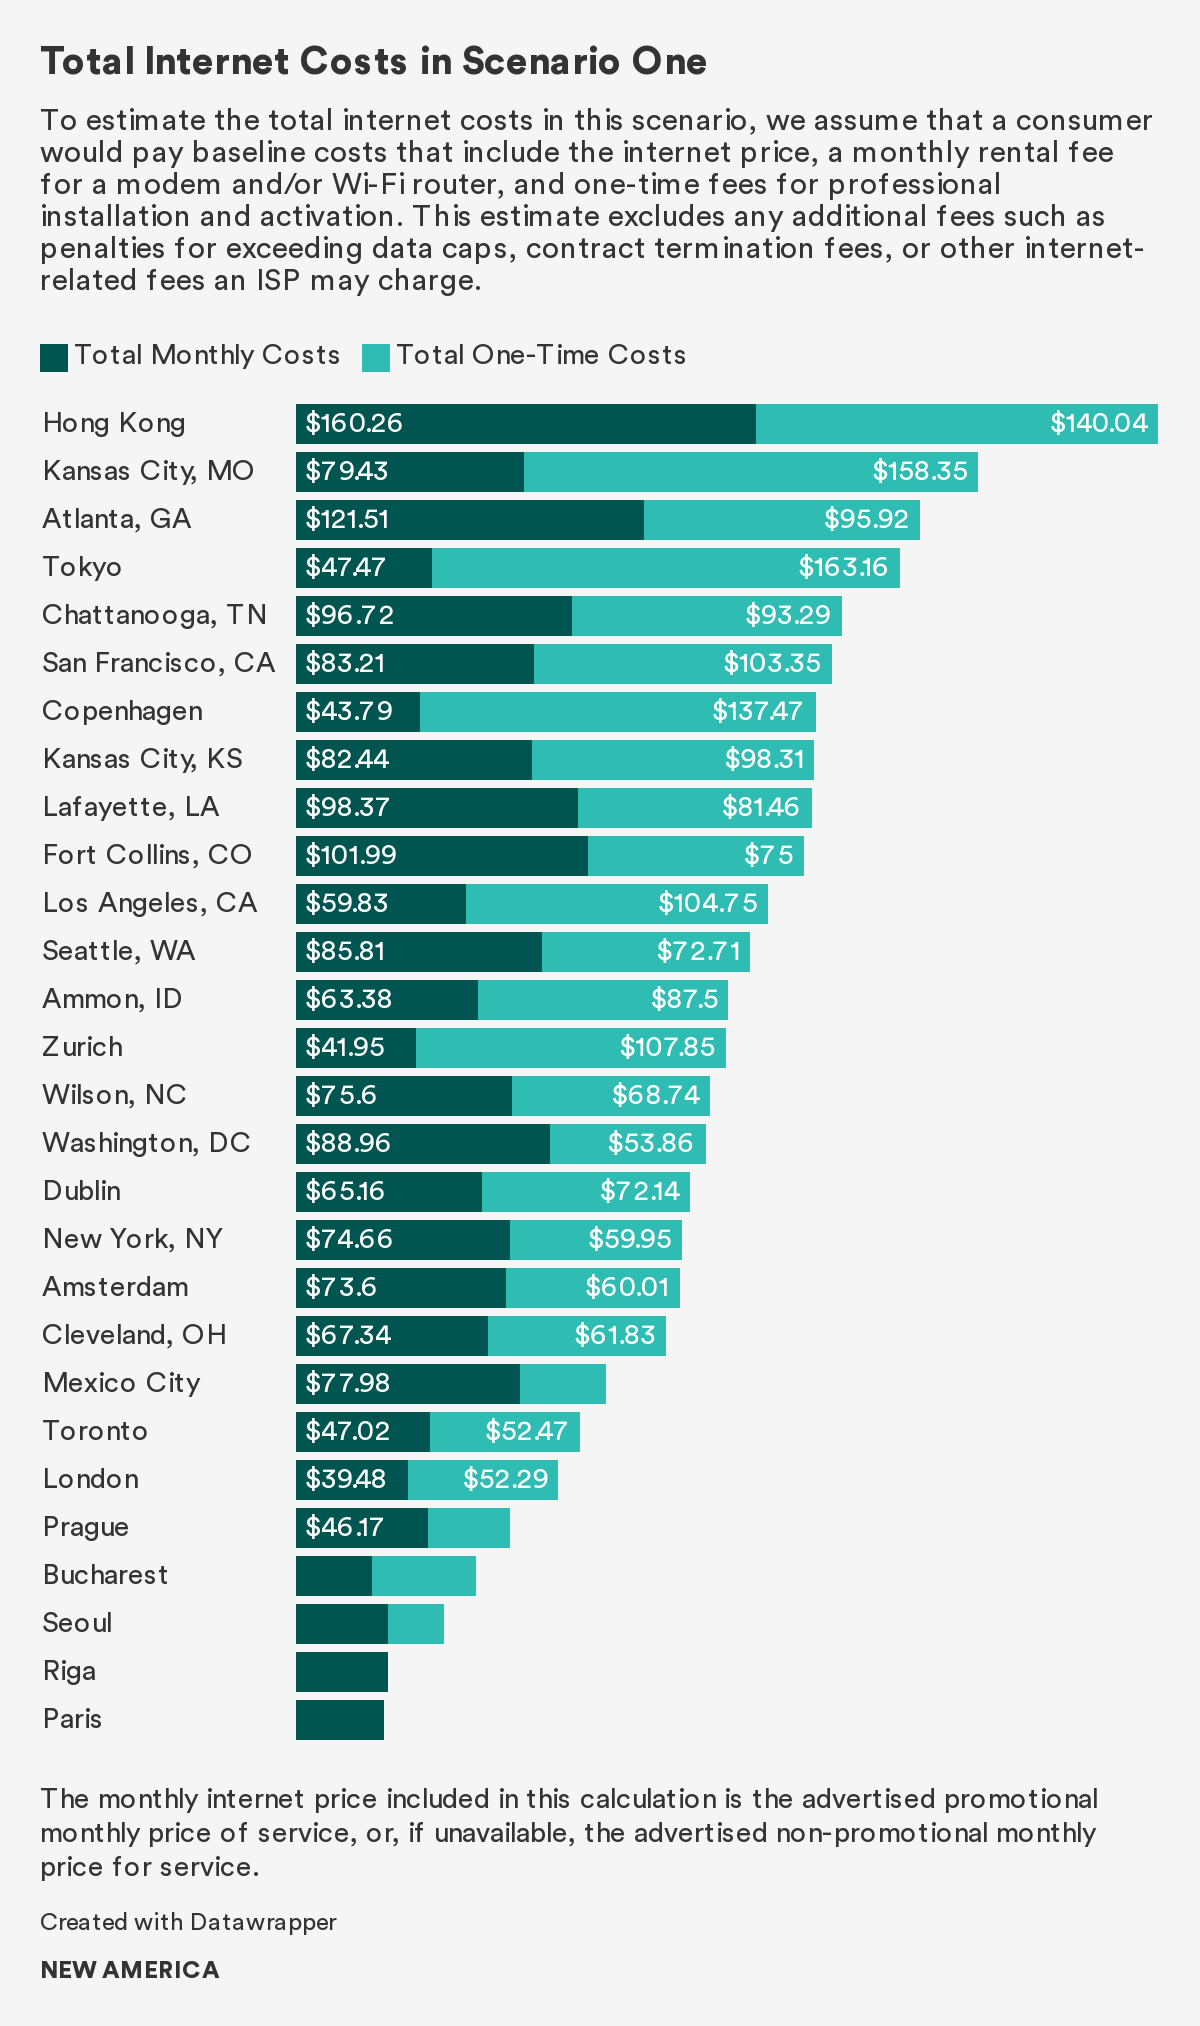
If consumers opt for professional installation, they pay an average one-time cost of $96.73 in the United States, $65.58 in Europe, and $99.38 in Asia. These one-time costs include professional installation and activation fees. Assuming consumers commit to a provider for a year, consumers pay on average $1,109.17 in the United States, $627.54 in Europe, and $870.86 in Asia for total internet costs annually if they choose to rent equipment and opt for professional installation. U.S. consumers in this scenario pay on average 77 percent more than European consumers, and 27 percent more than what Asian consumers pay.
If consumers opt for self-installation, they pay an average one-time cost of $35.65 in the United States and $45.39 in Europe. No information on self-installation options was available for the plans in our dataset in Asia, so we exclude Asia in this analysis. These one-time costs include self-installation and activation fees. Assuming consumers commit to a provider for a year, consumers pay on average $1,048.09 in the United States and $607.35 in Europe for total internet costs annually if they choose to rent equipment and opt for self-installation. U.S. consumers in this scenario pay 73 percent more than European consumers.
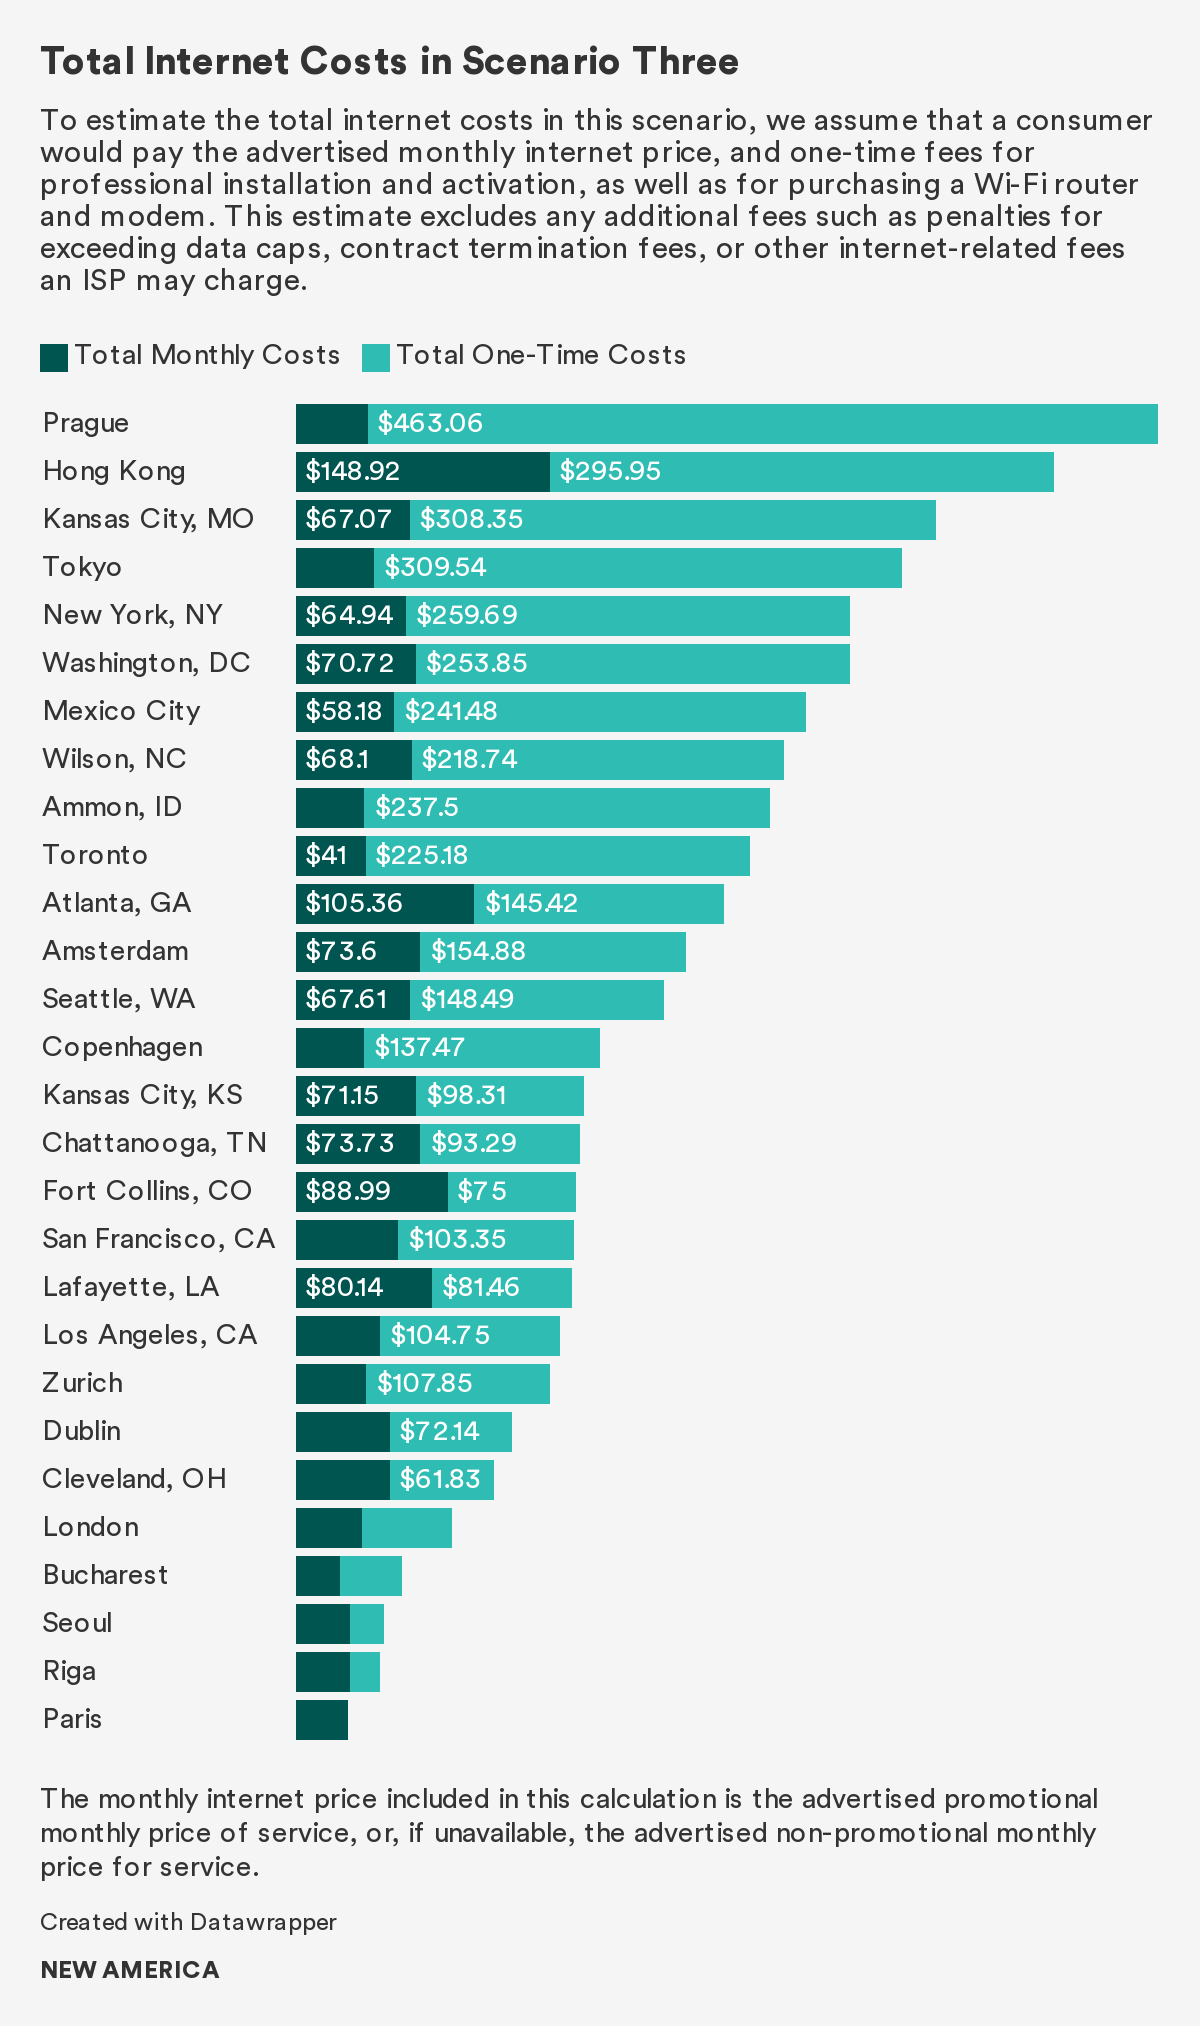
In the third and fourth scenarios, consumers pay a monthly average of $68.38 in the United States, $44.71 in Europe, and $62.41 in Asia.
If consumers opt for professional installation, they pay an average one-time cost of $223.40 in the United States, $251.80 in Europe, and $401.68 in Asia. These one-time costs include professional installation, activation, modem, and Wi-Fi router purchase fees. Assuming consumers commit to a provider for a year, they pay on average $1,044.10 in the United States, $788.32 in Europe, and $1,150.60 in Asia for total internet costs annually if they choose to purchase equipment and opt for professional installation. In this scenario, U.S. consumers pay 32 percent more than European consumers.
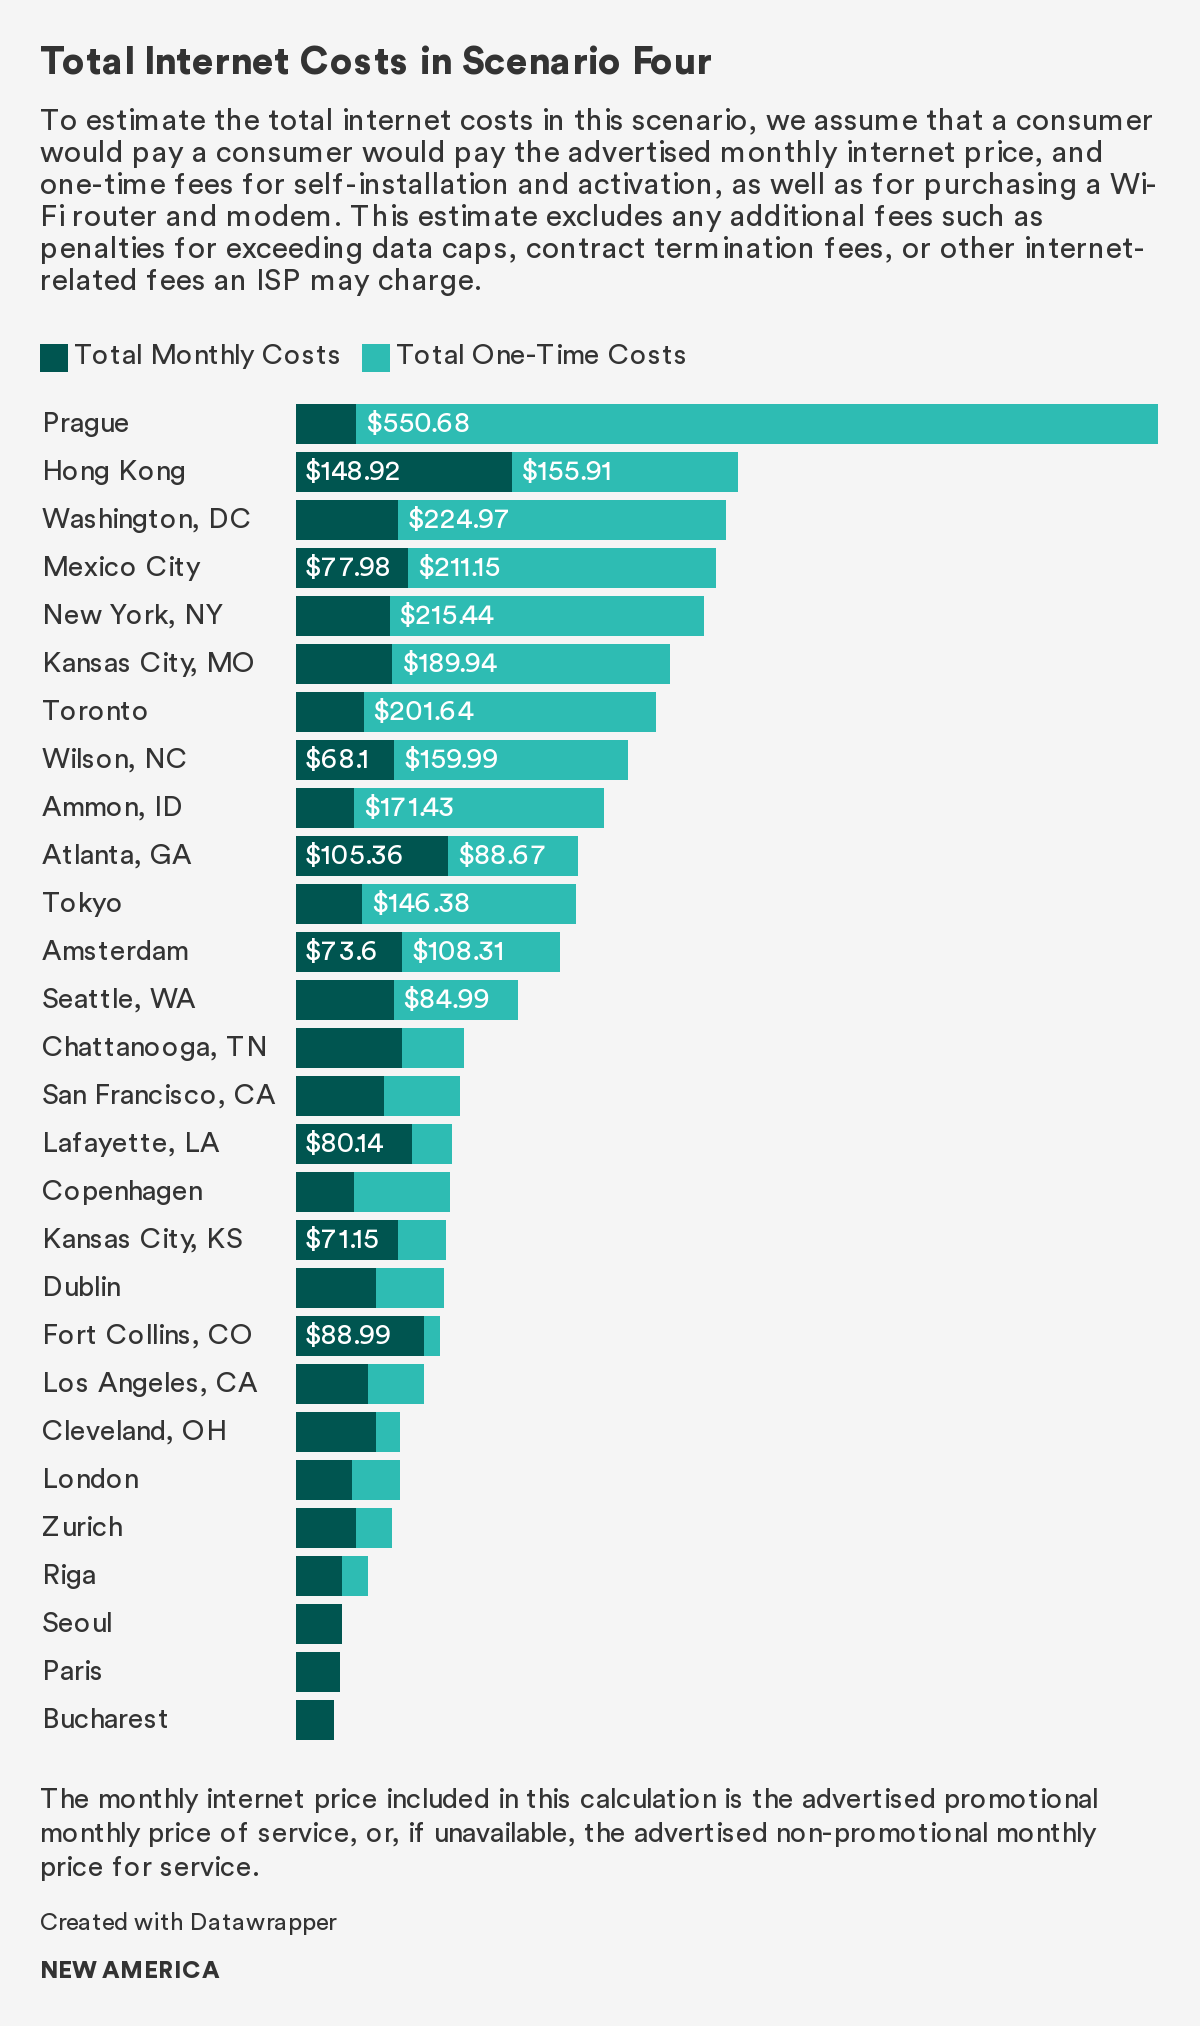
If consumers opt for self-installation, they pay an average one-time cost of $162.46 in the United States, $231.60 in Europe, and $302.30 in Asia.48 These one-time costs include self-installation, modem, and Wi-Fi purchase fees. Assuming consumers commit to a provider for a year, they pay $983.02 in the United States, $768.12 in Europe, and $1,051.22 in Asia for average total internet costs annually if they choose to purchase equipment and opt for self-installation. U.S. consumers in this scenario on average pay 22 percent more than European consumers.
Based on the cost differences across these four permutations of installation and equipment options, consumers in the United States and Asia generally benefit from cost savings if they choose to purchase equipment instead of renting it and if they choose self-installation instead of professional installation. ISPs, however, dictate whether these options are even available to consumers. Each ISP might not offer the option to purchase equipment or choose self-installation—and even when it is available, many consumers might choose the monthly rental option because it is cheaper in the short term than the large upfront cost of purchasing equipment. Nonetheless, though purchasing equipment may offer consumers long-term savings, there are also drawbacks, including that equipment offered by one provider may not be compatible with another provider’s network. We analyze each of these plan aspects independently in the “Focus on the Fees” section.
Prices Vary Across Network Technology
Monthly prices are consistently higher in the United States, regardless of network technology. Looking only at plans that relied on cable, DSL, and fiber technologies, we find that fiber is, on average, the most expensive internet option, followed by cable, then DSL.
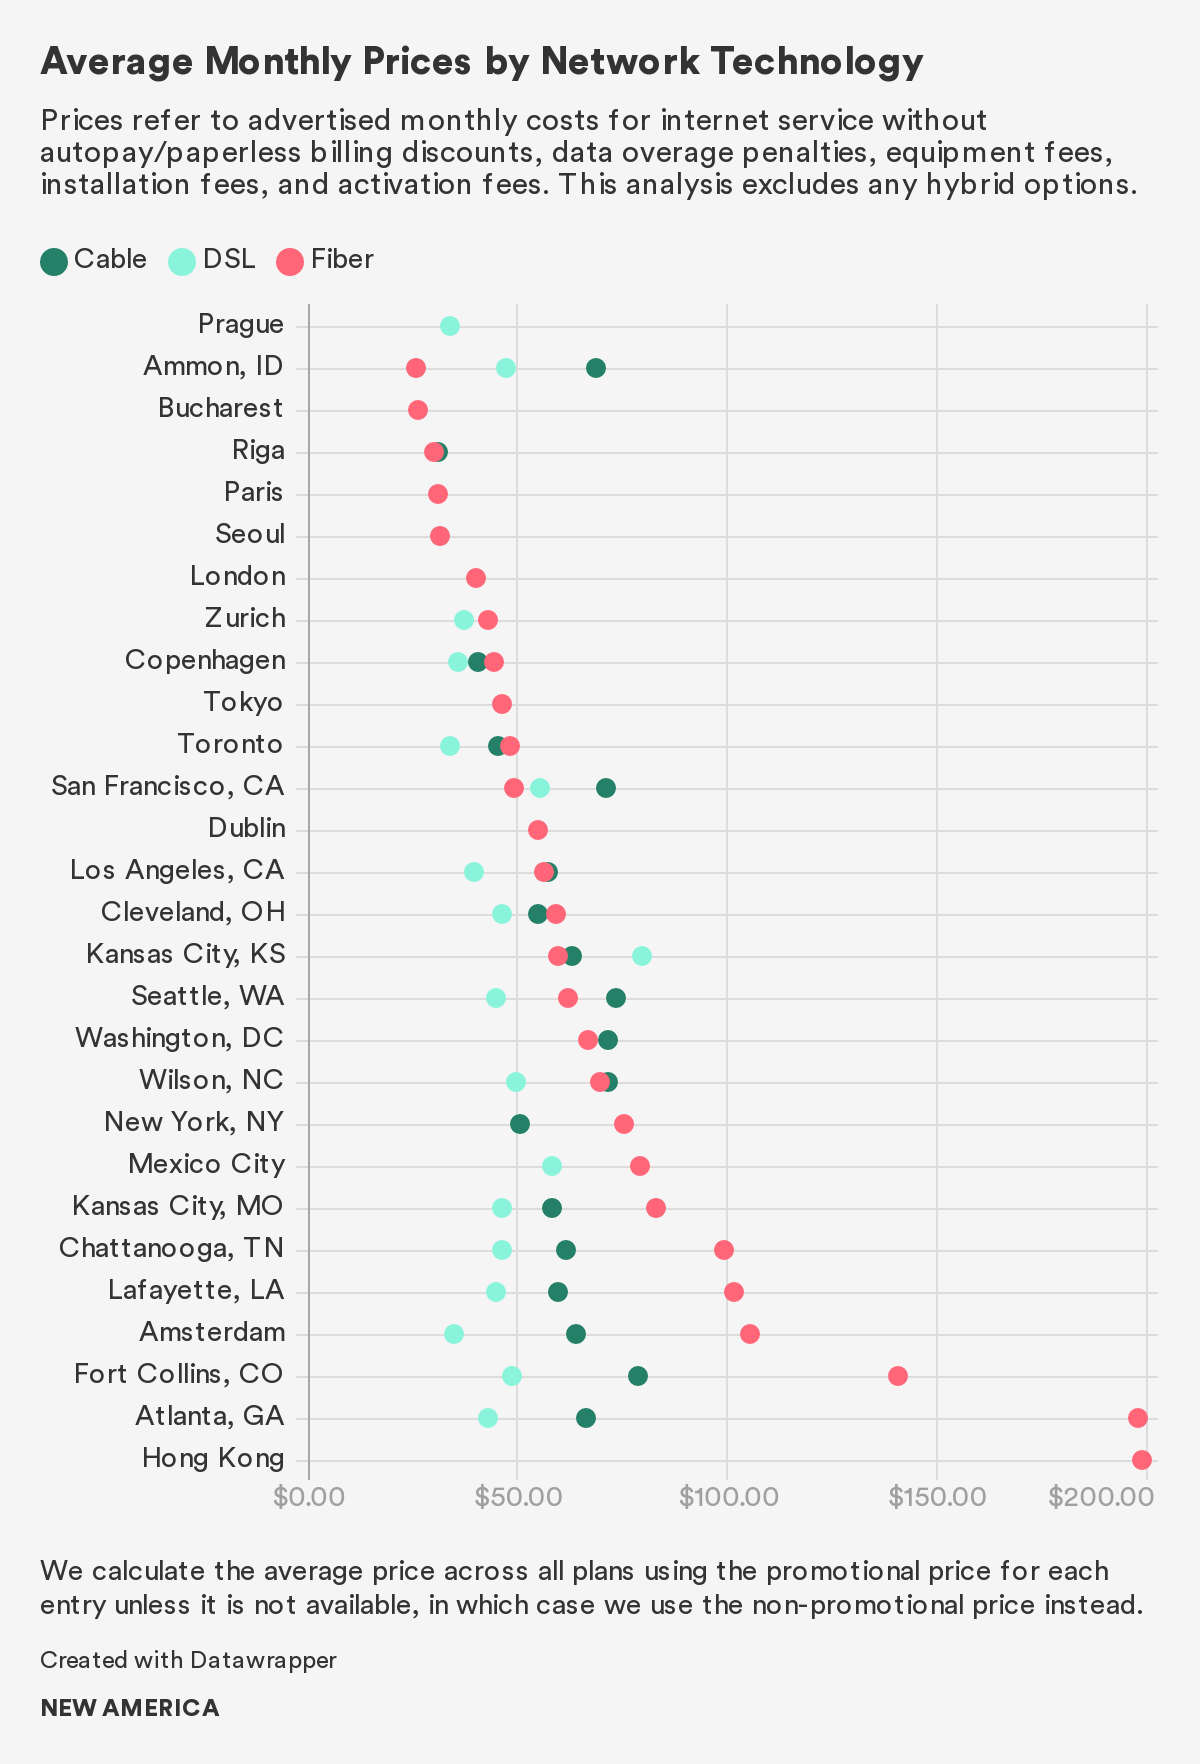
Advertised prices for DSL and cable plans are lower in Europe than in North America. The average price for a DSL plan in North America is $48.35, which is higher than the average price for DSL plans advertised in Europe, $35.53. The average price for DSL plans in the United States is $53.69, higher than both the North American and European averages. The average monthly price for a cable plan in North America is $60, compared to $41.45 in Europe. Cable plans advertised in the United States average $66.13 per month, again higher than the average price for cable plans in Europe. No cities in Asia within our dataset advertise DSL or cable plans.
Finally, for fiber-based plans, Europe has the most affordable average monthly price. The average European price for a fiber plan is $47.63, followed by Asia at $66.47. North America has the most expensive fiber-based plans with an average of $77.01. The average price for a fiber plan in the United States is $79.92, the third highest average for a fiber-based plan by country within our dataset. Bucharest advertises the lowest-priced fiber-based plans on average at $26.45, 44 percent of the average price for fiber plans in San Francisco, the U.S. city with the lowest average price for fiber-based service within our dataset.
These pricing trends generally align with penetration rates. Higher fiber prices appear to be associated with lower fiber penetration rates. As of 2019, fiber penetration in the United States falls below the average for countries that are part of the Organisation for Economic Co-operation and Development (OECD).49 Seven OECD countries within our dataset—Denmark, France, Japan, Latvia, Mexico, the Netherlands, and South Korea—have higher fiber penetration rates than the United States. South Korea has the highest penetration, with fiber accounting for 81.65 percent of all fixed broadband connections. Notably, countries where fiber makes up a greater percentage of fixed broadband advertise lower costs for fiber-based plans.50 In 2019, the OECD reported that cable accounted for 33.6 percent of all fixed broadband connections, and DSL-based fixed broadband service accounted for 35.0 percent.51 These penetration rates provide a general idea of how market shares are split among fiber, cable, and DSL options. We might expect prices for fiber-based plans to fall as more options for fiber-based plans become available, but researchers have highlighted how in many areas, providers have upgraded their infrastructure only if they face local competition.52
Advertised Prices are Highest in the United States
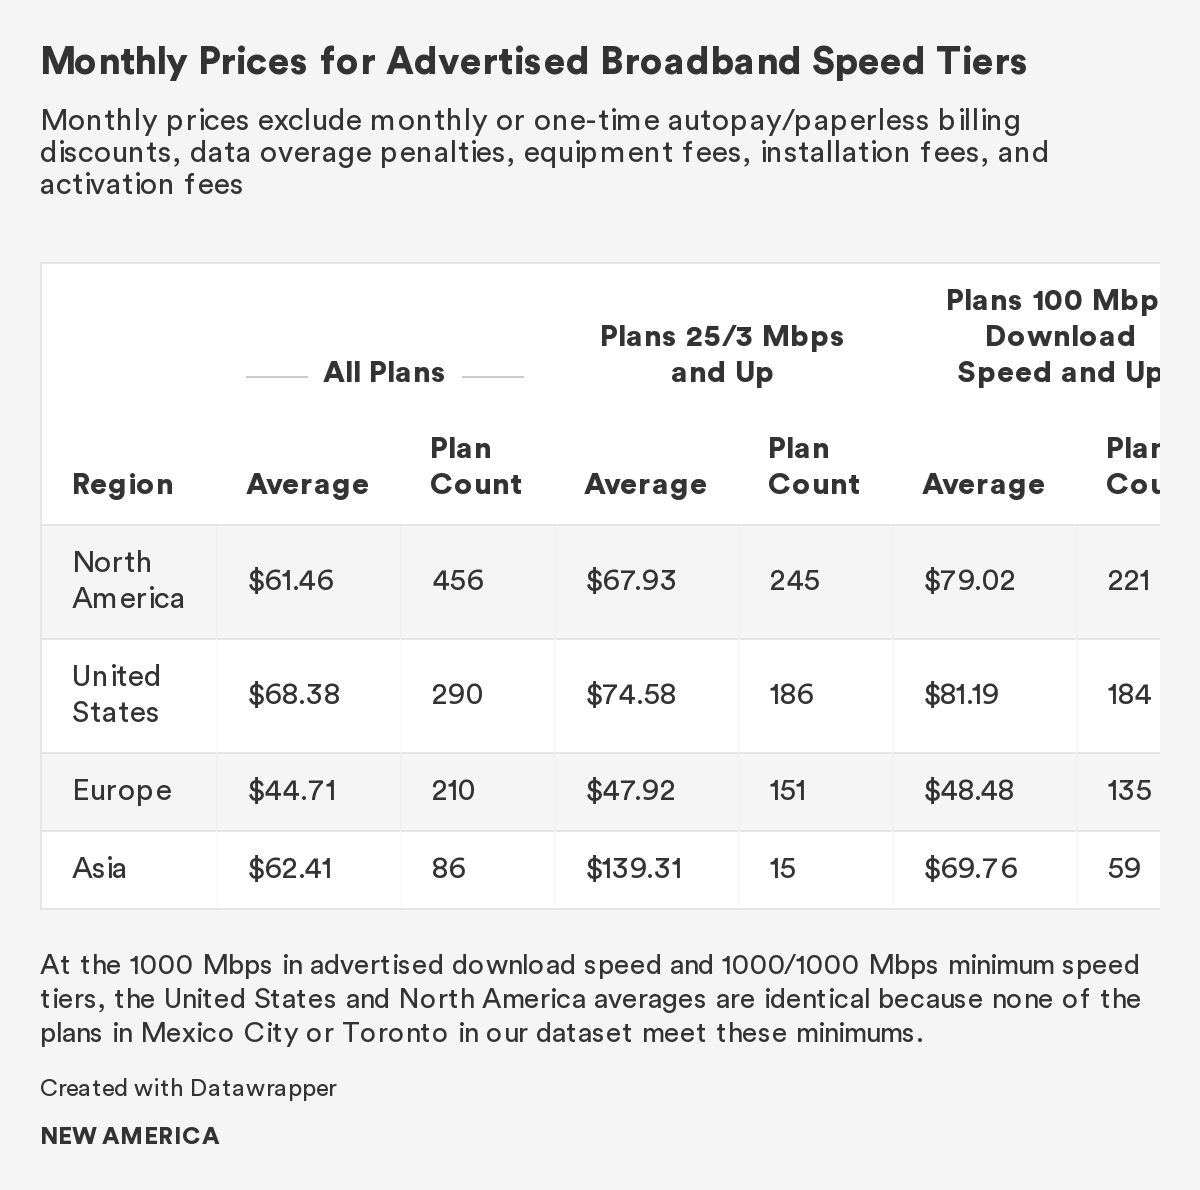
U.S. consumers pay the highest average costs out of any region in our dataset. The average monthly price in the United States is $68.38—higher than the average price for all of North America at $61.46, Europe at $44.71, and Asia at $62.41.53 The median price in the United States is $50, higher than the median price for all of North America at $49.99, Asia at $46.25, and Europe at $38.85.
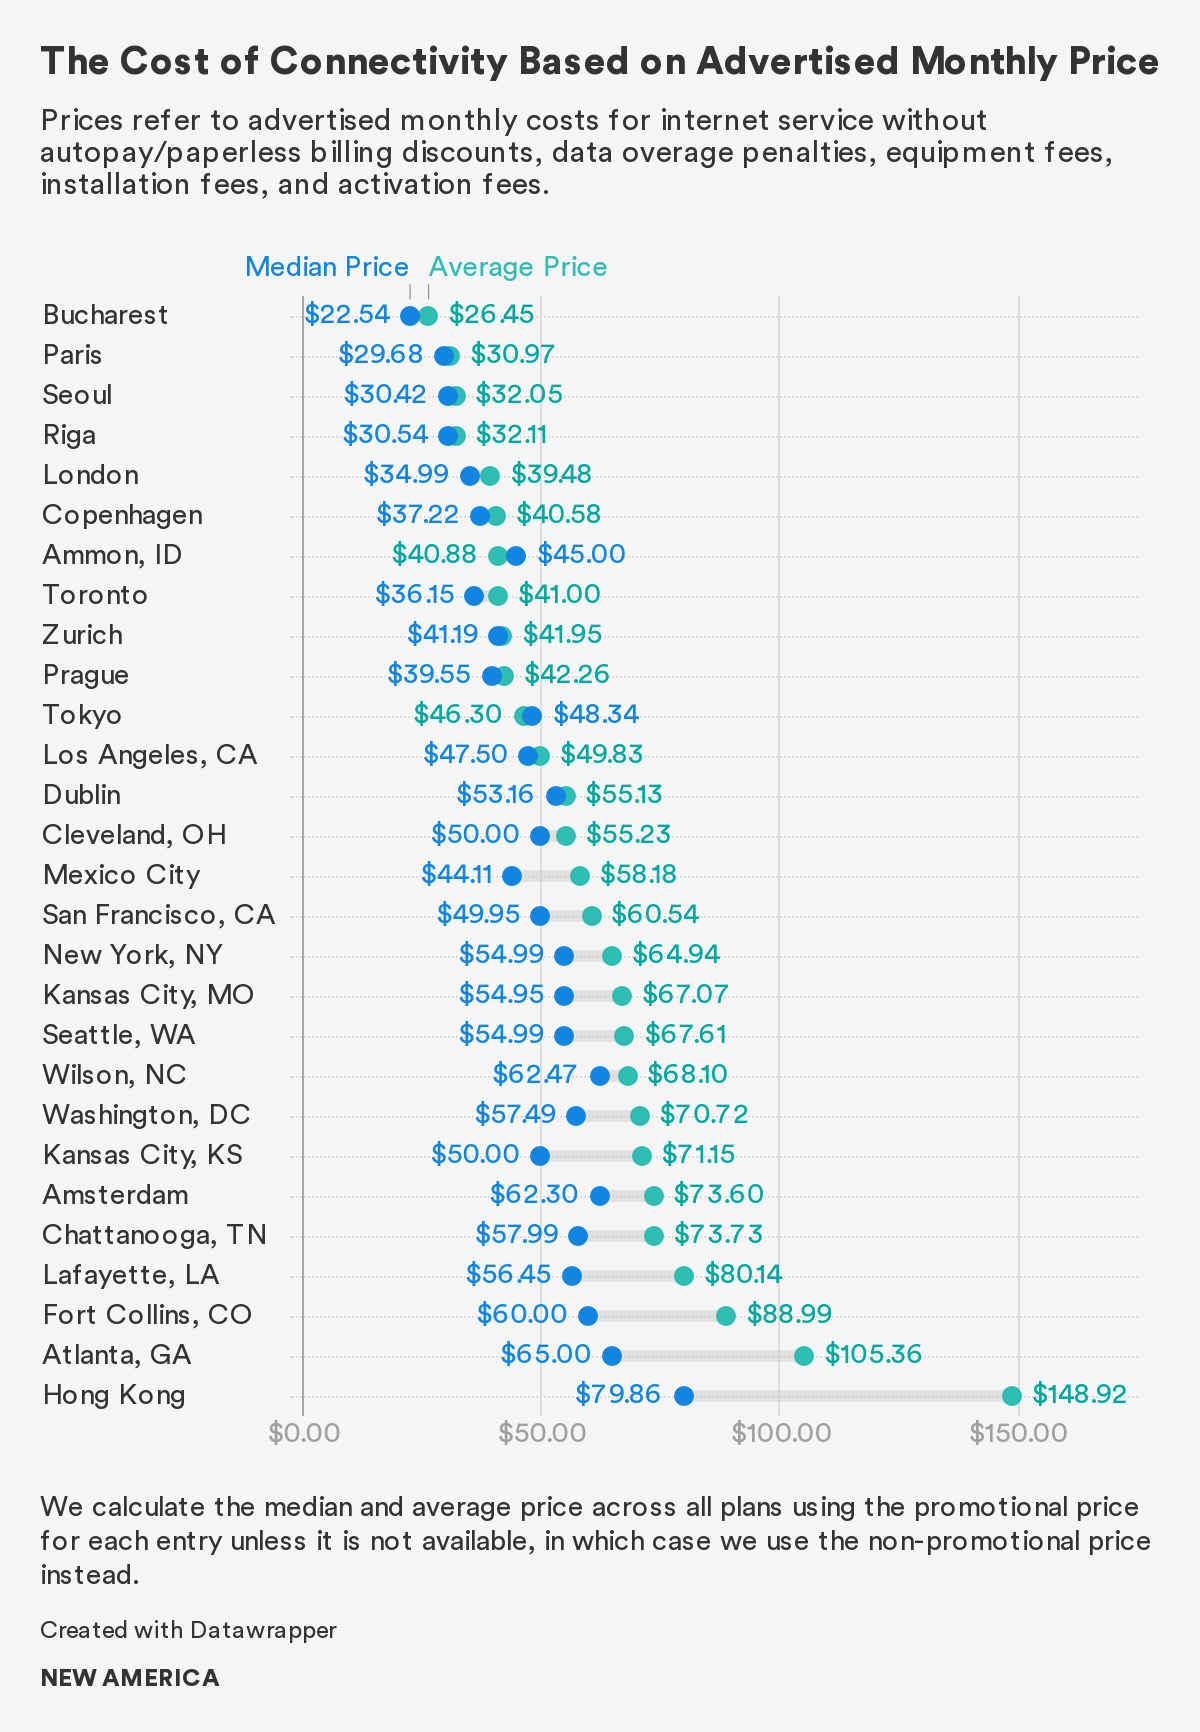
Based on our dataset, the most affordable average monthly prices are located in Asian and European cities. Just three U.S. cities rank in the top half of cities when sorted by average monthly costs. The most affordable U.S. city—Ammon, Idaho—ranks seventh. The overwhelming majority of the U.S. cities in our dataset rank in the bottom half for average monthly costs.
Notably, our study’s average U.S. price is higher than the $50 average found in the recent Cable.co.uk study, most likely because of the difference in sample sizes. The Cable.co.uk study only includes 27 U.S. internet plans, whereas ours looks at 290. However, our study’s U.S. median, $50, is lower than the $66 median in a recent Wall Street Journal study.54 We can attribute this discrepancy to a difference in methodology: To calculate this number, the Wall Street Journal looked at reported costs from consumers’ bills, and included "internet-related fees" like equipment costs, bundled plans, and standalone internet plans, and a wider geographic range. In an attempt to compare closer equivalents, we combine our median price with the median monthly equipment rental fees. The median price and the median Wi-Fi router rental fee, $5, add up to $55, and the median monthly price and the median modem rental fee, $13, add up to $63. If we compare the latter number with the Wall Street Journal’s median price finding, our numbers are only $3 apart.
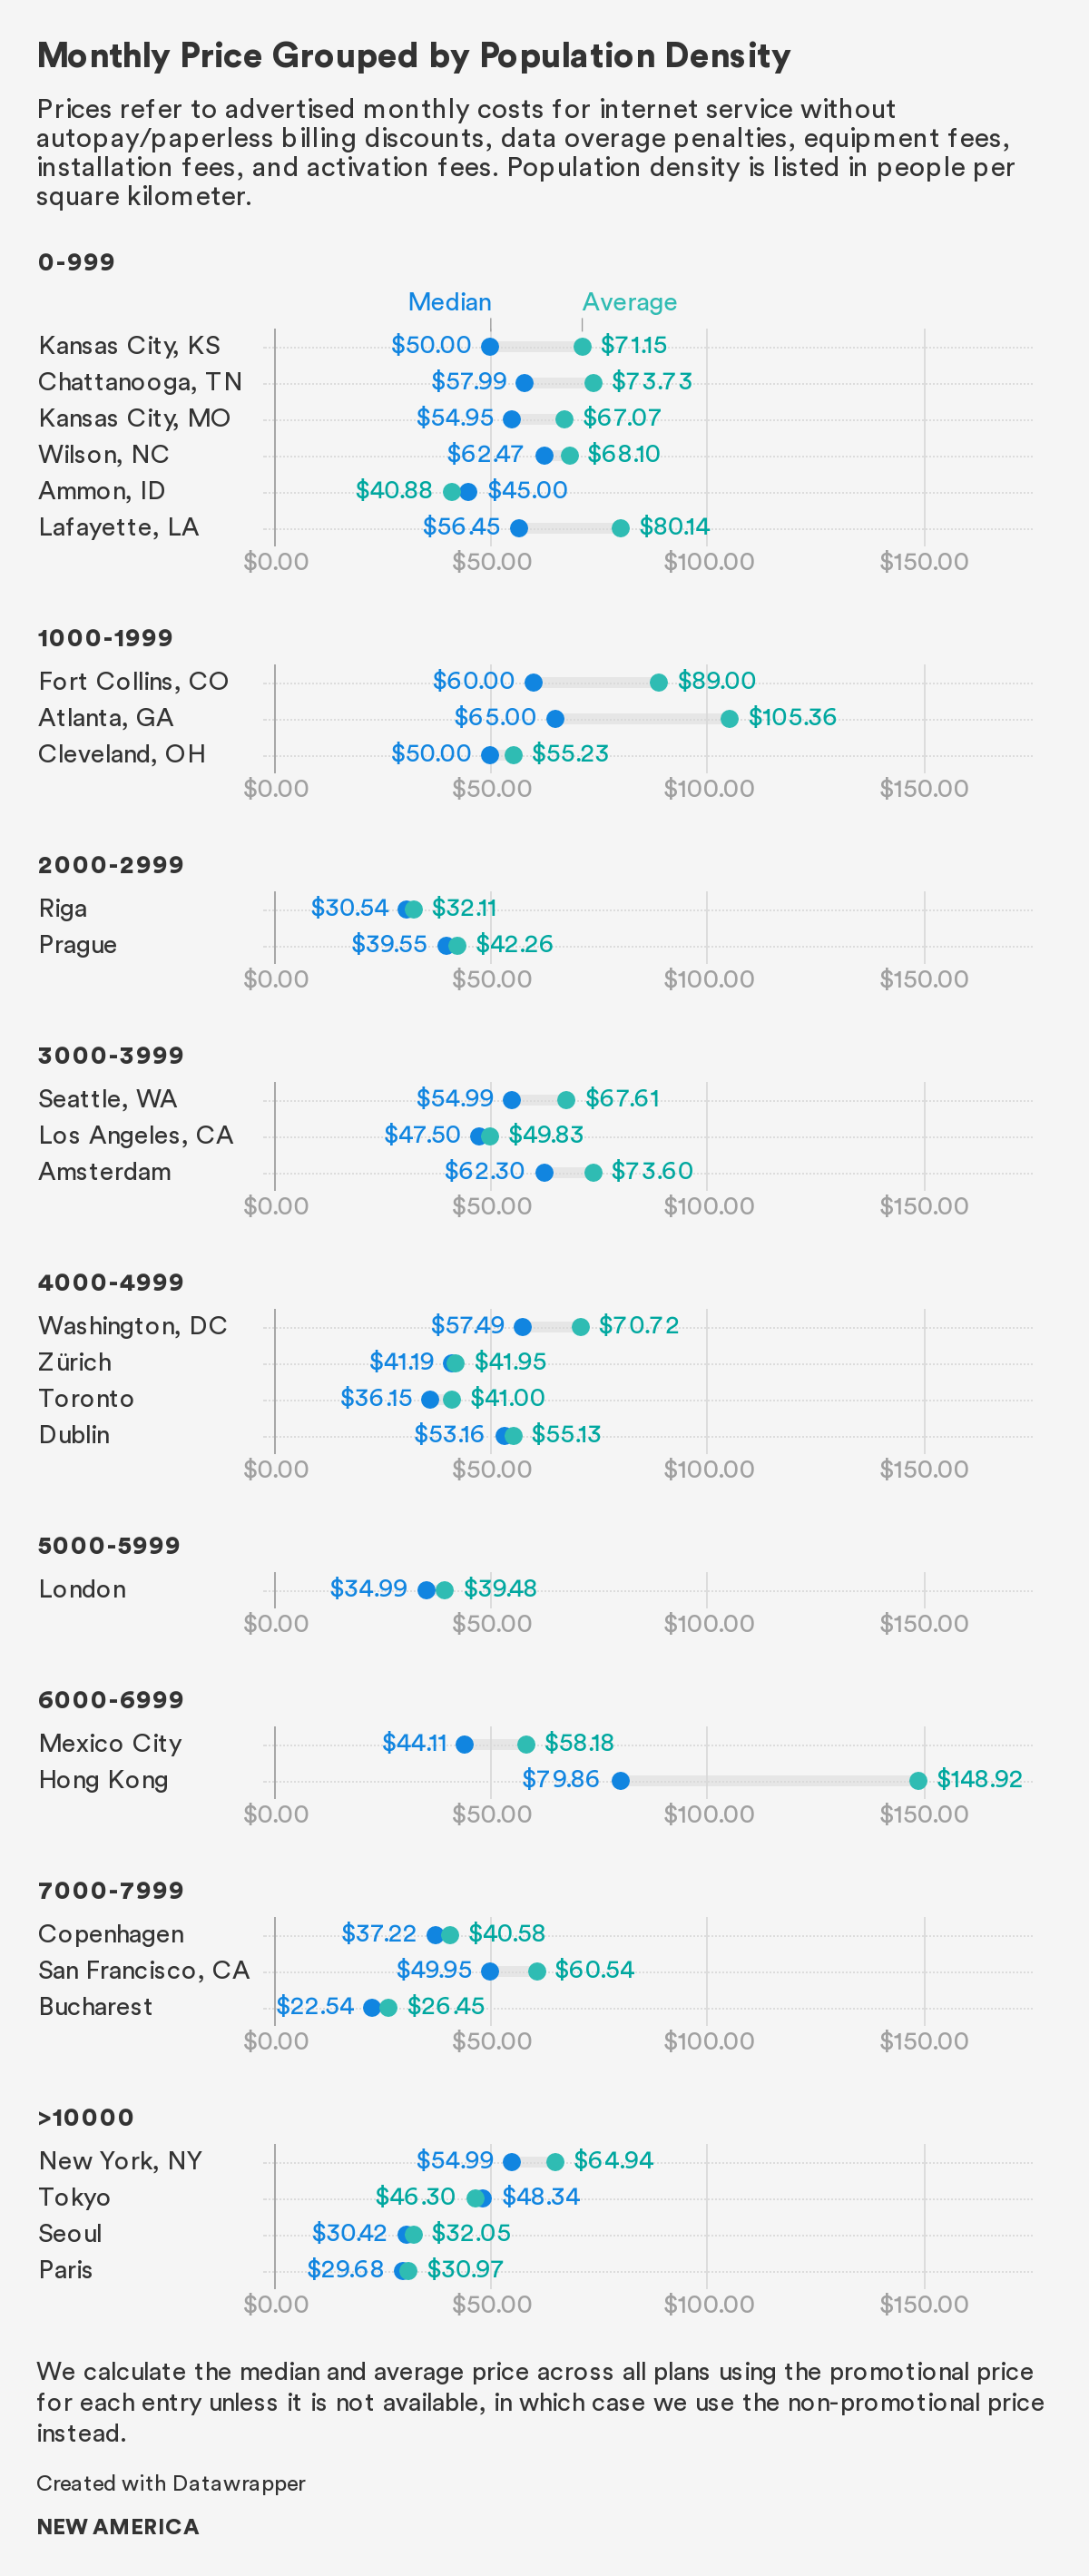
When we control for differences in population densities, we find that cities in the United States generally offer more expensive options compared to cities abroad. We compare cities within population density ranges in increments of 1,000 people per square kilometer, up until 10,000 people per square kilometer—at which point, we group the four cities that exceed this population density (New York, Tokyo, Paris, and Seoul) together. As the chart reveals, Dublin, Toronto, Washington, D.C., and Zurich all have similar population densities, but the average price is notably higher in Washington, D.C. Similarly, Bucharest, Copenhagen, and San Francisco have comparable population densities, but San Francisco’s median and average prices are the highest.55
Advertised Speeds are Highest in Asia
Comparing overall averages, Asian markets have the fastest advertised download and upload speeds, followed by those in the United States, then Europe.
Asian markets have the fastest average advertised download speeds at 713.43 Mbps. By comparison, the U.S. average is 482.77 Mbps, whereas the overall average for all North American cities in our dataset is 336.80 Mbps. The U.S. median is significantly slower, however; at 150 Mbps, it indicates that some U.S. consumers have slower advertised download speeds than the average might suggest. In fact, because the dataset of advertised download speeds is skewed to the right, the median speeds are more representative of the majority of plans than the average in this particular scenario. The U.S. median and average are faster than Europe’s, which are 100 and 230.72 Mbps respectively.
Asia also leads on advertised upload speeds at 713.33 Mbps.56 By comparison, the U.S. average is 354.02 Mbps, which is higher than the average for all North American cities in our dataset, 249.82 Mbps. The U.S. median, however, is 15 Mbps, which indicates that some U.S. consumers have slower advertised upload speeds than the average might suggest. Because the dataset of advertised upload speeds is skewed to the right, the median speeds are more representative of the majority of plans than the average in this particular scenario. The U.S. average is faster than Europe’s at 138.29 Mbps. By median advertised upload speeds, Asia leads with 500 Mbps, followed by Europe at 40 Mbps, and the United States at 15 Mbps.
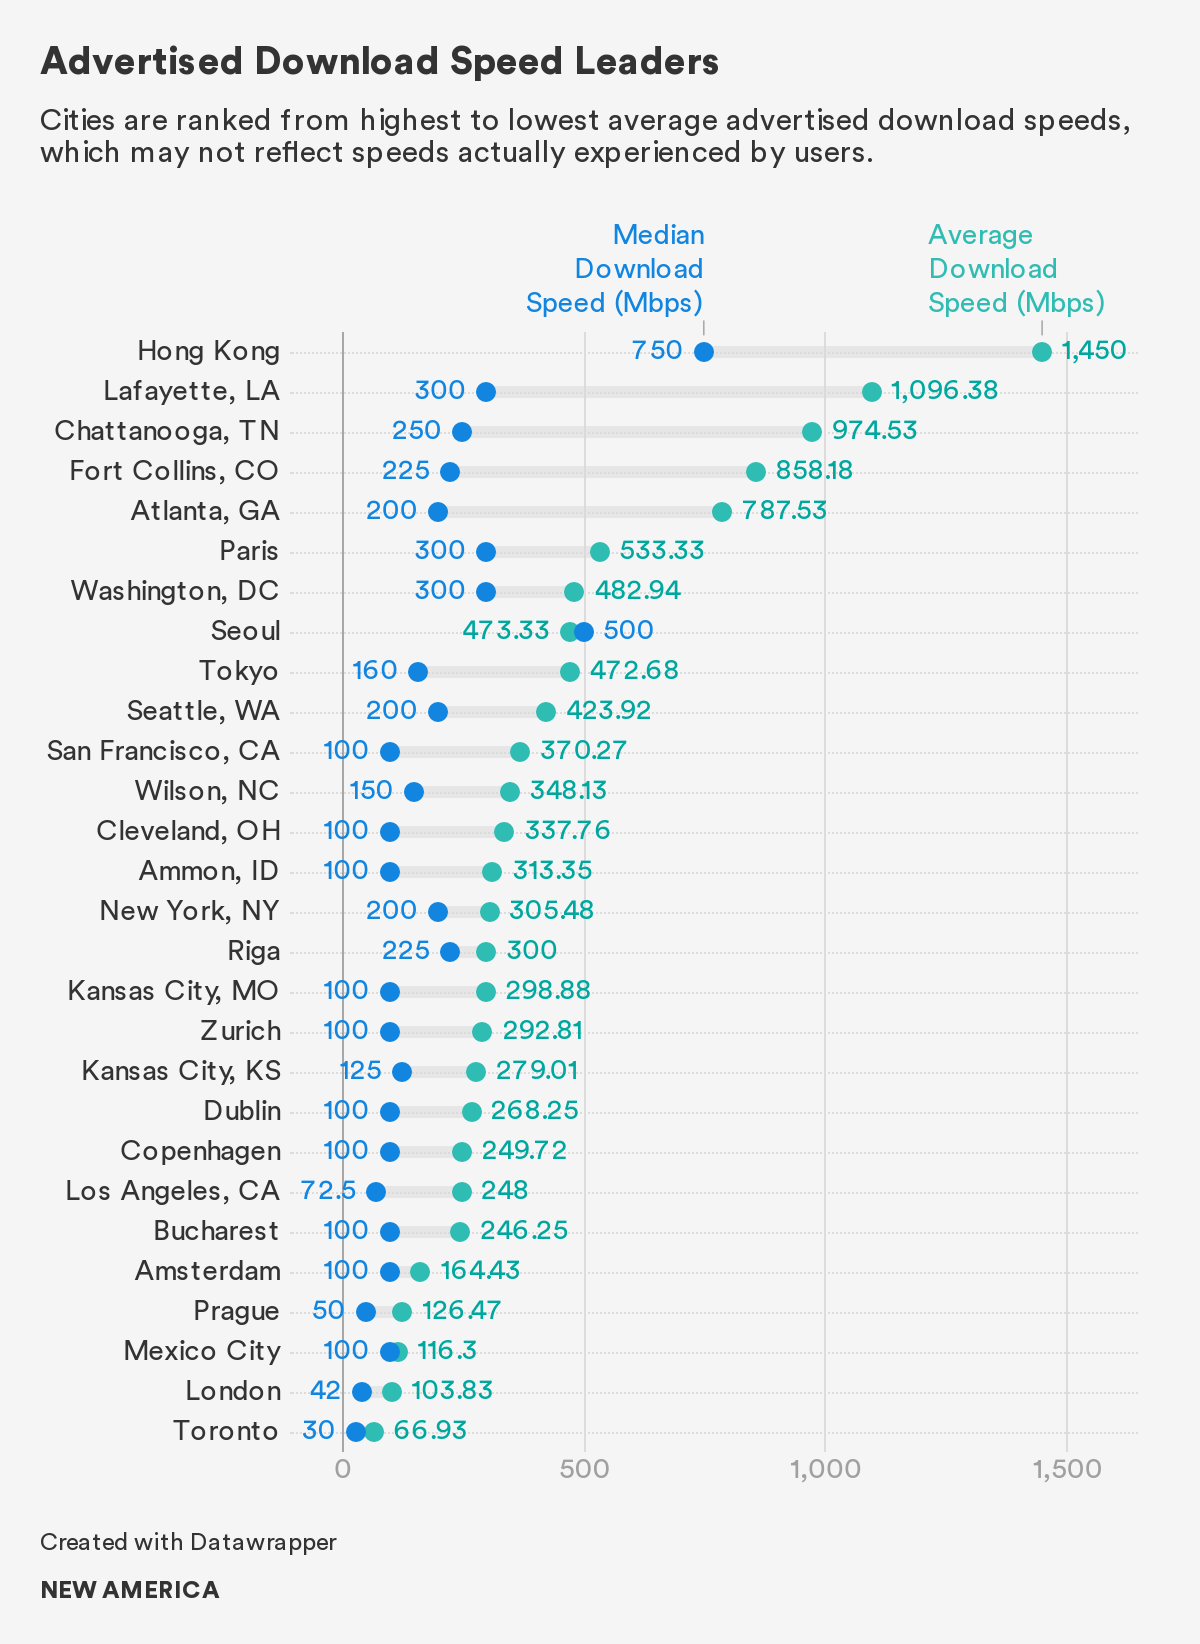
Ranking cities by average advertised download and upload speeds shows that while an international city leads the board on download speed, some U.S. cities are not far behind the fastest download speeds advertised by providers in international cities—and on average advertised upload speeds, a U.S. city leads the board. While Hong Kong leads the board on advertised download speed with an average of 1,450 Mbps, the next four cities in the top five are all U.S. cities: Lafayette, La., Chattanooga, Tenn., Fort Collins, Colo., and Atlanta. The former three U.S. cities all offer municipal network options. The fastest of the three, Lafayette, La., however, comes in at an average advertised download speed of 1096.38 Mbps behind Hong Kong, nearly 25 percent less.
While Hong Kong leads the board on advertised download speed with an average of 1,450 Mbps, the next four cities in the top five are all U.S. cities: Lafayette, La., Chattanooga, Tenn., Fort Collins, Colo., and Atlanta.
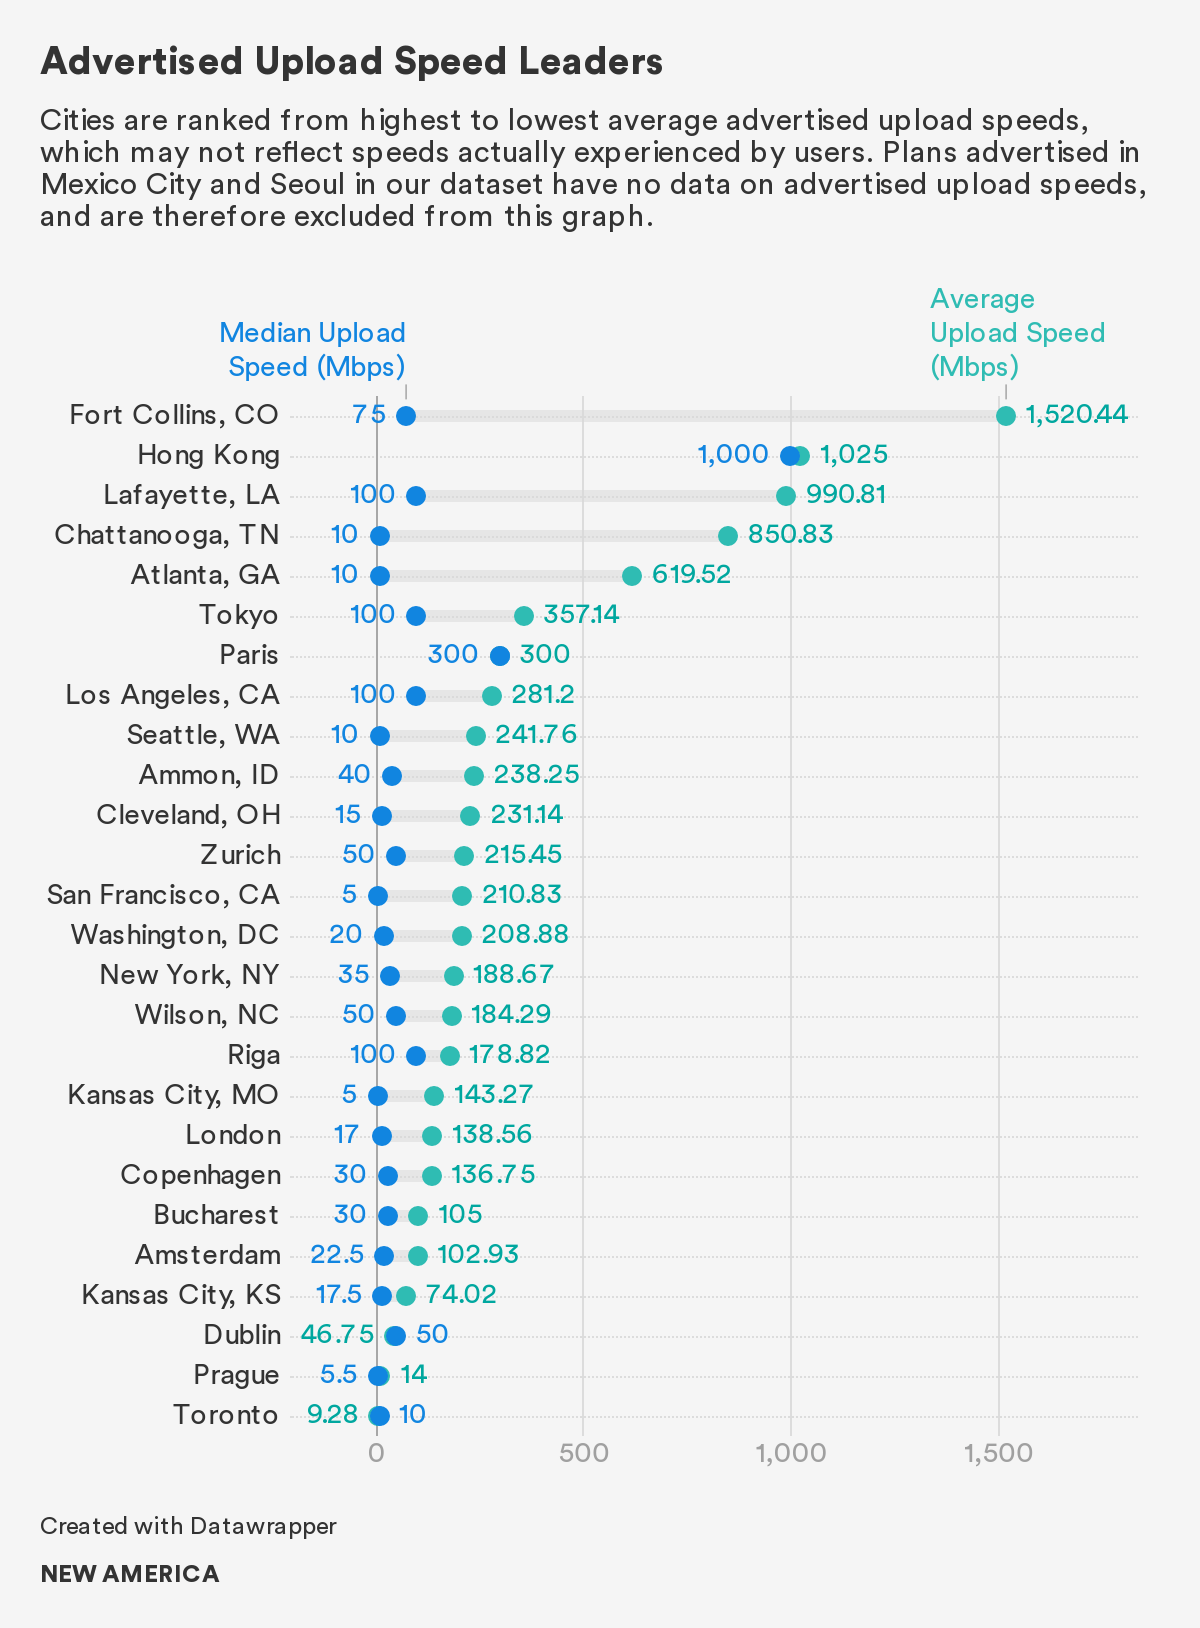
On advertised upload speed, Fort Collins leads the board with an average speed of 1520.44 Mbps, 496.44 Mbps more than Hong Kong. After Hong Kong, Lafayette, La., Chattanooga, Tenn., and Atlanta round up the top five in average advertised upload speeds.
Asia Leads on Cost-for-Speed Value
In this section, we standardize for differences in advertised speeds by examining the relationship between cost and advertised download speed. We take the average monthly price divided by average advertised download speed to calculate the average price per Mbps that ISPs advertise in each city. This analysis is our best approximation of cost at comparable speeds, but it is limited by the reality that advertisements may not reflect the actual price that a consumer pays or the speeds that they experience.57 We are also unable to standardize for other variables, including ancillary fees, data caps, and upload speeds.
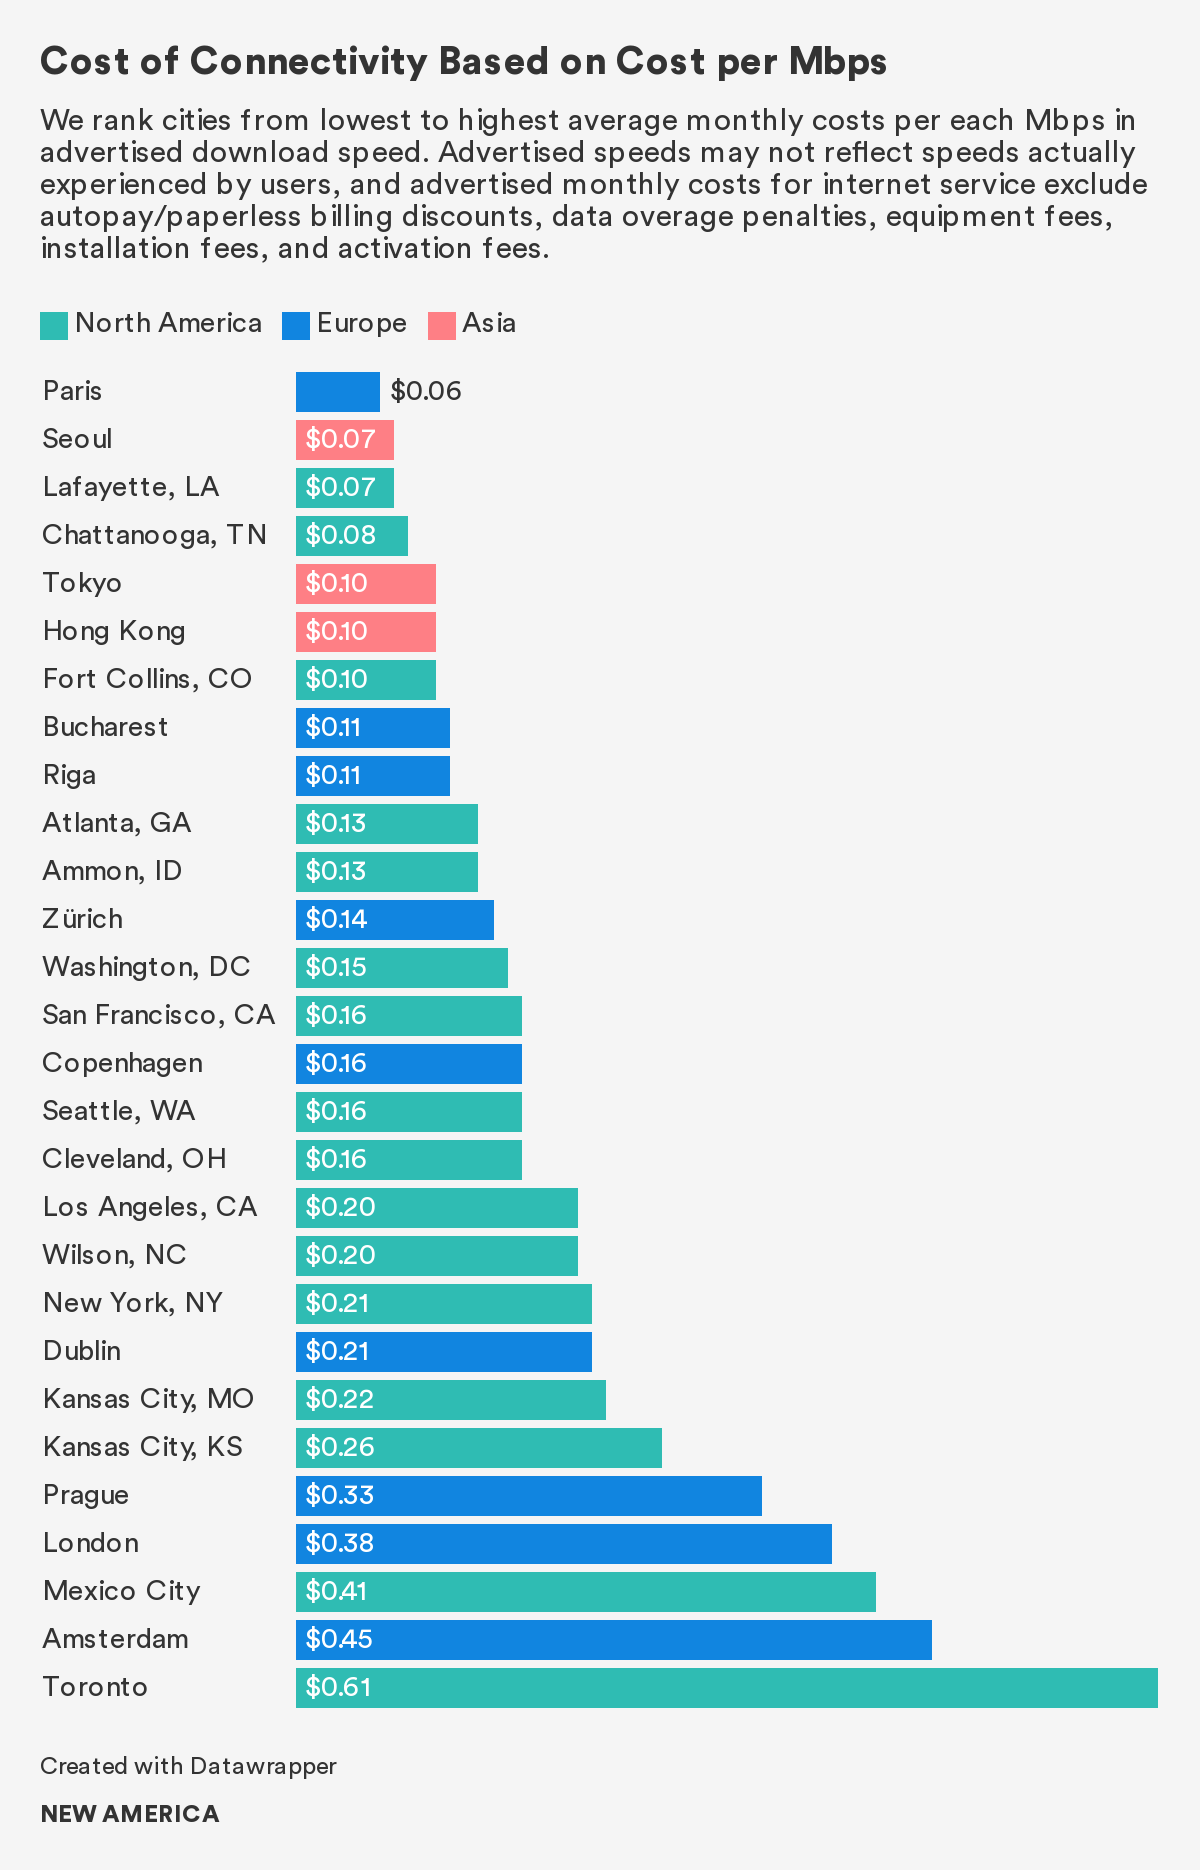
Examining the relationship between monthly prices and speeds based on advertised metrics reveals that Asian providers advertise the lowest costs for comparable speed. U.S. consumers pay $0.14 on average for each Mbps in advertised download speed, which is less than the overall North American average at $0.18 and the European average at $0.19. Consumers in Asia, however, get the most value by far—they pay just $0.09 for each Mbps in advertised download speed on average.
Standardizing for price differences across advertised download speeds shows that Lafayette, La., offers as much value on average as Seoul. Chattanooga, Tenn. is only a penny behind Lafayette and Seoul by this metric. By the same metric, Fort Collins, Colo. is on par with both Tokyo and Hong Kong.
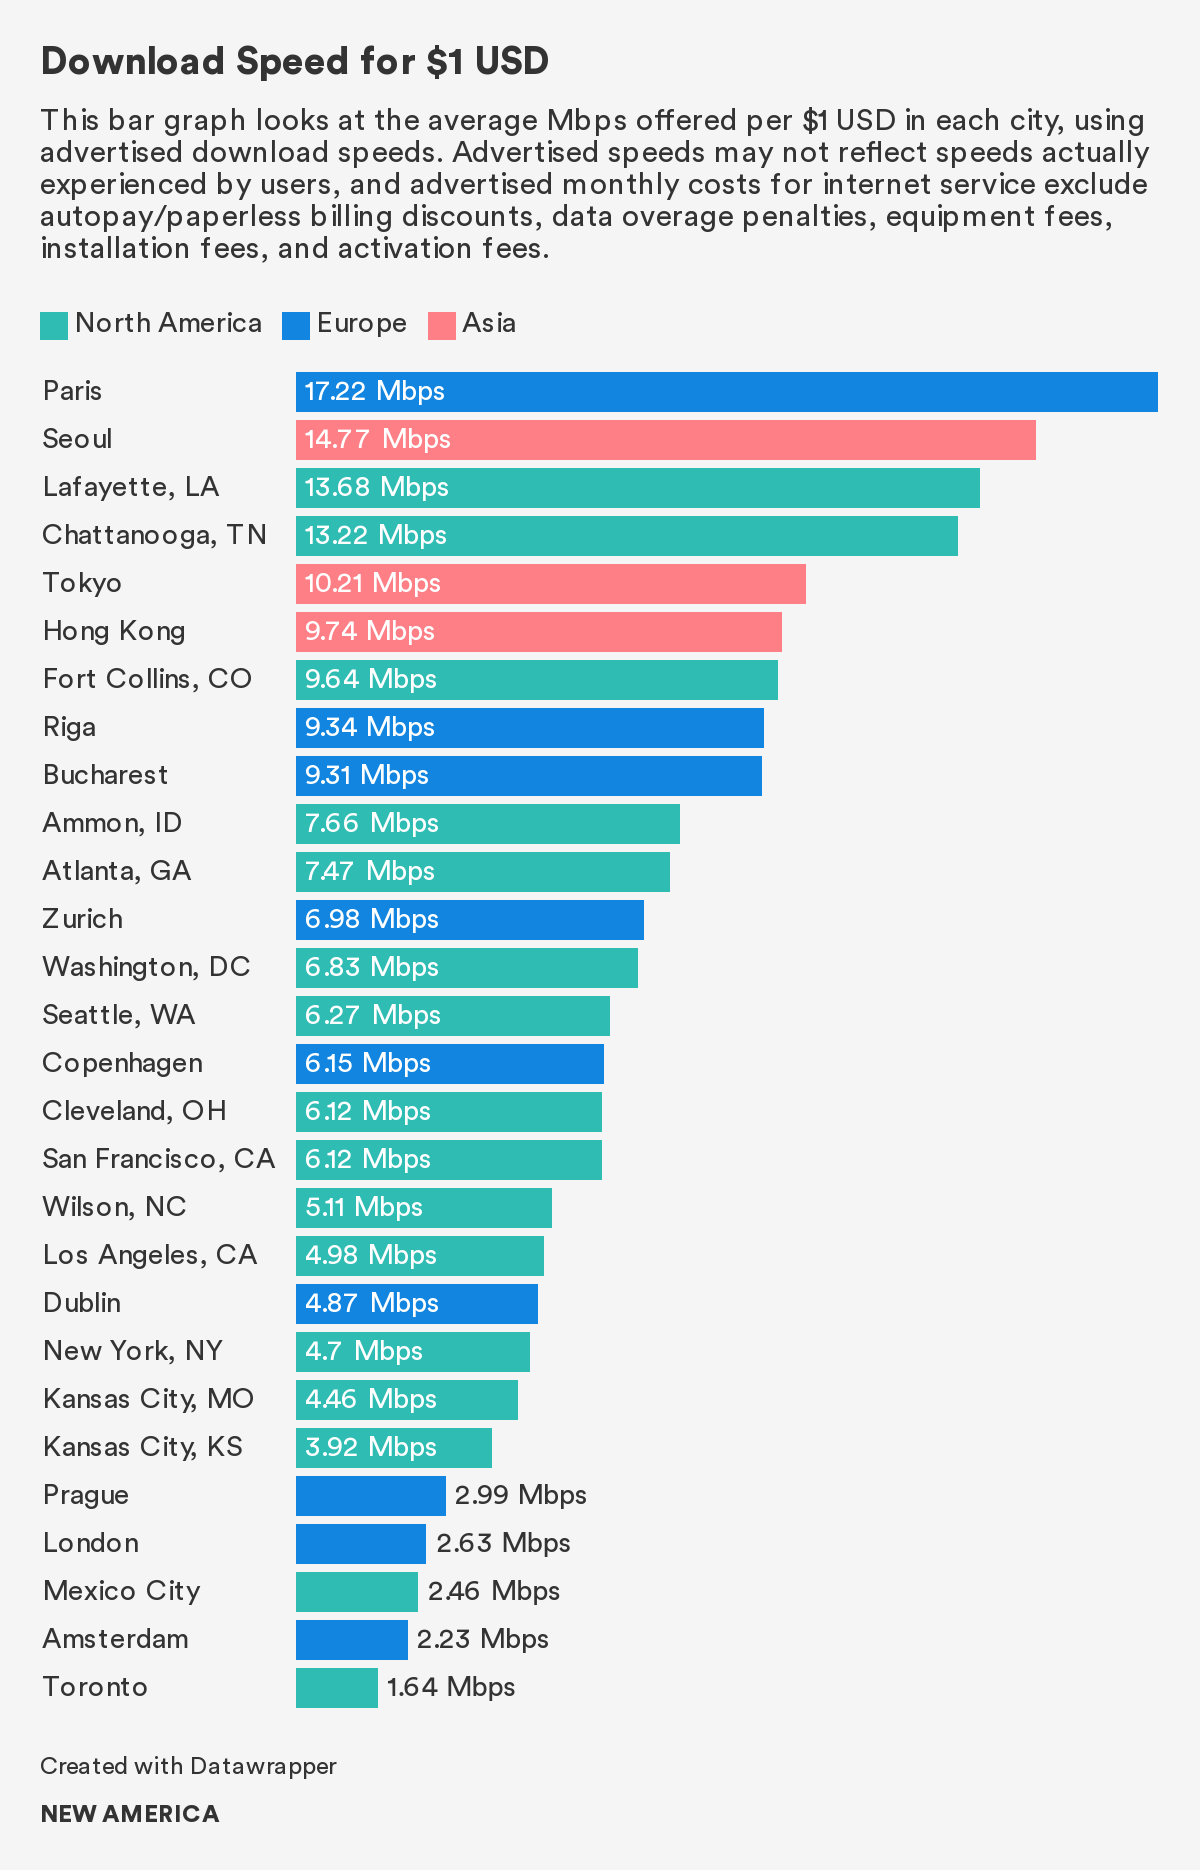
Looking at the average Mbps offered per $1 USD using advertised download speeds in each city, Paris and Seoul lead the board at 17.22 and 14.77 Mbps respectively. Chattanooga, Tenn. and Lafayette, La. are close behind, however, and Tokyo rounds out the top five speed leaders. That Chattanooga and Lafayette are so close to Paris and Seoul in terms of average download speeds advertised for $1 demonstrates the value that municipal networks can bring to communities.
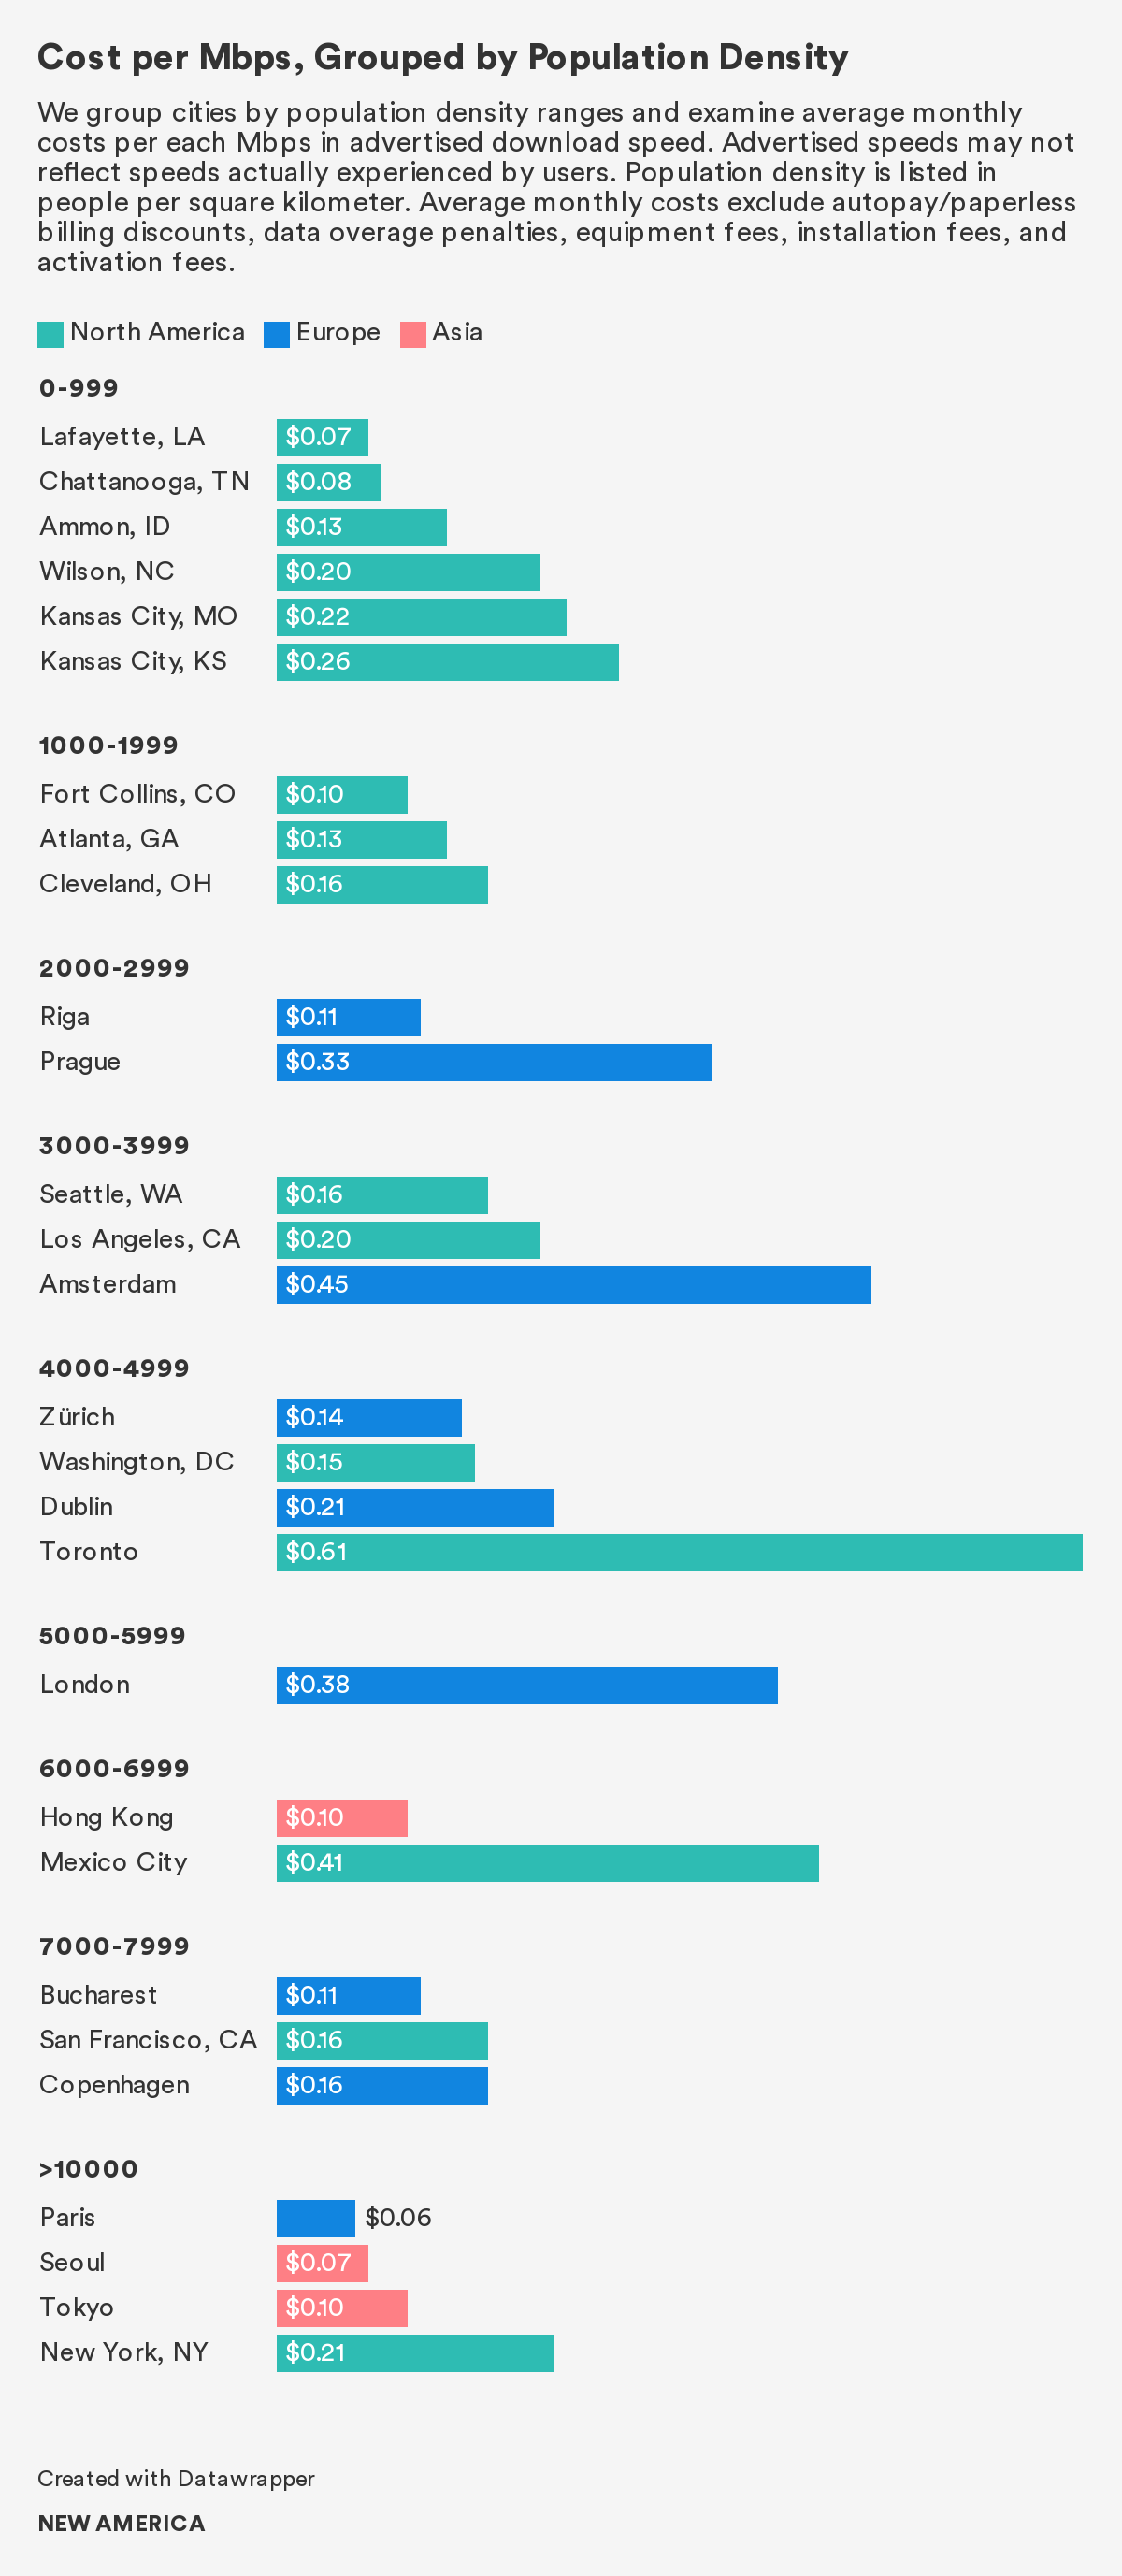
However, standardizing costs and speeds while also factoring in differences in population density reveals that U.S. providers on average advertise similar prices for similar speeds as European providers. For example, Washington, D.C. is almost on par with Zurich, with only a penny’s difference in average advertised costs per Mbps between the two comparably dense cities. Similarly, Bucharest, Copenhagen, and San Francisco all average advertised costs per Mbps within a five-cent range.
Europe Leads in Broadband Affordability
In this section, we examine monthly prices at advertised speeds that meet minimum broadband tiers to determine a measure of affordability. This analysis reveals that, on average, broadband access is most affordable in Europe. This finding generally holds when we examine the average monthly price for plans that meet 25/3 Mbps, 100 Mbps download, 100/100 Mbps, 1,000 Mbps download, and 1,000/1,000 Mbps minimum advertised speeds—all various benchmarks that have emerged in the U.S. broadband policy context.58 Many advocates have called to raise the minimum broadband definition to 100 or 1,000 Mbps download benchmarks, both of which OTI supports.59 Symmetrical download and upload speeds are also important because users are often content creators, too.60 We look at each of these benchmarks to understand how affordability changes within each minimum speed tier.
Europe consistently leads with the most affordable average monthly price within each minimum speed tier. Depending on the speed tier, either Asia or the United States has the most expensive average price.
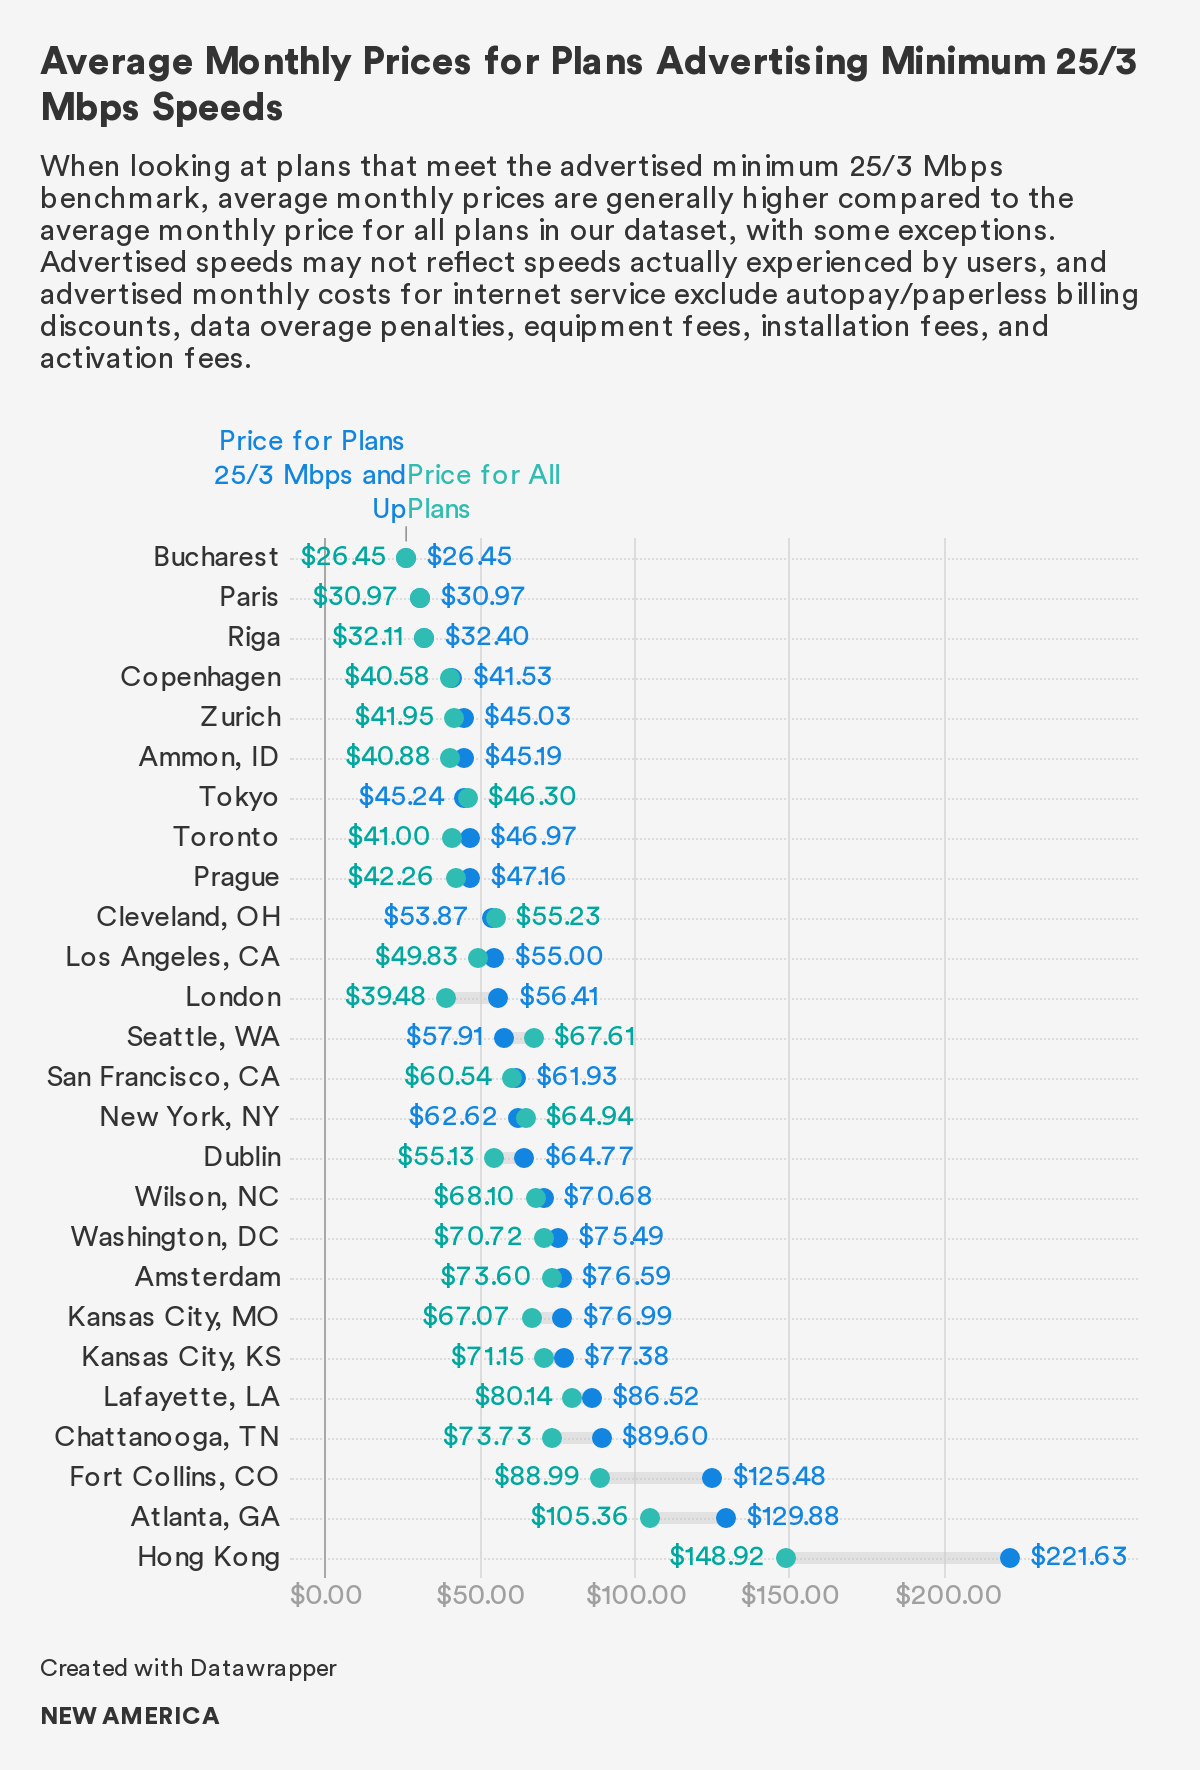
At the 25/3 Mbps minimum benchmark, Europe has the most affordable average monthly price, followed by the United States and Asia. The top five most affordable cities in this speed tier are all in Europe. Eight out of 10 most expensive cities in our dataset are U.S. cities in the 25/3 Mbps minimum speed tier. Ammon, Idaho is the most affordable U.S. city in this speed tier, and it ranks sixth globally at $45.19—71 percent more than Bucharest's average monthly price at $26.45.
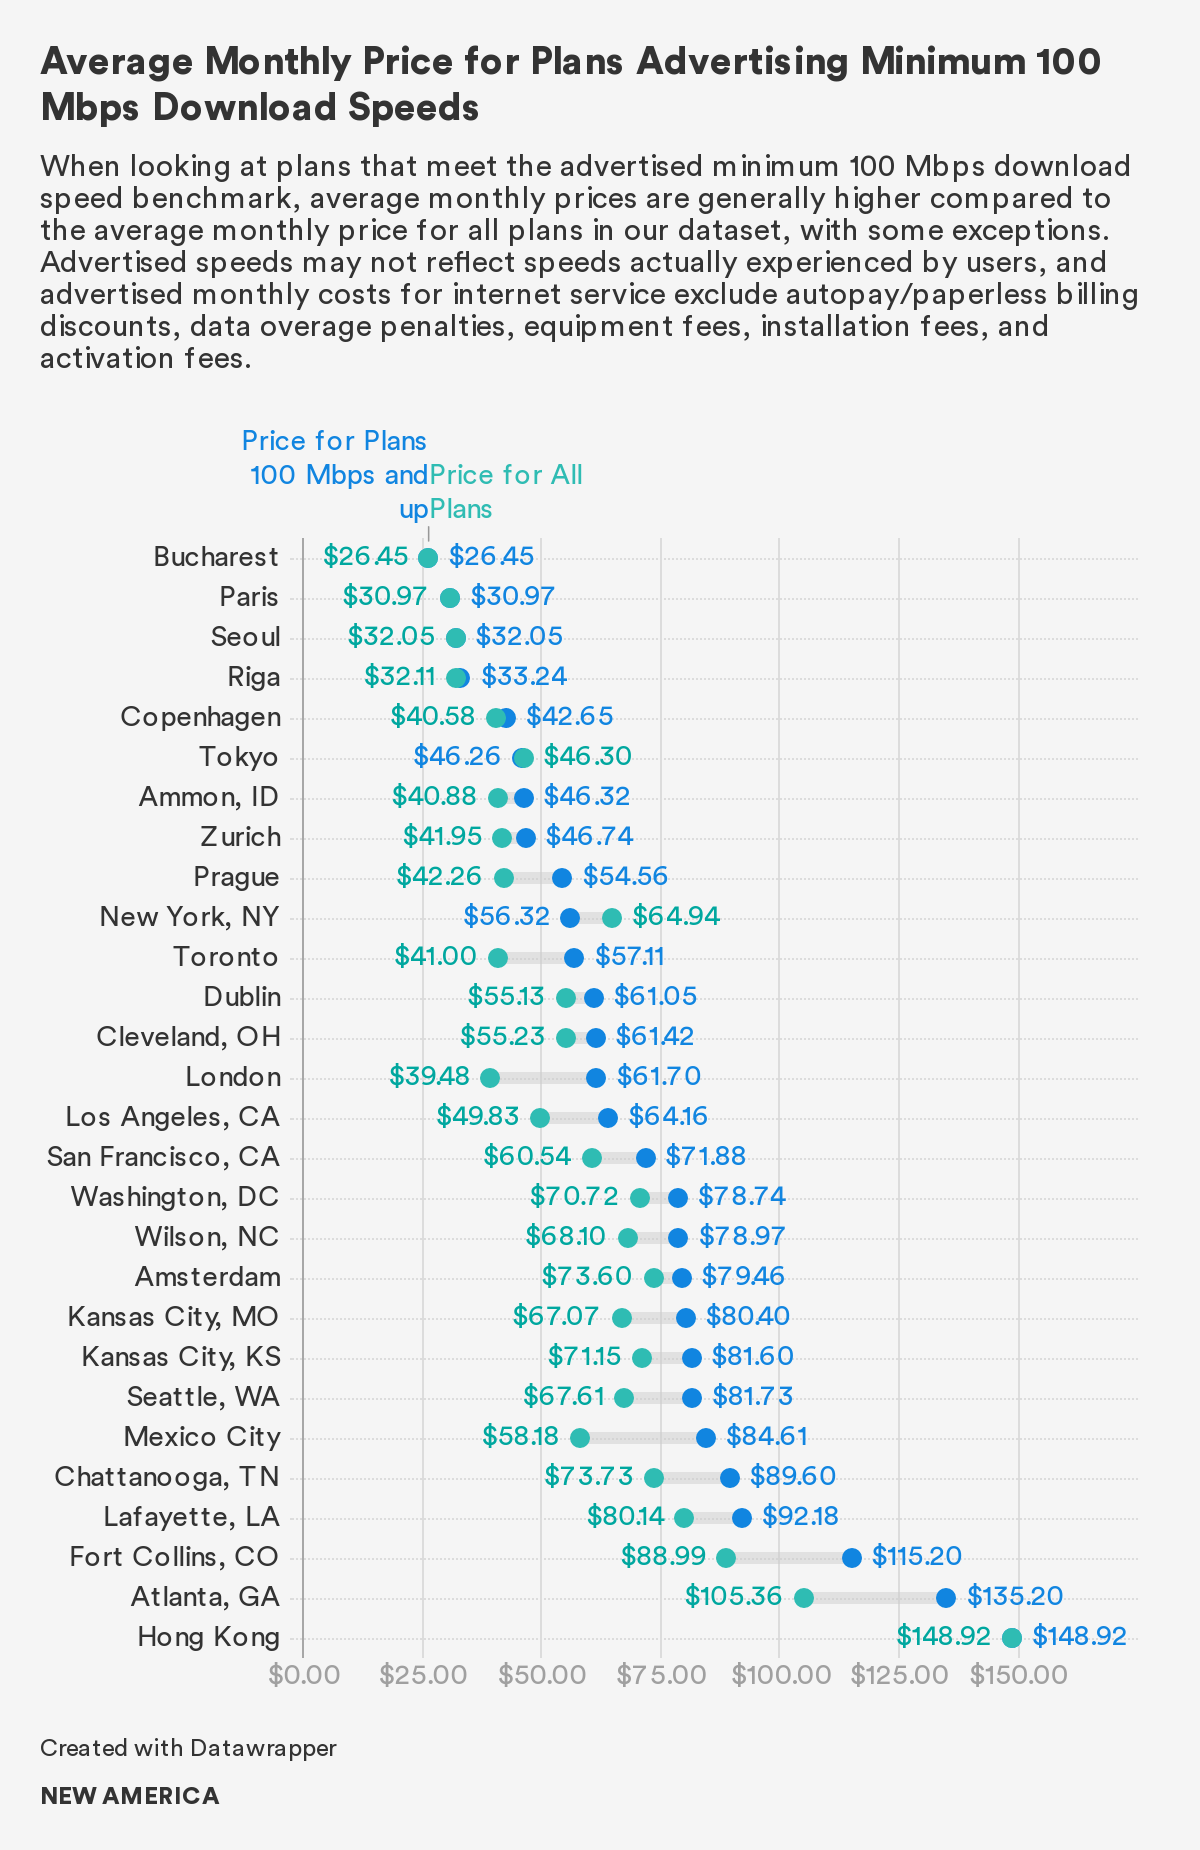
“When you factor in price at [100 Mbps] speed,” FCC Commissioner Jessica Rosenworcel has written, “the United States is not even close to leading the world.”61 Our findings support this statement. At the 100 Mbps minimum download speed tier, the United States has the most expensive average monthly price, followed by Asia and Europe. Eight of the 10 most expensive cities in this speed tier are in the United States.
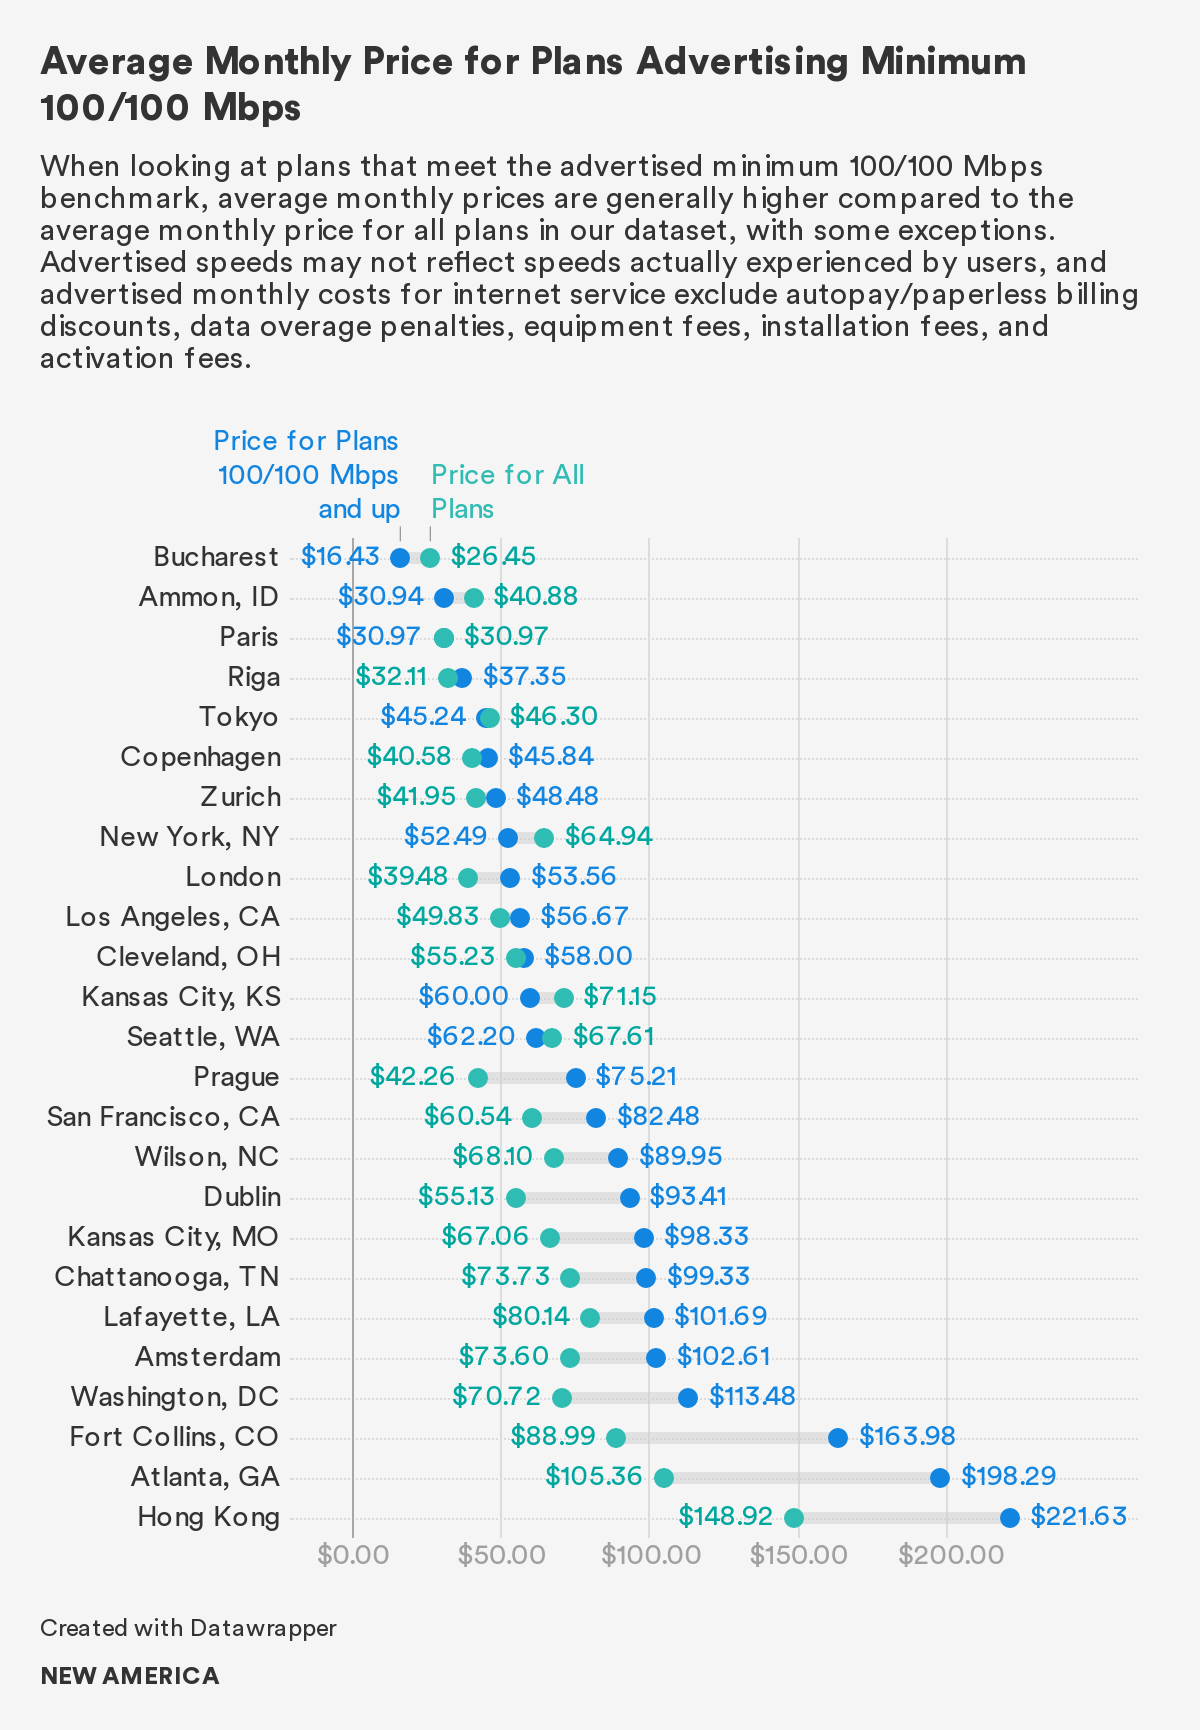
The United States trails in affordability at the 100/100 Mbps minimum speed tier, too. Six out of the 10 most expensive cities in this speed tier are U.S. cities. Only two cities in the top 10 most affordable cities are U.S. cities: New York, ranked eighth at $52.49, and Los Angeles, ranked 10th at $56.67. Compared to the most affordable city in this speed tier, Bucharest at $16.43, New York and Los Angeles are over twice as expensive. Asia is the most expensive on average, followed by the United States and Europe.
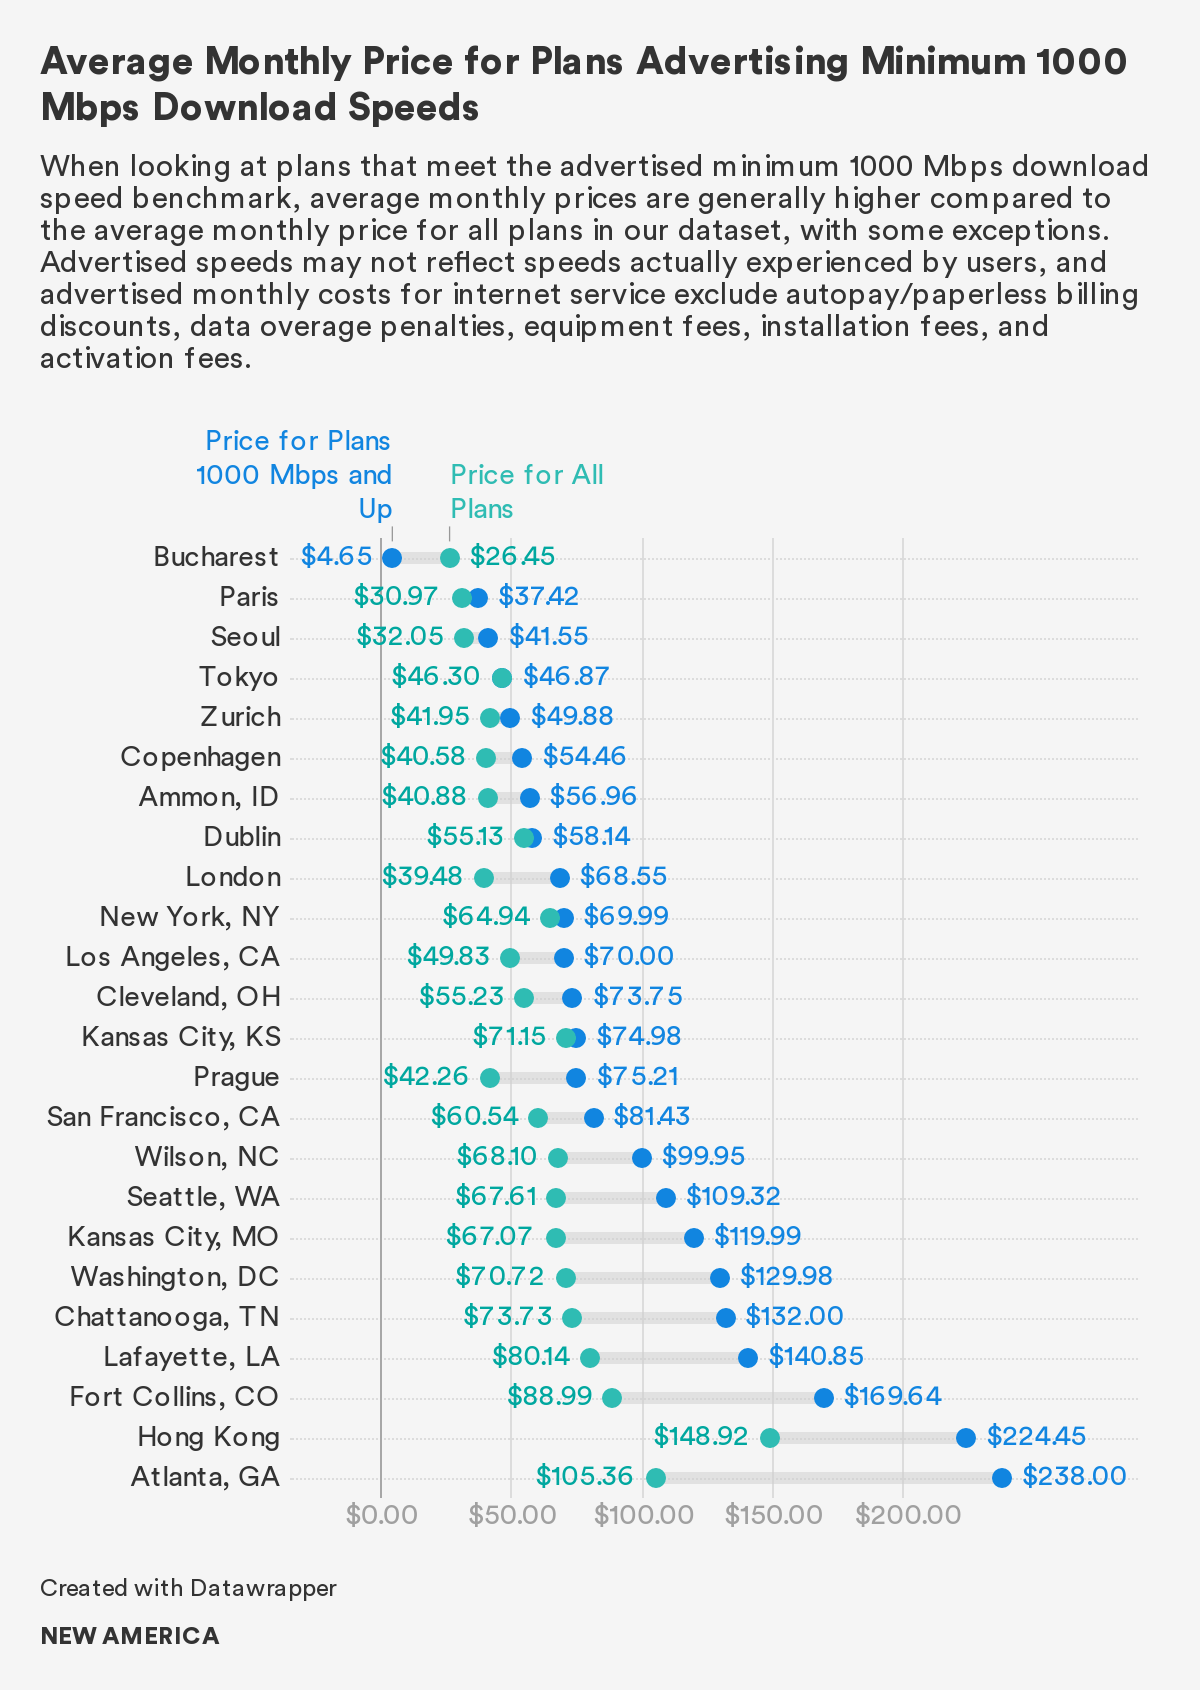
Comparing regions, Asia is the most expensive on average at the 1,000 Mbps minimum speed tier, followed by the United States and Europe. Comparing cities, however, nine of the 10 most expensive cities in this speed tier are U.S. cities; Atlanta tops the board at $238. Notably, Atlanta’s average is over 50 times more expensive than Bucharest’s at $4.65.
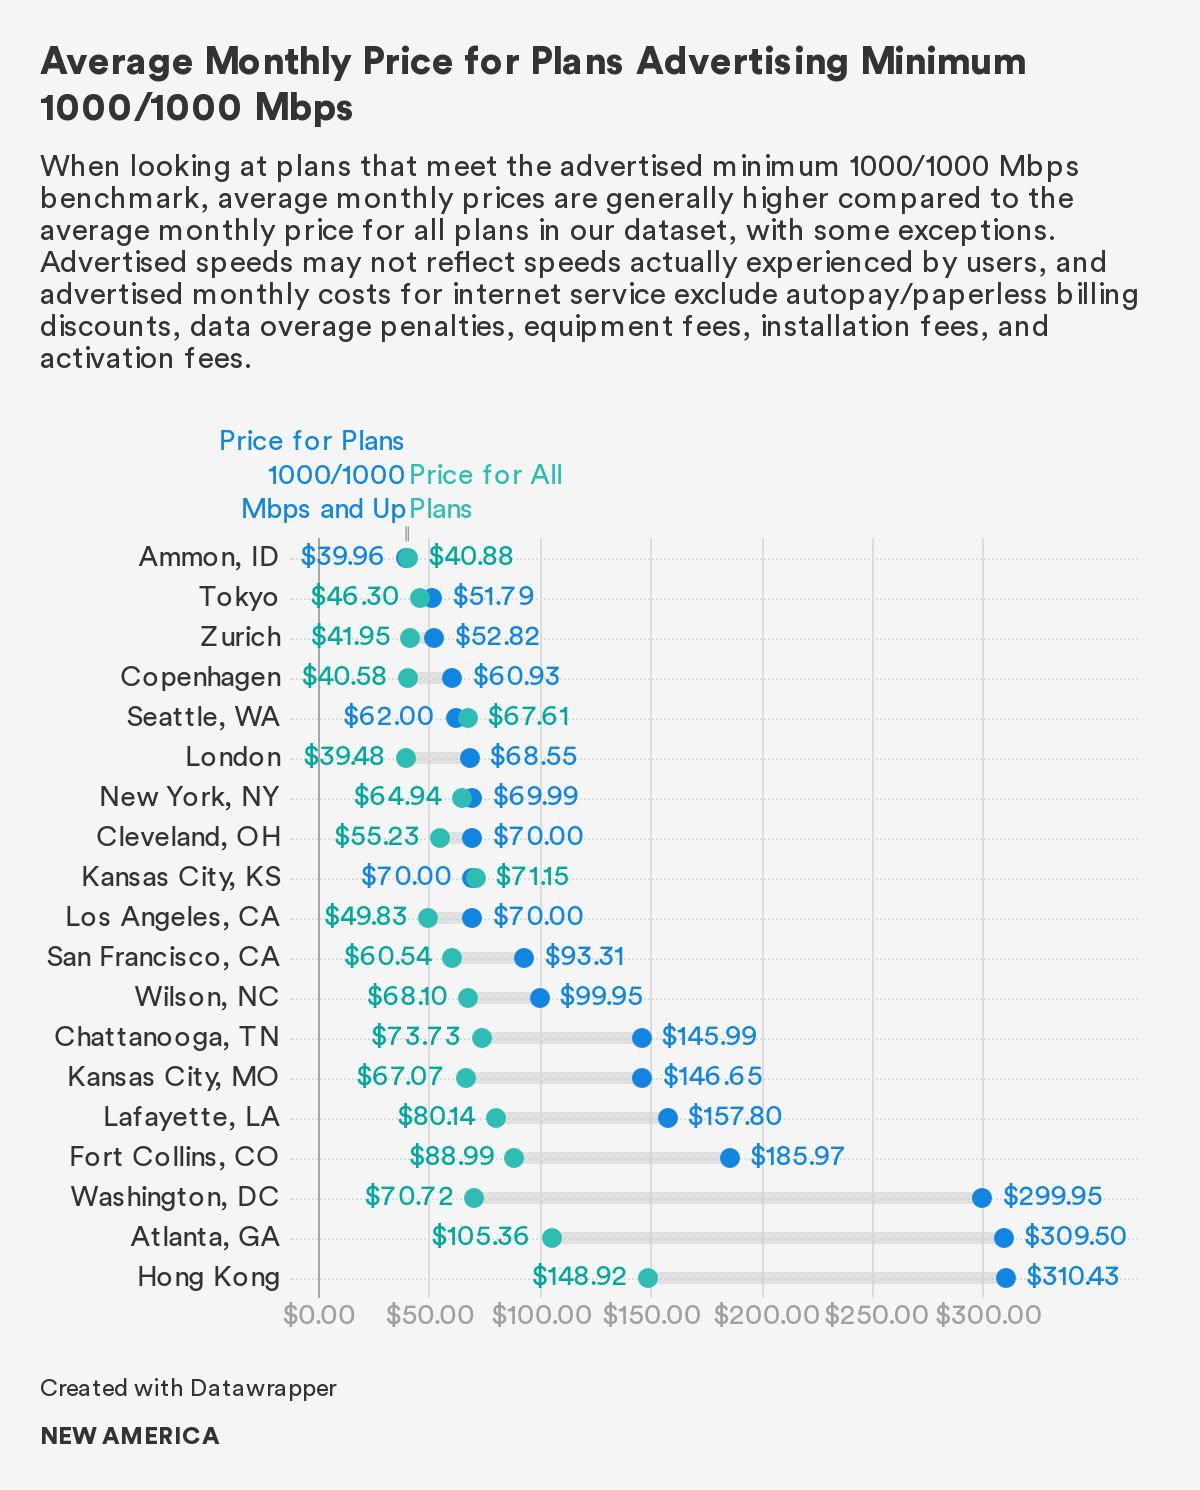
At the 1,000/1,000 Mbps minimum speed tier, Europe is the most affordable on average, followed by the United States and Asia. The U.S. average is $131.70, which is 134 percent more than the European average at $56.37.
Citations
- “The Cost of Fixed-Line Broadband in 206 Countries,” Cable.co.uk, Existent Ltd., 2020, <a href="source">source">source
- See, e.g., Thomas Phillipon, The Great Reversal (Cambridge, MA: Belknap Press, 2019).
- David Leonhardt, “Big Business Is Overcharging You $5,000 a Year,” New York Times, November 10, 2019, <a href="source">source">source
- While this official definition for “broadband” exists, no government agency has set benchmarks for how to measure or verify these speeds. See, e.g., Peter Boothe and Georgia Bullen, “How fast is my Internet? Speed Tests, Accuracy, NDT & M-Lab,” Measurement Lab, March 26, 2019, <a href="source">source">source for more information.
- 2015 Broadband Progress Report and Notice of Inquiry on Immediate Action to Accelerate Deployment, Federal Communications Commission, adopted January 29, 2015, released February 4, 2015, <a href="source">source">source
- Jameson Zimmer, “FCC Broadband Definition Has Changed Before and Will Change Again,” BroadbandNow, February 10, 2018, <a href="source">source">source
- Statement of Commissioner Jessica Rosenworcel, Dissenting, “Fourteenth Broadband Deployment Report Notice of Inquiry,” Rosenworcel Dissenting Statement, adopted August 8, 2018, released: August 9, 2018, 14, <a href="source">source">source
- Amir Nasr, Eric Null, Joshua Stager, Reply Comments of New America’s Open Technology Institute, GN Docket No. 18-238, WC Docket No. 11-10, (October 1, 2018), <a href="source">source">source
- “A third of Americans live in a household with three or more smartphones,” Pew Research Center, May 25, 2017, <a href="source">source">source
- “Household Broadband Guide,” Federal Communications Commission, last modified February 5, 2020, <a href="source">source">source
- Jonathan Sallet, “Tell The Story We Know: Broadband Competition is Too Limited,” Benton Institute for Broadband & Society, March 6, 2020, <a href="source">source">source
- Frontier has since filed for bankruptcy and has sold its operations in Washington, Oregon, Idaho, and Montana. It maintains operations in 25 states. Jon Brodkin, “Frontier Files for Bankruptcy, Says Its Broadband Service Won’t Get Any Worse,” Ars Technica, April 15, 2020, <a href="source">source">source
- H. Trostle and Christopher Mitchell, Profiles of Monopoly: Big Cable and Telecom, (Institute for Local Self-Reliance, July 2018), <a href="source">source">source
- See, e.g., Claire Park, The Cost of Connectivity in West Virginia, (Washington, D.C.: New America’s Open Technology Institute, April 1, 2020), <a href="source">source">source ; and Bill Callahan, “AT&T’s Digital Redlining of Dallas: New Research by Dr. Brian Whitacre,” National Digital Inclusion Alliance, August 6, 2019, <a href="source">source">source
- See, e.g., Monica Anderson, “Mobile Technology and Home Broadband 2019,” Pew Research Center, June 13, 2019, <a href="source">source">source and John B. Horrigan and Maeve Duggan, “3. Barriers to Broadband Adoption: Cost is Now a Substantial Challenge For Many Non-Users,” Pew Research Center, December 21, 2015, <a href="source">source">source
- Emily A. Vogels, Andrew Perrin, Lee Rainie, and Monica Anderson, “53% of Americans Say the Internet Has Been Essential During the COVID-19 Outbreak,” Pew Research Center, April 30, 2020, <a href="source">source">source
- See, Emily A. Vogels, Andrew Perrin, Lee Rainie, and Monica Anderson, “53% of Americans Say the Internet Has Been Essential During the COVID-19 Outbreak,” Pew Research Center, April 30, 2020, <a href="source">source">source
- The 2014 report included 24 cities, and we include all but two of these cities in this year’s report. We omit Berlin, Germany because we were unable to find any standalone internet plans advertised on providers’ websites. We omit Bristol, Virginia because the city has since sold its municipal network: Brandon Bailey, “Sunset Digital to become Point Broadband,” NBC/CW WCYB-TV, May 2, 2019, source">source
- Bill Callahan, “AT&T’s Digital Redlining Of Cleveland,” National Digital Inclusion Alliance (blog), March 10, 2017, source">source
- Claire Park, The Cost of Connectivity in West Virginia, (Washington, D.C.: New America’s Open Technology Institute, April 1, 2020), source">source
- For instance, Sonic, an ISP that services the San Francisco and Los Angeles areas, offered bundle options with internet and phone services at the time of data collection. This approach means that at least several ISPs are excluded from our dataset.
- See, e.g., Amir Nasr, Claire Park, Eric Null, Comments of New America’s Open Technology Institute and Access Now, GN Docket No. 19-285, (November 21, 2019), source">source (“Specifically, mobile broadband is not a substitute for fixed broadband due to the functional difference in how consumers use the services. Mobile broadband is typically higher cost, less reliable (especially in rural areas), slower, and subject to data caps and expensive overage fees in comparison to fixed broadband. Further, mobile broadband is increasingly reliant on fixed broadband for backhaul and offloaded traffic. It would make no sense for the Commission to deem mobile broadband a substitute for fixed broadband when the former service is dependent on the latter.”)
- “Fixed Broadband Deployment,” Federal Communications Commission, June 2019, source">source
- Researchers’ language proficiencies included German, Korean, and Spanish.
- As indicated below, the lack of data is signified by “no data” or a “—” in our data visualization and appendices.
- For example, if a plan advertises a two-year contract with promotional pricing for the first 12 months, we calculate the average price for the entire contract term and record it as the monthly promotional price. For this particular example, we would take the average of 12 months at the promotional price and the sum of 12 months at the non-promotional price.
- 2019 Broadband Deployment Report, Federal Communications Commission, adopted May 8, 2019, released May 29, 2019source">source
- We record rental fees for Comcast’s wireless gateway under “modem rental fees” throughout our dataset and note that a consumer would not have to pay an additional fee to rent a router.
- See Becky Chao and Lukas Pietrzak, The Cost of Connectivity in Ammon, Idaho, (Washington, D.C.: New America’s Open Technology Institute, January 22, 2020), source">source for more information.
- “Google Fiber Fee Schedule,” Google Fiber, last modified April 13, 2020, source">source
- WTFee Survey 2018 Nationally Representative Multi-Mode Survey, (Consumer Reports: January 3, 2019), source">source ; Karl Bode, “Hidden Fees Mean US Cable & Broadband Bills Can Be 45% Higher Than Advertised,” techdirt, October 1, 2019, source">source
- “GDP, PPP (current international $),” World Bank, source">source
- Lifeline is the federal subsidy program for internet and phone services. For more information, see “What is Lifeline?” in the “COVID-19 Exacerbates Affordability Problems, Particularly for BIPOC Communities and Low-income Households” section of this report.
- “Lifeline,” Community Development Program, CenturyLink, last accessed May 27, 2020, source">source
- “Frontier Lifeline Program,” Frontier Communications Corporation, last accessed May 27, 2020, source">source
- “Lifeline,” RCN telecom Services, last accessed May 27, 2020, source">source
- “Frequently Asked Questions,” Low-Cost Home Internet, AT&T, last accessed May 27, 2020, source">source
- “Spectrum Internet Assist,” Charter Communications, last accessed May 27, 2020, source">source
- “Internet Essentials Brings Affordable High-Speed Internet Home,” Internet Essentials, Comcast, last accessed May 27, 2020, source">source
- Tyler Cooper, “DSL vs Cable vs Fiber: Comparing Internet Options,” BroadbandNow, last updated December 12, 2019, source">source
- Cooper, “DSL vs Cable vs Fiber: Comparing Internet Options.”
- Our analysis on monthly internet prices throughout this report defaults to promotional pricing, unless no information on promotional pricing is provided, in which case, we adopt the non-promotional pricing for that plan instead. We note all other exceptions to this rule.
- Visnja Cik Krizanovic, Drago Zagar, and Kresimir Grgic, “A framework for optimal techno-economic assessment of broadband access solutions and digital inclusion of rural population in global information society,” Universal Access Information Society, 17 (2018): 517–540, source">source
- More information on the differences between a modem and router are detailed in the “Focus on the Fees” section.
- Advertised data provides the best publicly available information on internet pricing in the United States, as no government agency collects this information.
- The estimate for Asia is limited by the lack of data on self-installation fees among Asian providers and activation fees for Hong Kong and Tokyo providers in our dataset. In addition, our dataset does not include information on Wi-Fi router purchase fees in Seoul or Tokyo and modem purchase fees in Hong Kong or Seoul because providers in our dataset do not advertise them. As a result, this estimate for total one-time costs a consumer in Asia would pay for self-installation and equipment purchases only includes the average modem purchase fee in Tokyo.
- Fiber penetration in the United States is 15.55 percent, while the average among OECD countries is 26.81 percent. “OECD broadband statistics update,” Organization for EconomicCo-operation and Development, March 3, 2020, source
- The United States has the most expensive average and median monthly prices for fiber-based plans coming to $79.92 and $57.99 whereas in South Korea, which has the highest in fiber penetration rate according to the OECD, fiber-based plans cost on average $31.71 a month and median monthly prices are $30.42. Within our dataset, Denmark, France, Latvia, and Japan, which among the OECD countries rank higher in fiber penetration rates than the United States, also have lower monthly prices for fiber-based plans on average and median than the United States. Organization for Economic Co-operation and Development, “OECD broadband statistics update.”
- Organization for Economic Co-operation and Development, “OECD broadband statistics update.”
- See, e.g., H. Trostle and Christopher Mitchell, Profiles of Monopoly:Big Cable and Telecom, (Institute for Local Self-Reliance, July 2018), source
- Hong Kong’s average monthly internet price of $148.92 represents an outlier that pulls the average for Asia upward.
- Inti Pacheco and Shalini Ramachandran, “Do You Pay Too Much for Internet Service? See How Your Bill Compares,” Wall Street Journal, December 24, 2019, source
- See Appendix A for population density sources.
- Seoul is excluded from this calculation because the plans in our dataset did not include information on advertised upload speeds.
- In the absence of government collection of pricing data or ISP disclosure of their records, advertising remains one of the best available sources of public information on internet pricing.
- Similar to our analysis on monthly internet prices, we look only at the monthly price that ISPs advertise for internet access and exclude monthly or one-time autopay/paperless billing discounts, data overage penalties, equipment fees, installation fees, and activation fees in our analysis on monthly internet prices.
- Amir Nasr, Eric Null, Joshua Stager, Reply Comments of New America’s Open Technology Institute, GN Docket No. 18-238, WC Docket No. 11-10, (October 1, 2018), source
- Users require higher upload speeds to ensure they have enough capacity to run a query on a search engine, post or send a picture, or communicate with someone via video conferencing. Often, users are performing multiple tasks at once, making upload speeds even more important. See, e.g., Becky Chao, Sarah Morris, Amir Nasr, Eric Null, Joshua Stager, Comments of New America’s Open Technology Institute, GN Docket No. 18-238, GN Docket No. 18-231, WC Docket No. 11-10, September 17, 2018, source ; Christine Ottoni, “Content creators can do more with the fastest Internet,” Ting Wake Forest News, Ting, April 3, 2019, source ; Peter Christiansen, ed. Cara Haynes, “What Is a Good Download and Upload Speed?” HighSpeedInternet.com, June 2, 2020, source ; and Alex Bybyk, “What is a good upload speed for streaming?” Restream, August 19, 2019, source
- Statement of Commissioner Jessica Rosenworcel, Dissenting, “Fourteenth Broadband Deployment Report Notice of Inquiry,” Rosenworcel Dissenting Statement, adopted August 8, 2018, released: August 9, 2018, 14, source
Focus on the Fees
Internet service plans feature a litany of additional fees and hidden costs that consumers must navigate to determine the total price. In this section, we examine four common types of ancillary fees: (1) installation and activation fees; (2) equipment fees; (3) penalties for exceeding data caps; and (4) early termination fees and minimum contract lengths.
Activation and Installation Fees Are Common Upfront Costs
When consumers subscribe to internet service, they pay additional one-time set-up fees for a technician visit to the home for service installation, or for a self-installation kit from the provider to guide them through installation themselves. Some providers may charge service activation fees instead of, or in addition to, these installation fees.
The average installation fee in our dataset is $53.74, and the average activation fee is $27.79. The average U.S. installation fee and activation fee are $70.38 and $26.35 respectively. They are both higher than Europe’s average installation fee and activation fee at $36.16 and $29.42 respectively. Asia’s average installation fee and activation fee are $99.38 and $0 respectively.
These fees can add an additional 0 to 1,000 percent to advertised monthly prices. For example, several ISPs in Amsterdam advertise $100 professional installation fees for plans that cost between $30 to $60 per month, meaning that installation alone can cost three times as much as the monthly price for internet service. The activation fees charged by the same ISPs in Amsterdam also come to anywhere from an additional 50 to 130 percent of the advertised monthly price. In the United States, CenturyLink, Charter under its Spectrum brand, Comcast under its Xfinity brand, and Verizon charge $99 or more for installation in some cities, which can amount to an additional 100 to 500 percent of the advertised monthly price for service.
Within our dataset, 18 ISPs offer consumers the option to self-install, which can reduce installation costs by $62.44 on average.62 Most of these ISPs offer self-installation for free; 14 ISPs advertise a self-installation option for $0. The average self-installation fee found for our dataset is $10.48. U.S. providers that offer a self-installation option include AT&T, CenturyLink, Charter under its Spectrum brand, Comcast under its Xfinity brand, EarthLink, Frontier, Raw Bandwidth, and Sparklight, with the average self-installation fee at $9.30.
Equipment Fees are Common, Complex, and Expensive
Consumers also pay equipment fees. Providers usually offer consumers the option to rent or purchase equipment directly. Not every provider offers both options or requires both a Wi-Fi router and modem for internet access. Providers sometimes allow consumers to use their own equipment, but it’s up to the consumer to determine if their equipment is compatible with the provider’s network. We do not record third-party equipment fees in our dataset, and all equipment fees in our dataset reflect the purchase or rental fees a consumer would pay for purchasing or renting that equipment directly from the provider.
A modem connects a home network to the internet by translating the traffic into a format that can be sent over the ISPs infrastructure.63 A router directs traffic from the internet to devices on the home network, usually including devices using Wi-Fi.64 While these devices have historically been separate, there are now modem/router combination devices available on the market, like Comcast’s Wireless Gateway devices.65
Consumers can generally save money over the long term if they choose to purchase equipment instead of renting it, but ISPs dictate whether the option to purchase equipment is available. Equipment from one provider may not be compatible with other providers’ networks, however. Additionally, consumers may not always be able to pay the larger fee to purchase this equipment upfront, and may only be able to pay a smaller monthly fee to rent instead.
ISPs may sometimes impose additional equipment-related costs. For instance, KCCoyote charges an additional $25 wireless router set up fee if it is done at the time of installation. Our analysis does not account for these additional fees.
Our study focuses on four types of equipment fees. We examine the prices providers advertise for consumers to buy or rent two types of equipment: Wi-Fi routers and modems. We analyze each of these plan aspects independently below: (1) Wi-Fi router purchase fees; (2) Wi-Fi router rental fees; (3) modem purchase fees; and (4) modem rental fees.
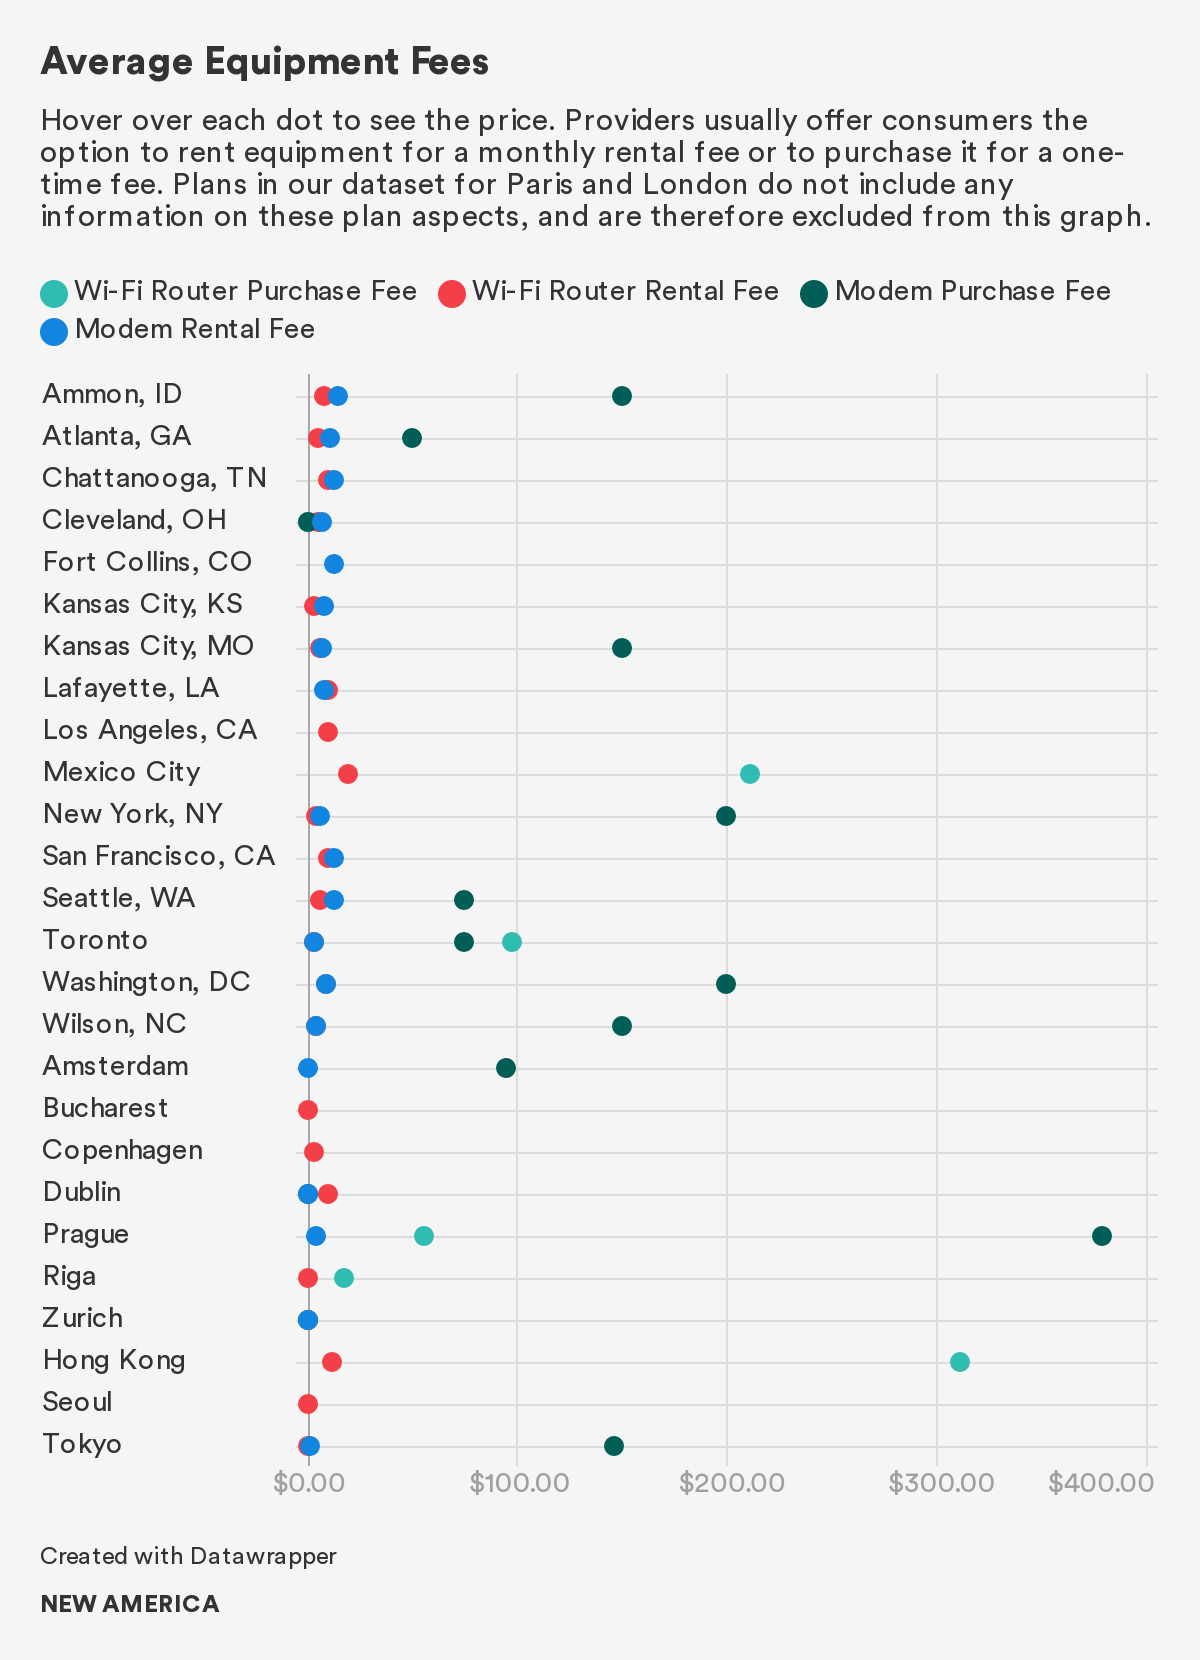
Wi-Fi Router Purchase Fee
The average fee for buying a Wi-Fi router from the ISP is $83.29 in our dataset. These fees fall anywhere between an additional 0 to 558 percent of the advertised monthly price for service. Toronto’s Ebox is on the high end of this range. For example, the ISP advertises a $111.78 Wi-Fi router purchase fee for its $20.04 per month 15 Mbps plan. Nordic in Prague charges $119.93 for Wi-Fi router purchases for plans ranging from $27.40 to $38.49—this purchase fee is an additional 288 to 404 percent of the advertised monthly price.
Since equipment purchase fees are usually charged upfront, consumers cannot always pay these higher one-time fees to buy the Wi-Fi router instead of renting it, if both options are available. Europe has the most expensive average Wi-Fi router purchase fee at $30.44. Our dataset, however, includes no data on advertised Wi-Fi router purchase fees in Asia or the United States, except for Snip Internet in Cleveland, which advertises a $0 Wi-Fi router for purchase.
Wi-Fi Router Rental Fee
The average monthly Wi-Fi router rental fee is $3.56 in our dataset. Comparing rental fees across markets, the average Wi-Fi router rental fee for the U.S. is $6.13 per month. The average U.S. Wi-Fi router rental fee is more than three times that of Europe, which is $1.55 per month. The average Wi-Fi router rental fee advertised in Asia is $0.71. In the United States, AT&T, CenturyLink, Charter under its Spectrum brand, Comcast under its Xfinity brand, and Verizon advertise options for renting Wi-Fi routers from them for a fee, with some promotional offers that include free router rentals. Google Fiber and two local brands in Cleveland rent Wi-Fi routers for free, as well as Altice under its Optimum brand in New York.
The fees can significantly increase a consumer’s monthly bill. For example, the 15 Mbps plan from Comcast in Kansas City, Kan. advertises a Wi-Fi router rental fee that is an additional 65 percent of the advertised monthly cost. So even though the monthly price for the plan is advertised at $19.99, with a monthly Wi-Fi router rental fee of $13, the combined price for internet service and Wi-Fi router rental would be $32.99.66 Even for the next fastest option advertised by Comcast under its Xfinity brand in Kansas City, Mo., a 60 Mbps download speed plan with a monthly price of $29.99, the $13 monthly Wi-Fi router rental fee is an additional 43 percent of the monthly price.
Modem Purchase Fee
The average modem purchase fee is $97.63. These fees constitute anywhere from 0 to 959 percent of advertised monthly prices. O2 in Prague charges the highest purchase fee for a modem, $379.23, for plans advertised with monthly prices anywhere from $43.51 to $75.21. A consumer who wants to purchase a modem from O2 therefore might pay anywhere from six to nine times the advertised monthly service price upfront for one of these plans.
Comparing purchase fees across continents, plans in North America offer the lowest averages, with the average modem purchase fee coming to $87.92. The average modem purchase fee in Europe comes to $155.77. ISPs in Asia charge the highest for purchasing modems at $146.38.
Within the United States, the average modem purchase fee is $126.81. In some cases, the fee is an additional 300 percent of the monthly price. Additionally, CenturyLink charges more for purchasing a modem in some cities than in others. It charges $100 for a modem purchase in Seattle, but $150 in Ammon, Idaho.
Modem Rental Fee
The average modem rental fee is $6.39 per month. These fees amount to anywhere from an additional 0 percent to 75 percent of advertised monthly prices. At the high end of this range is the $15 modem rental fee charged by Wave in San Francisco, which comes to an additional 75 percent of the $19.95 monthly price for internet service.
Comparing rental fees across markets, the average advertised modem rental fees are highest in the United States, followed by Asia and Europe. The average U.S. modem rental fee at $9.86 is more than seventeen times that of Europe’s, $0.58, and eight times higher than Asia’s, $1.17.
Within the United States, the average monthly modem rental fee is $9.86. These monthly modem rental fees can constitute anywhere from 0 to 75 percent of the advertised monthly price. In some cases, like the WOW! (WideOpenInternet) plans in Cleveland that advertise a flat $10 per month for modem rental regardless of plan speed, this fee is an additional 13 to 25 percent of the monthly plan price. In the case of the plans offered by RCN in Washington, D.C., a $10 monthly modem rental fee is 20 to 50 percent of advertised monthly plan prices. Modem rental fees significantly increase the price of slower plans, which may initially appear more affordable than faster speed plans. For example, Wave in San Francisco charges the same $15.00 monthly modem rental fee for both its 50 Mbps download speed plan and its 500 Mbps download speed plan. The monthly price for the 50 Mbps download speed plan is $19.95, which means that the monthly modem rental fee is over an additional 75 percent of the advertised monthly price for the plan.
Data Caps Add Risk of Overage Fees
Data caps further increase the cost of internet service while limiting users’ data consumption. Of the 131 plans in our dataset that advertise data caps, the average cap is 720.94 GB. The average penalty for exceeding the cap is $94.40 per 50 GB.67 Notably, most of the plans with data caps are in the United States. In Europe, all plans advertised no caps or did not specify. In Asia, only one city specified a cap. Of the 10 U.S. plans that advertise data caps, the average cap is 976.92 GB and the median data overage penalty is $10 per 50 GB. While it is difficult to extrapolate with such limited European and Asian data, this research suggests that data caps are much more common in the United States.
These caps have several implications for consumers. First, they make it harder for consumers to decide how much data to purchase.68 Research suggests that consumers often pick suboptimal packages.69 If consumers do not accurately anticipate their data consumption, they may choose plans that include allowances that are too small or large. In the former scenario, they risk incurring overage penalties; in the latter, they pay for data they don’t use. The risk of overage fees falls hardest on low-income households that are unable to pay for unexpected fees.70
Data caps can also discourage the use of even moderately bandwidth-intensive services, including streaming video, but also things like internet-based phone systems.71 Data caps can also inhibit use of more data-intensive telehealth services, which is especially problematic during the COVID-19 pandemic, as telehealth services can help reduce virus transmission by obviating the need for in-person doctor visits. Moreover, some universities have advised students to conserve data usage by turning off camera and microphone functions while attending online classes, which can undermine student participation.72
Furthermore, data caps can have anticompetitive effects on the wider ecosystem, especially if an ISP selectively applies data caps to preference its own content while deprioritizing competitors.73 This scenario became reality in June 2020, when AT&T announced it would exclude the new HBO Max streaming service, which AT&T owns, from consumer data caps. This move, which may have violated the federal net neutrality rules that the FCC repealed in 2017, effectively increased the price of competing streaming services such as Netflix and Hulu, which are not given preferential treatment.74
Lastly, the COVID-19 pandemic has led many observers to question whether data caps are actually necessary.75 As schools, businesses, and states across the country closed in rapid succession in March 2020, many ISPs responded by quickly eliminating their data caps to accommodate the surge in home internet usage.76 The fact that the caps were lifted almost immediately suggests that ISPs had significant excess capacity on their networks all along, and were using data caps to create artificial scarcity. For example, Comcast, which lifted its data caps on March 13, has been able to meet a 32 percent increase in peak traffic since March 1 and an increase of 60 percent in some areas.77 In general, ISPs claim that data caps are necessary to manage peak congestion, but there is little technical rationale to support this assertion—particularly given that data caps apply to all hours of the day, not just peak hours.78
Early Termination Fees and Contract Lengths Make it Difficult to Switch Providers
ISPs can lock consumers into contracts with early termination fees and length requirements, which impose high switching costs.79 Contracts generally vary from month-to-month to 12 months or even 24 months. Within our dataset, the median contract length is 12 months, and the average early termination fee is $162.76. Plans in Asia have the longest median contract length of 24 months, followed by those in Europe, where the median contract length is 12 months. The median contract length in the United States is one month, which reflects the majority of plans in our U.S. dataset and suggests that most plans are not subject to long-term contracts or early termination fees. Nonetheless, a significant portion of plans—123 out of 296 plans—in our U.S. dataset have at least a 12-month contract term. For plans with long-term contracts, U.S. consumers pay the highest average early termination fee at $195.84. In comparison, consumers in Asia and Europe pay $124.12 and $110.63 in average early termination fees respectively.80 It’s also worth noting that some ISPs, such as Frontier at the time of data collection, charge an additional “disconnection fee.”
While consumers can avoid early termination fees by subscribing to plans with a month-to-month contract (so-called no contract plans) if ISPs offer the option, ISPs advertise significant cost savings relative to month-to-month options for plans with long-term contracts. Comcast, kci.net, and Webpass advertise plans at the same speed, but they are priced differently according to contract length. For example, in Atlanta, Comcast under its Xfinity brand advertises a 1,000 Mbps download speed plan on a month-by-month basis for $100 a month. That same plan is advertised for $90 a month with an annual contract. Over the course of a year, an individual can save $120—equivalent to more than an entire month of service—by committing to Comcast service for 12 months. When we compare these plans with different contract length requirements across our entire dataset, the average cost savings is $17.08 a month.81
Despite these potential cost savings, contracts come with trade-offs for consumers. Namely, contract length requirements and early termination fees lock in consumers and stifle competition. The ability to switch between providers serves as an important check on market power that encourages ISPs to compete with lower prices, better customer service, and innovative offers.82 Consumers canceling their service hurts providers’ bottom lines, and providers have a strong incentive to keep consumers satisfied when they know that consumers can easily exit their contracts. Just the threat of exit, too, can deter anti-consumer behavior. Early termination fees shift this dynamic in the ISP’s favor by creating friction in the consumer’s ability to exit the contract. In addition, lock-in contracts stifle competition by deterring new entrants from entering the market.83 As former FCC Chairman Tom Wheeler noted, these fees create “disincentives to competition” for ISPs.84 Consumers have to pay these substantial costs to get out of their contracts—even if they are seeking to switch providers for better customer service or because the speeds they experience do not match advertised speeds.
These contract terms and their lock-in effects can also play a role in creating disincentives for providers to upgrade their infrastructure. These contract terms affect consumers’ ability to take advantage of newer technologies that may come to market during their contract period. At the same time, research also demonstrates that ISPs do not tend to upgrade their infrastructure in areas where they face little to no competition.85
Rather than getting rid of early termination fees, some U.S. providers subsidize switching costs by offering to cover early termination fees for consumers who switch over. For example, Charter will give consumers who switch over from another provider a check for the amount of the consumer’s early termination fee charged by their previous provider on the final bill, so long as these consumers subscribe and install qualifying service.86 Verizon, meanwhile, will give consumers who switch over a credit for the amount of their billed termination fee.87 These strategies have the potential to remedy imbalances that providers impose on consumers through lock-in effects.88 Nonetheless, even with the promise of reimbursement, early termination fees are substantial costs for consumers to incur upfront. In addition, securing this credit often requires consumers to fill out paperwork, which means that there may be trade-offs in time and energy.89
Citations
- “The Cost of Fixed-Line Broadband in 206 Countries,” Cable.co.uk, Existent Ltd., 2020, <a href="<a href="source">source">source">source
- See, e.g., Thomas Phillipon, The Great Reversal (Cambridge, MA: Belknap Press, 2019).
- David Leonhardt, “Big Business Is Overcharging You $5,000 a Year,” New York Times, November 10, 2019, <a href="<a href="source">source">source">source
- While this official definition for “broadband” exists, no government agency has set benchmarks for how to measure or verify these speeds. See, e.g., Peter Boothe and Georgia Bullen, “How fast is my Internet? Speed Tests, Accuracy, NDT & M-Lab,” Measurement Lab, March 26, 2019, <a href="<a href="source">source">source">source for more information.
- 2015 Broadband Progress Report and Notice of Inquiry on Immediate Action to Accelerate Deployment, Federal Communications Commission, adopted January 29, 2015, released February 4, 2015, <a href="<a href="source">source">source">source
- Jameson Zimmer, “FCC Broadband Definition Has Changed Before and Will Change Again,” BroadbandNow, February 10, 2018, <a href="<a href="source">source">source">source
- Statement of Commissioner Jessica Rosenworcel, Dissenting, “Fourteenth Broadband Deployment Report Notice of Inquiry,” Rosenworcel Dissenting Statement, adopted August 8, 2018, released: August 9, 2018, 14, <a href="<a href="source">source">source">source
- Amir Nasr, Eric Null, Joshua Stager, Reply Comments of New America’s Open Technology Institute, GN Docket No. 18-238, WC Docket No. 11-10, (October 1, 2018), <a href="<a href="source">source">source">source
- “A third of Americans live in a household with three or more smartphones,” Pew Research Center, May 25, 2017, <a href="<a href="source">source">source">source
- “Household Broadband Guide,” Federal Communications Commission, last modified February 5, 2020, <a href="<a href="source">source">source">source
- Jonathan Sallet, “Tell The Story We Know: Broadband Competition is Too Limited,” Benton Institute for Broadband & Society, March 6, 2020, <a href="<a href="source">source">source">source
- Frontier has since filed for bankruptcy and has sold its operations in Washington, Oregon, Idaho, and Montana. It maintains operations in 25 states. Jon Brodkin, “Frontier Files for Bankruptcy, Says Its Broadband Service Won’t Get Any Worse,” Ars Technica, April 15, 2020, <a href="<a href="source">source">source">source
- H. Trostle and Christopher Mitchell, Profiles of Monopoly: Big Cable and Telecom, (Institute for Local Self-Reliance, July 2018), <a href="<a href="source">source">source">source
- See, e.g., Claire Park, The Cost of Connectivity in West Virginia, (Washington, D.C.: New America’s Open Technology Institute, April 1, 2020), <a href="<a href="source">source">source">source ; and Bill Callahan, “AT&T’s Digital Redlining of Dallas: New Research by Dr. Brian Whitacre,” National Digital Inclusion Alliance, August 6, 2019, <a href="<a href="source">source">source">source
- See, e.g., Monica Anderson, “Mobile Technology and Home Broadband 2019,” Pew Research Center, June 13, 2019, <a href="<a href="source">source">source">source and John B. Horrigan and Maeve Duggan, “3. Barriers to Broadband Adoption: Cost is Now a Substantial Challenge For Many Non-Users,” Pew Research Center, December 21, 2015, <a href="<a href="source">source">source">source
- Emily A. Vogels, Andrew Perrin, Lee Rainie, and Monica Anderson, “53% of Americans Say the Internet Has Been Essential During the COVID-19 Outbreak,” Pew Research Center, April 30, 2020, <a href="<a href="source">source">source">source
- See, Emily A. Vogels, Andrew Perrin, Lee Rainie, and Monica Anderson, “53% of Americans Say the Internet Has Been Essential During the COVID-19 Outbreak,” Pew Research Center, April 30, 2020, <a href="<a href="source">source">source">source
- The 2014 report included 24 cities, and we include all but two of these cities in this year’s report. We omit Berlin, Germany because we were unable to find any standalone internet plans advertised on providers’ websites. We omit Bristol, Virginia because the city has since sold its municipal network: Brandon Bailey, “Sunset Digital to become Point Broadband,” NBC/CW WCYB-TV, May 2, 2019, <a href="source">source">source
- Bill Callahan, “AT&T’s Digital Redlining Of Cleveland,” National Digital Inclusion Alliance (blog), March 10, 2017, <a href="source">source">source
- Claire Park, The Cost of Connectivity in West Virginia, (Washington, D.C.: New America’s Open Technology Institute, April 1, 2020), <a href="source">source">source
- For instance, Sonic, an ISP that services the San Francisco and Los Angeles areas, offered bundle options with internet and phone services at the time of data collection. This approach means that at least several ISPs are excluded from our dataset.
- See, e.g., Amir Nasr, Claire Park, Eric Null, Comments of New America’s Open Technology Institute and Access Now, GN Docket No. 19-285, (November 21, 2019), <a href="source">source">source (“Specifically, mobile broadband is not a substitute for fixed broadband due to the functional difference in how consumers use the services. Mobile broadband is typically higher cost, less reliable (especially in rural areas), slower, and subject to data caps and expensive overage fees in comparison to fixed broadband. Further, mobile broadband is increasingly reliant on fixed broadband for backhaul and offloaded traffic. It would make no sense for the Commission to deem mobile broadband a substitute for fixed broadband when the former service is dependent on the latter.”)
- “Fixed Broadband Deployment,” Federal Communications Commission, June 2019, <a href="source">source">source
- Researchers’ language proficiencies included German, Korean, and Spanish.
- As indicated below, the lack of data is signified by “no data” or a “—” in our data visualization and appendices.
- For example, if a plan advertises a two-year contract with promotional pricing for the first 12 months, we calculate the average price for the entire contract term and record it as the monthly promotional price. For this particular example, we would take the average of 12 months at the promotional price and the sum of 12 months at the non-promotional price.
- 2019 Broadband Deployment Report, Federal Communications Commission, adopted May 8, 2019, released May 29, 2019<a href="source">source">source
- We record rental fees for Comcast’s wireless gateway under “modem rental fees” throughout our dataset and note that a consumer would not have to pay an additional fee to rent a router.
- See Becky Chao and Lukas Pietrzak, The Cost of Connectivity in Ammon, Idaho, (Washington, D.C.: New America’s Open Technology Institute, January 22, 2020), <a href="source">source">source for more information.
- “Google Fiber Fee Schedule,” Google Fiber, last modified April 13, 2020, <a href="source">source">source
- WTFee Survey 2018 Nationally Representative Multi-Mode Survey, (Consumer Reports: January 3, 2019), <a href="source">source">source ; Karl Bode, “Hidden Fees Mean US Cable & Broadband Bills Can Be 45% Higher Than Advertised,” techdirt, October 1, 2019, <a href="source">source">source
- “GDP, PPP (current international $),” World Bank, <a href="source">source">source
- Lifeline is the federal subsidy program for internet and phone services. For more information, see “What is Lifeline?” in the “COVID-19 Exacerbates Affordability Problems, Particularly for BIPOC Communities and Low-income Households” section of this report.
- “Lifeline,” Community Development Program, CenturyLink, last accessed May 27, 2020, <a href="source">source">source
- “Frontier Lifeline Program,” Frontier Communications Corporation, last accessed May 27, 2020, <a href="source">source">source
- “Lifeline,” RCN telecom Services, last accessed May 27, 2020, <a href="source">source">source
- “Frequently Asked Questions,” Low-Cost Home Internet, AT&T, last accessed May 27, 2020, <a href="source">source">source
- “Spectrum Internet Assist,” Charter Communications, last accessed May 27, 2020, <a href="source">source">source
- “Internet Essentials Brings Affordable High-Speed Internet Home,” Internet Essentials, Comcast, last accessed May 27, 2020, <a href="source">source">source
- Tyler Cooper, “DSL vs Cable vs Fiber: Comparing Internet Options,” BroadbandNow, last updated December 12, 2019, <a href="source">source">source
- Cooper, “DSL vs Cable vs Fiber: Comparing Internet Options.”
- Our analysis on monthly internet prices throughout this report defaults to promotional pricing, unless no information on promotional pricing is provided, in which case, we adopt the non-promotional pricing for that plan instead. We note all other exceptions to this rule.
- Visnja Cik Krizanovic, Drago Zagar, and Kresimir Grgic, “A framework for optimal techno-economic assessment of broadband access solutions and digital inclusion of rural population in global information society,” Universal Access Information Society, 17 (2018): 517–540, <a href="source">source">source
- More information on the differences between a modem and router are detailed in the “Focus on the Fees” section.
- Advertised data provides the best publicly available information on internet pricing in the United States, as no government agency collects this information.
- The estimate for Asia is limited by the lack of data on self-installation fees among Asian providers and activation fees for Hong Kong and Tokyo providers in our dataset. In addition, our dataset does not include information on Wi-Fi router purchase fees in Seoul or Tokyo and modem purchase fees in Hong Kong or Seoul because providers in our dataset do not advertise them. As a result, this estimate for total one-time costs a consumer in Asia would pay for self-installation and equipment purchases only includes the average modem purchase fee in Tokyo.
- Fiber penetration in the United States is 15.55 percent, while the average among OECD countries is 26.81 percent. “OECD broadband statistics update,” Organization for EconomicCo-operation and Development, March 3, 2020, source">source
- The United States has the most expensive average and median monthly prices for fiber-based plans coming to $79.92 and $57.99 whereas in South Korea, which has the highest in fiber penetration rate according to the OECD, fiber-based plans cost on average $31.71 a month and median monthly prices are $30.42. Within our dataset, Denmark, France, Latvia, and Japan, which among the OECD countries rank higher in fiber penetration rates than the United States, also have lower monthly prices for fiber-based plans on average and median than the United States. Organization for Economic Co-operation and Development, “OECD broadband statistics update.”
- Organization for Economic Co-operation and Development, “OECD broadband statistics update.”
- See, e.g., H. Trostle and Christopher Mitchell, Profiles of Monopoly:Big Cable and Telecom, (Institute for Local Self-Reliance, July 2018), source">source
- Hong Kong’s average monthly internet price of $148.92 represents an outlier that pulls the average for Asia upward.
- Inti Pacheco and Shalini Ramachandran, “Do You Pay Too Much for Internet Service? See How Your Bill Compares,” Wall Street Journal, December 24, 2019, source">source
- See Appendix A for population density sources.
- Seoul is excluded from this calculation because the plans in our dataset did not include information on advertised upload speeds.
- In the absence of government collection of pricing data or ISP disclosure of their records, advertising remains one of the best available sources of public information on internet pricing.
- Similar to our analysis on monthly internet prices, we look only at the monthly price that ISPs advertise for internet access and exclude monthly or one-time autopay/paperless billing discounts, data overage penalties, equipment fees, installation fees, and activation fees in our analysis on monthly internet prices.
- Amir Nasr, Eric Null, Joshua Stager, Reply Comments of New America’s Open Technology Institute, GN Docket No. 18-238, WC Docket No. 11-10, (October 1, 2018), source">source
- Users require higher upload speeds to ensure they have enough capacity to run a query on a search engine, post or send a picture, or communicate with someone via video conferencing. Often, users are performing multiple tasks at once, making upload speeds even more important. See, e.g., Becky Chao, Sarah Morris, Amir Nasr, Eric Null, Joshua Stager, Comments of New America’s Open Technology Institute, GN Docket No. 18-238, GN Docket No. 18-231, WC Docket No. 11-10, September 17, 2018, source">source ; Christine Ottoni, “Content creators can do more with the fastest Internet,” Ting Wake Forest News, Ting, April 3, 2019, source">source ; Peter Christiansen, ed. Cara Haynes, “What Is a Good Download and Upload Speed?” HighSpeedInternet.com, June 2, 2020, source">source ; and Alex Bybyk, “What is a good upload speed for streaming?” Restream, August 19, 2019, source">source
- Statement of Commissioner Jessica Rosenworcel, Dissenting, “Fourteenth Broadband Deployment Report Notice of Inquiry,” Rosenworcel Dissenting Statement, adopted August 8, 2018, released: August 9, 2018, 14, source">source
- We calculated this number by taking the average difference between installation and self-installation fees for all plans that specified both.
- “What is a Modem,” Linksys, last accessed May 27, 2020, source
- Melanie Pinola, “Understanding Wi-Fi and How It Works,” Lifewire, May 1, 2020, source
- Molly McLaughlin, “Modem vs. Router: How Do They Differ?” Lifewire, April 9, 2020,source ; “Router vs. Modem: What’s the Difference?” Comcast, February 8, 2019, source
- This combined price excludes other fees that a consumer would have to pay, such as installation fees, activation fees, and data overage penalties.
- The average data overage penalty fee was calculated using the average data overage penalty for Toronto ISP Ebox, which came to $20.29/GB. Ebox does not specify one fee, but charges between $0.40 and $40.17 per GB over the data cap, so the average overage penalty was calculated assuming one plan charged the lowest end of the range, and another charged the highest. Swisscom in Zurich, eo Hikari, NTT East, and Softbank in Tokyo, Wave in Seattle, and Netvigator in Hong Kong, specify data caps but not the corresponding penalty.
- Danielle Kehl and Patrick Lucey, Artificial Scarcity: How Data Caps Harm Consumers and Innovation, (Washington, DC: New America, June 2015), source
- See, e.g., United States Government Accountability Office, Broadband Internet: FCC Should Track the Application of Fixed Internet Usage-Based Pricing and Help Improve Consumer Education, (Washington, DC: United States Government Accountability Office, November 2014),source
- See, e.g., Katie Watson, “Data Caps and Vulnerable Populations,” February 4, 2016, Benton Institute for Broadband & Society, source
- Katie Watson, “Data Caps and Vulnerable Populations,” February 4, 2016, Benton Institute for Broadband & Society, source
- See, e.g.,”Reducing Zoom Data and Bandwidth Use,” Cornell University, last updated March 27, 2020, source
- See, e.g., Applications of AT&T Inc. and DIRECTV for Consent to Assign or Transfer Control of Licenses and Authorizations, MB Docket No. 14-90, Memorandum Opinion and Order, para. 213, source
- While AT&T isn’t implementing this self-preferencing on its home internet plans at this time, the lack of sufficient guardrails in the form of net neutrality protections does not rule out this possibility in the future; Nilay Patel, “HBO Max won’t hit AT&T data caps, but Netflix and Disney Plus will,” Verge, June 2, 2020, source ; Jon Brodkin, “AT&T exempts HBO Max from data caps but still limits your Netflix use,” Ars Technica, June 2, 2020, source
- Rob Pegoraro, The Coronavirus Might Have Just Killed ISP Data Caps,” Fast Company, March 21, 2020, source
- Kathleen Burke, “Keep All Americans Connected By Prohibiting Data Caps During the COVID-19 Pandemic,” Public Knowledge (blog), March 27, 2020, source
- Jon Brodkin, “Comcast waiving data caps hasn’t hurt its network—why not make it permanent?,” Ars Technica, March 31, 2020, source
- Danielle Kehl and Patrick Lucey, Artificial Scarcity: How Data Caps Harm Consumers and Innovation, (Washington, DC: New America, June 2015), 7, source
- Tyler Cooper, “Internet Contracts and Fees: what you need to know,” BroadbandNow, July 16, 2018, source
- We calculate the average early contract termination fee using two data points for the Magnet plan advertised in Dublin. Magnet charges between $124.62 and $249.25 for early contract termination. We include one data point for the minimum fee and another for the maximum, coming to an average contract termination fee of $186.94 for Magnet.
- We calculated this number by taking the average difference between early termination fees for plans that advertised same speeds, but different monthly prices for different contract lengths.
- See, e.g., Oren Bar-Gill and Omri Ben-Shahar, “Exit from Contract,” Journal of Legal Analysis, 6 no.1, (October 2014): 151–183, source
- Oren Bar-Gill and Omri Ben-Shahar, “Exit from Contract.”
- Tom Wheeler, “Prepared Remarks of FCC Chairman Tom Wheeler: ‘The Facts and Future of Broadband Competition,’” Federal Communications Commission, September 4, 2014, source
- See H. Trostle and Christopher Mitchell, Profiles of Monopoly:Big Cable and Telecom, (Institute for Local Self-Reliance, July 2018), source
- “Contract Buyout Eligibility and Redemption Details,” Residential Terms of Service, Charter Communications, last accessed May 27, 2020, source
- “Early Termination Fee Instructions,” Verizon, last accessed May 27, 2020, source
- See, e.g., Oren Bar-Gill and Omri Ben-Shahar, “Exit from Contract,” Journal of Legal Analysis, 6 no.1, (October 2014): 151–183, source
- See, e.g., “Early Termination Fee Instructions,” Verizon, last accessed May 27, 2020, source
Focus on the United States
In the U.S. market, prices vary widely across the country—but municipal networks tend to offer the fastest, most affordable options. Many consumers may struggle to determine total cost due to poor transparency, highly-complex pricing structures, and confusing itemized billing. In addition, the high average cost of internet service is unaffordable for many U.S. consumers, contributing to a longstanding digital divide that disproportionately affects low-income households and BIPOC communities.
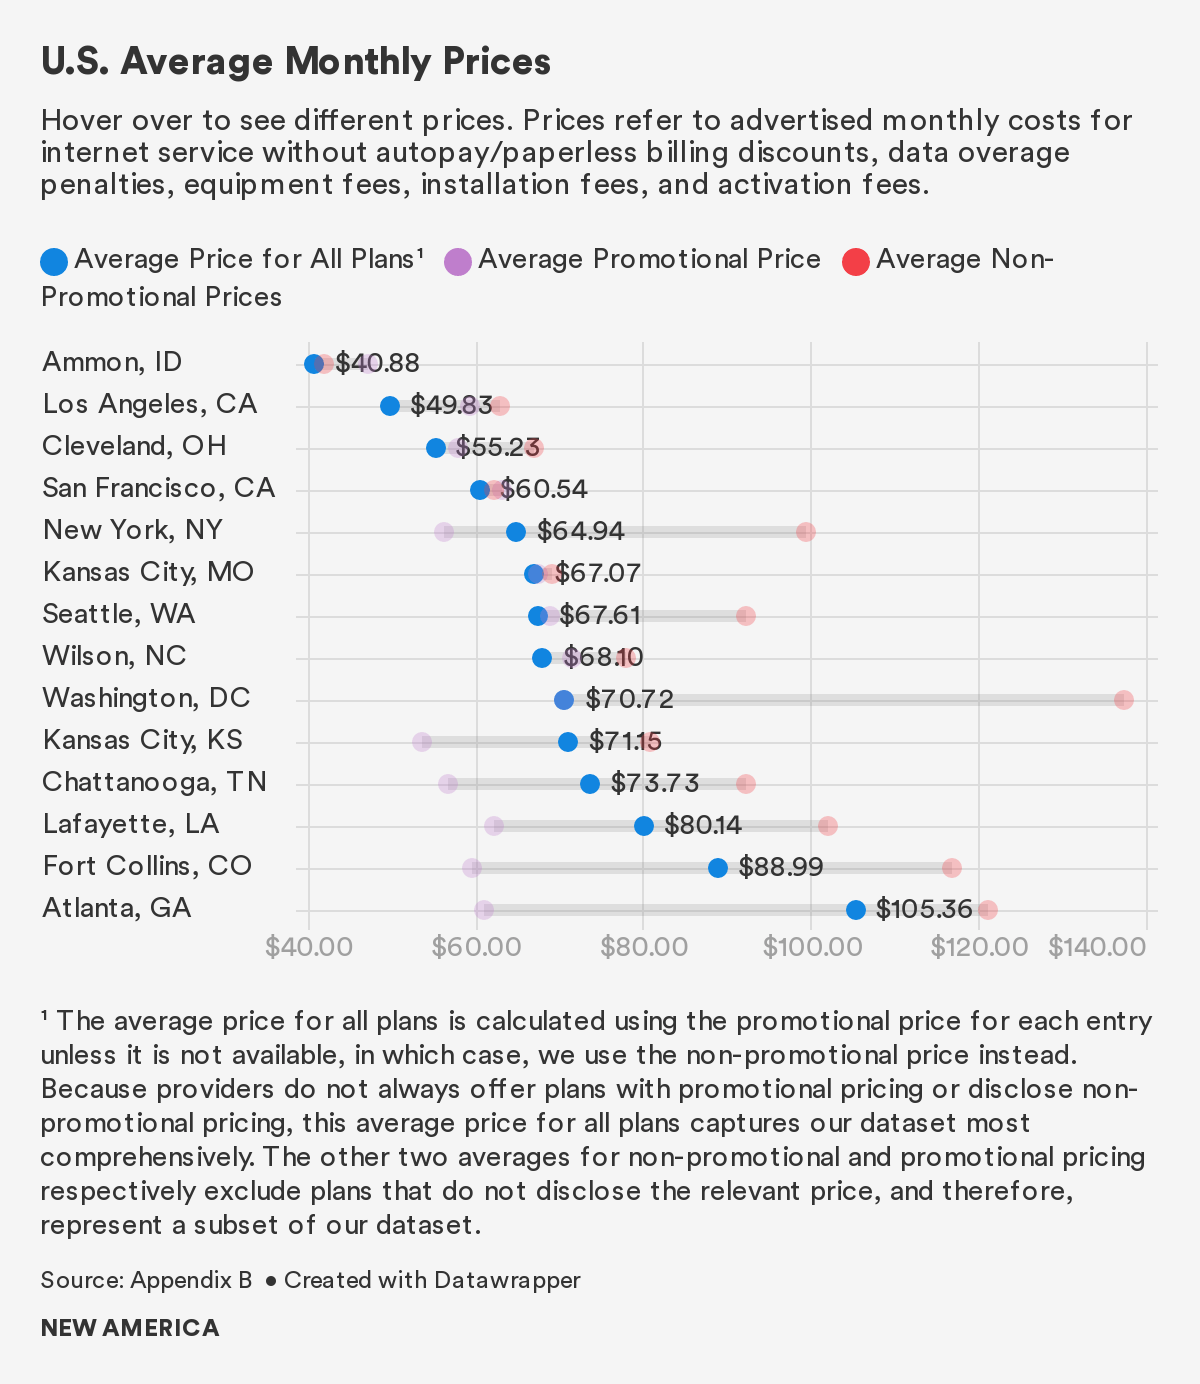
Within our dataset of 290 plans in the United States, the average promotional price is $62.17 per month and the average non-promotional price is $83.41 per month.90 The average monthly cost across all plans is $68.38.91 Of the 14 U.S. cities in our study, Atlanta has the highest average price. The lowest average price is in Ammon, Idaho, a city with a municipally-owned open access network.
Municipal Networks Offer Faster, More Affordable Service
Municipal networks serve more than 500 communities across the country.92 These networks are maintained by local governments either independently or through private-public partnerships. As OTI details in two recent reports, municipal networks can challenge incumbent private providers by delivering higher quality and more affordable internet, reaching more underserved communities than private providers would.93 Municipal networks can also expand economic opportunities by attracting new businesses and connecting residents to online education.
Five of the 14 cities examined within our U.S. dataset have municipal networks: Ammon, Idaho; Wilson, N.C.; Chattanooga, Tenn.; Lafayette, La.; and Fort Collins, Colo. As the following chart demonstrates, municipal providers bring down the average price in each city.
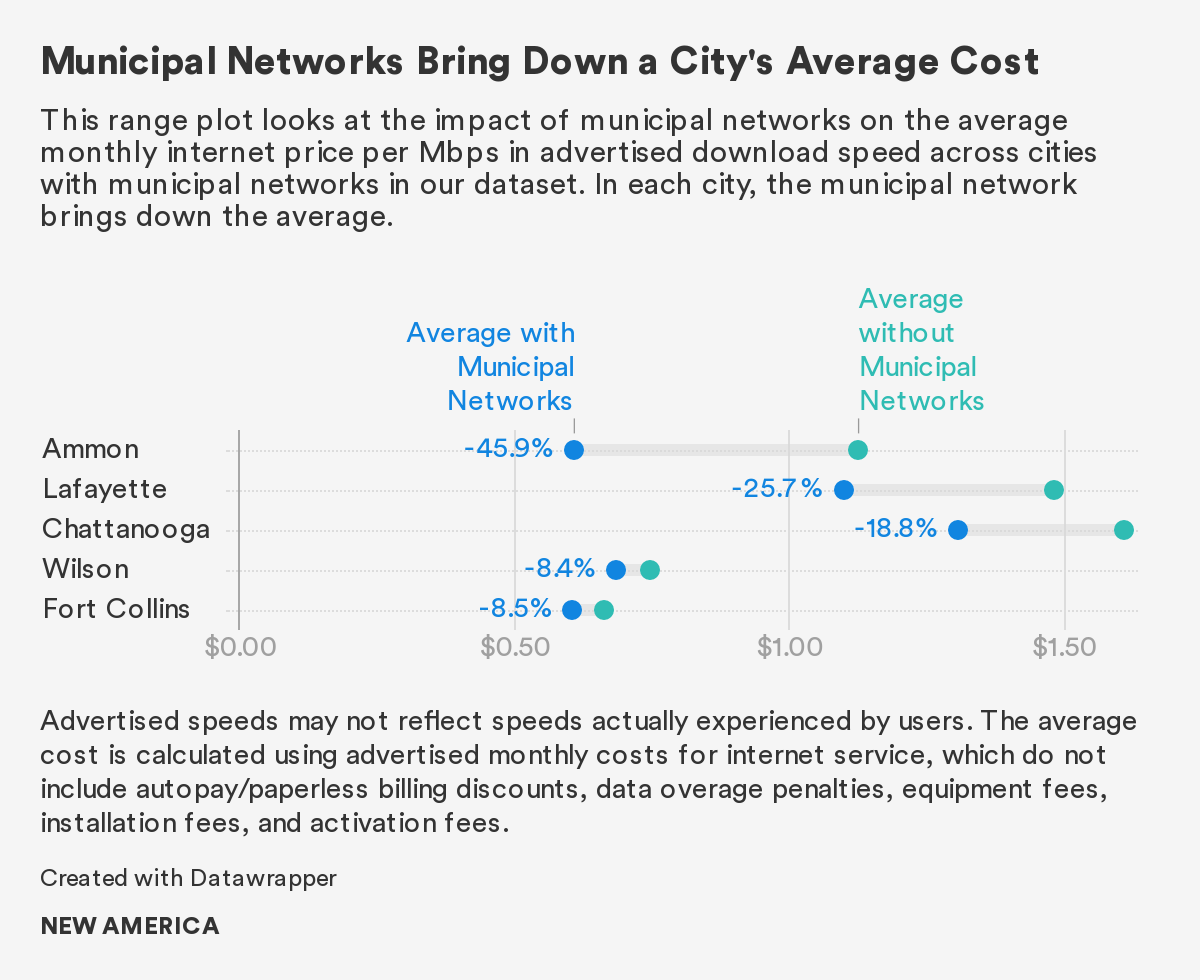
Juxtaposed against the prices advertised by private ISPs in each city, the procompetitive effects of municipal networks are stark. They offer consumers more affordable and faster alternatives than the private market alone. Looking at dollars per Mbps in advertised download speeds, municipal networks bring down the average cost by $0.06 to $0.52 per Mbps.94 Assuming that one pays for 25 Mbps download speed monthly service, for example, a resident in Lafayette, La. would on average pay $73.10 annually on the municipal network, versus $690.87 annually on a private network.95
We can also see the benefit that municipal networks bring in unlocking faster advertised speeds. The average advertised download and upload speeds are higher in cities with municipal networks than those without. The average advertised download speed for plans in cities with municipal networks is 712.88 Mbps, compared to 393.59 Mbps for plans advertised in cities without municipal networks. The average upload speed for plans advertised in cities with municipal networks is 675.40 Mbps, compared to 236.83 Mbps for plans advertised in cities without municipal networks.
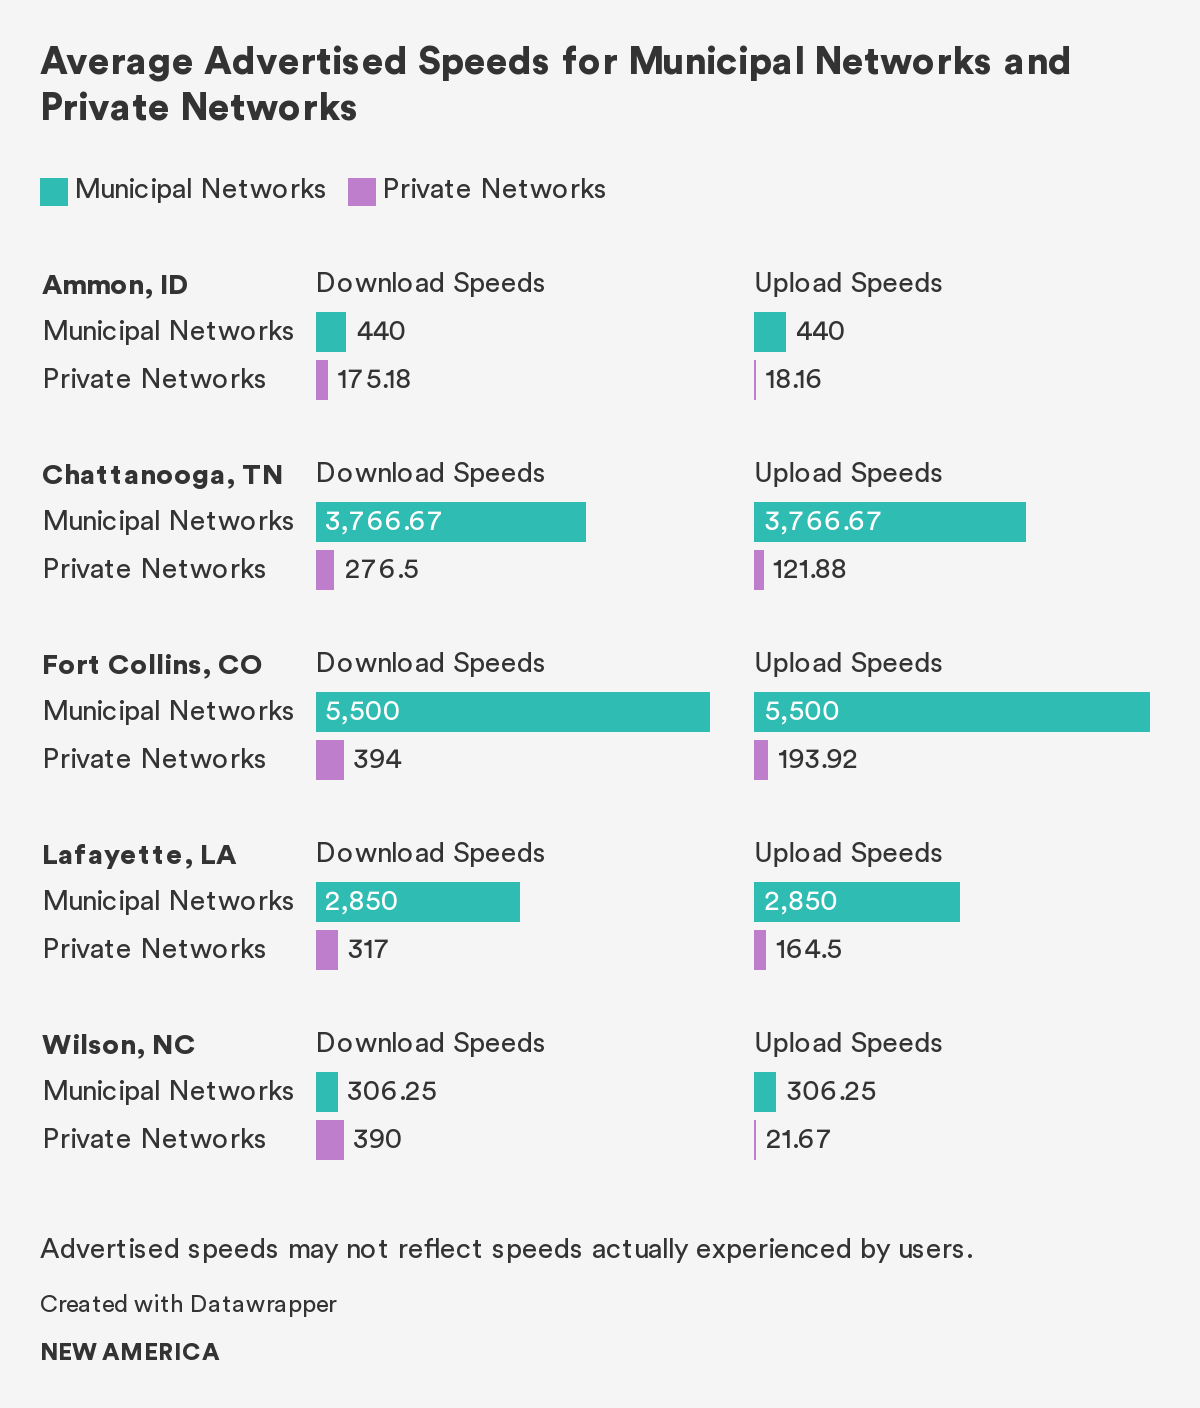
In the five cities, municipal networks offer higher average advertised download and upload speeds than the private networks, with the exception of advertised download speeds in Wilson, N.C. The average advertised download speed for municipal networks in these five cities is 1,608.20 Mbps, over four times the average for prviate networks at 313.18 Mbps. The average advertised upload speed for municipal networks in these five cities is 1,608.20 Mbps, over 14 times the average for prviate networks at 106.62 Mbps.
Earlier this year, OTI published The Cost of Connectivity in Ammon, Idaho, which examines a city that offers an innovative municipal network—and the lowest average monthly price of any U.S. city in our dataset.96 Fort Collins, Colo. offers another interesting case study. The average cost in Fort Collins is on the higher end of our U.S. results. A closer look at our Fort Collins dataset reveals that expensive plans advertised by private ISPs are pulling the city’s average upwards; four of the five most expensive plans are offered by private ISPs. Meanwhile, the city’s municipal network, called Connexion, advertises plans at the same speeds for less. For example, the municipal network offers the fastest plan advertised within Fort Collins, at 10,000 Mbps for $299.95, whereas Comcast under its Xfinity brand offers a plan at the same price that advertises just one-fifth of the download speed. The municipal network also advertises a 1,000 Mbps download speed plan for $59.95, which is almost a third of the price of the comparable 1,000 Mbps download speed plan advertised by kci.net, and $40 less than the 1,000 Mbps download speed plan offered by Comcast under its Xfinity brand. The municipal network, therefore, offers a better deal on the fastest advertised internet service option in the city.97
The benefits of the 1,000 Mbps plan from Connexion’s municipal network may be even more significant in the future. At the time of data collection, Connexion was a relatively new provider, so incumbents may not have felt competitive pressure to lower prices yet. Nonetheless, research has demonstrated that competition at the 1 Gbps speed level—the equivalent of 1,000 Mbps—leads to price reductions.98 For plans advertised between 25 Mbps and 1,000 Mbps download speed, the average price reduction is $13.28 to $29.08 per month. This research also found that each additional provider offering 1 Gbps service in a market reduces prices for comparable plans by $50 to $60 per month.
COVID-19 Exacerbates Affordability Problems, Particularly for BIPOC Communities and Low-income Households
Access to the internet is far from equal, and the digital divide disproportionately affects BIPOC communities and low-income households. One reason for this disparity is the lack of affordability. A growing body of research makes it clear that cost is one of the biggest barriers to adoption. According to a recent study of 6 million U.S. households with annual incomes under $25,000, 51 percent didn’t have home internet because it was too expensive.99
While the racial digital divide can be partially attributed to income inequality and the enduring Black-white wage gap,100 Black and Brown communities are less likely to have home internet access even after accounting for income disparities.101 The problem is especially acute in tribal reservations, where the American Indian Policy Institute found that only 49 percent of residents have fixed home internet service.102 Additionally, a long history of systemic racial discrimination in credit scoring, housing practices, and network deployment likely exacerberates the market failures in this sector.103
Internet affordability has taken on renewed urgency during the COVID-19 pandemic. As the economy slows and companies lay off millions of workers, more and more people are struggling to pay for basic necessities—including internet service. Overall, 61 percent of Latinx households and 44 percent of Black households have experienced a loss of income due to the pandemic, compared to 38 percent of white households—even as Black workers are disproportionately employed in essential work and less likely to have the option to telework.104 According to a Pew survey in April 2020, 28 percent of consumers reported that they were worried about paying their home internet bills in the coming months.105 This percentage increases when looking exclusively at the lower-income survey respondents: 52 percent of lower-income households reported worries, compared to 26 percent of middle-income households and just 9 percent of high-income households.106 Black and Brown communities were also disproportionately concerned: 54 percent of Hispanic adults said they were worried, compared to 36 percent of Black adults and 21 percent of white adults.107
…in April 2020, 28 percent of consumers reported that they were worried about paying their home internet bills in the coming months.
The move to distance learning during the pandemic has further exposed the "homework gap" that many students experience.108 In April 2020, 43 percent of lower-income parents reported that their children will likely have to do homework on their cellphones, and 40 percent said that their children would likely have to use public Wi-Fi to finish schoolwork because they lack a reliable internet connection at home.109 The "homework gap" also disproportionately affects students who belong to BIPOC communities.110
Other researchers have identified benchmarks for low-income affordability that should be explored. For instance, the Benton Institute for Broadband & Society’s Jonathan Sallet recommends that ISPs receiving federal funding be required to offer an unlimited data, 50/50 Mbps plan to all consumers for $50 per month—and $10 per month for low-income consumers.111 Sallet’s recommendation relies on research suggesting that internet costs of $10 per month would be affordable for low-income consumers.112
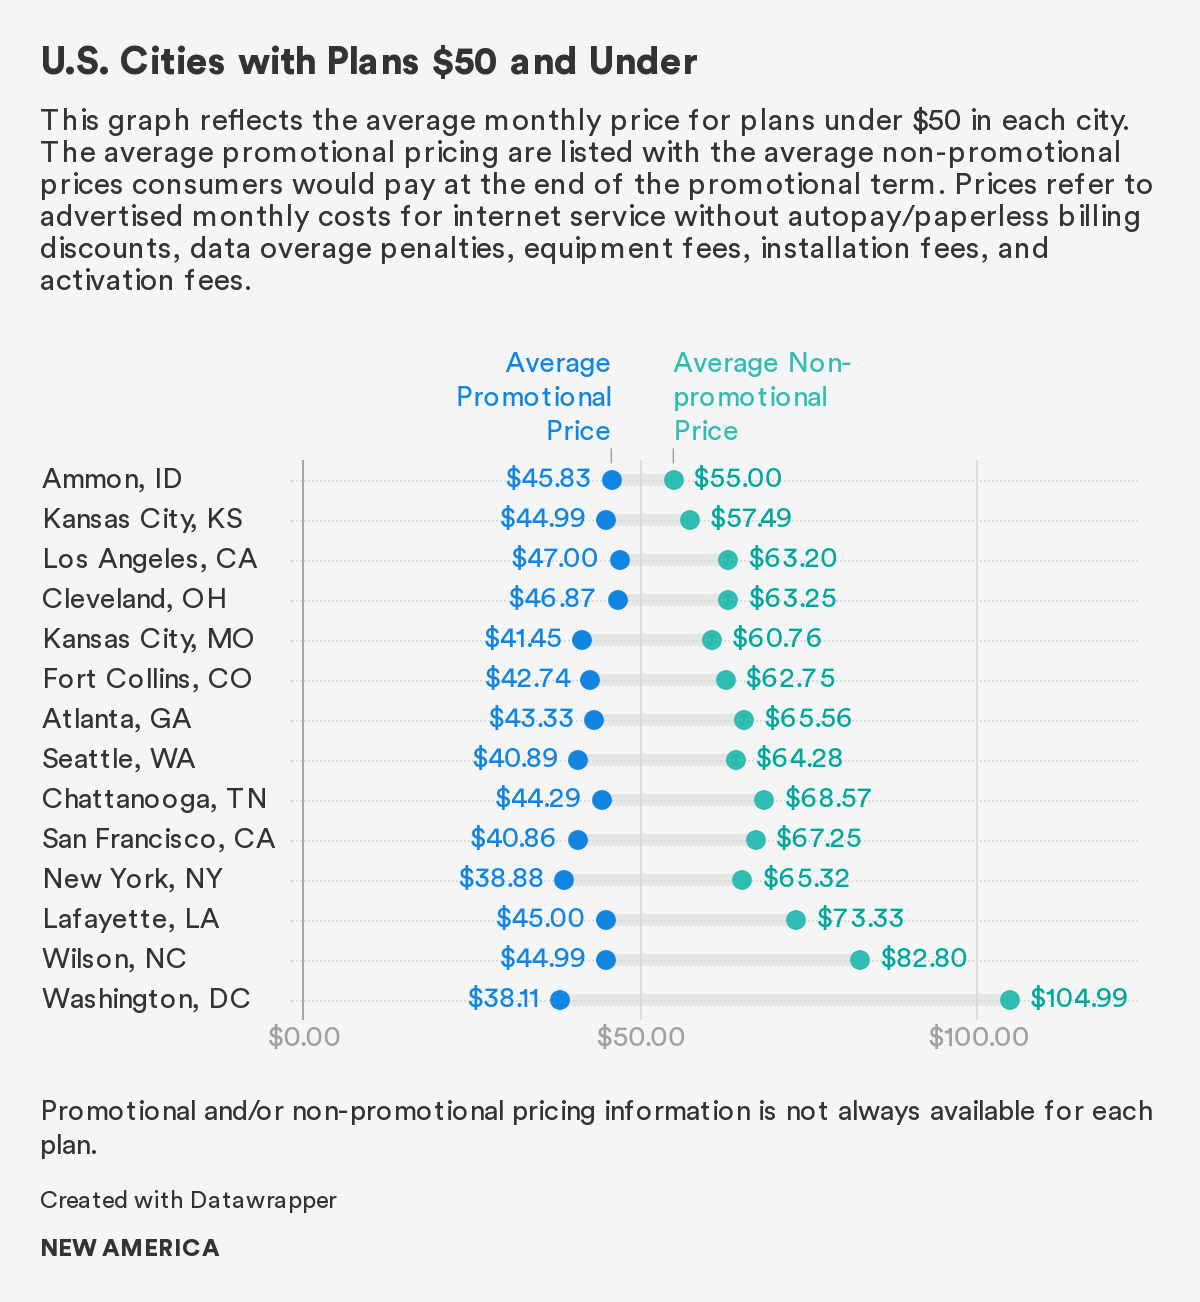
Our dataset demonstrates that the $50 benchmark conflicts with ISPs’ common practice of promotional pricing that increases after a period of time. In our dataset of 290 plans,113 only 118 advertise an initial promotional rate at $50 or less per month. Once the promotional term ends—usually after a year or two—providers increase the monthly rate by $22.25 on average.114 For many households, such price increases are unaffordable.115
Moreover, many plans that fall under the $50 benchmark do not meet advertised broadband speeds. Only 64 plans advertise 25/3 Mbps minimum speeds, the FCC’s current definition of broadband.
Even with promotional pricing, no private provider offers a plan that meets Sallet’s $10 benchmark for low-income households. Our dataset does not include standalone low-income offerings or plans targeted toward Lifeline subscribers for reasons detailed in our methodology. Within our U.S. dataset of 290 plans,116 only six meet this $10 benchmark, and all six are offered on Ammon’s open access network. After accounting for the $16.50 monthly utility costs and additional construction fee, these plans would exceed the $10 benchmark.117
Providers also sometimes offer autopay/paperless billing discounts in the United States.118 Within our United States dataset, these discounts range from $10 to $15 per month and are only advertised by Comcast under its Xfinity brand, Verizon, and WOW!. These discounts are sometimes only available based on the consumer’s method of payment. For instance, Verizon states on its website that it offers a $5 or $10 monthly autopay/paperless billing discount to enrolled consumers who use a debit card or a bank account as their automatic payment method; paying by credit cards is not allowed. This billing practice means that low-income consumers may have a harder time accessing these discounts if they do not have the available cash on hand or do not have bank accounts.
Our study provides additional evidence that internet service in the United States remains unaffordable for, and therefore inaccessible to, many low-income households. Recent research suggests that inflation may be rising faster for poor families.119 While our study doesn’t examine affordability from this perspective, we cannot ignore the economic conditions that affect households’ ability to afford internet services. A 2016 report found that low-income families are spending over 80 percent of their budgets on basic necessities—a much greater share than 30 years ago.120 The current pandemic reinforces that internet access is, as OTI and many others have long argued, a necessity.
These rising costs make government subsidies and discount programs all the more important for low-income households. The federal Lifeline subsidy of $9.25 covers only a small portion of average monthly costs—about 13 percent of the average advertised monthly price in the United States. Lifeline participants are still responsible for covering the difference out-of-pocket, including additional fees. Furthermore, recent FCC reforms have made it more difficult for standalone internet providers to participate in Lifeline.121
The federal Lifeline subsidy of $9.25 covers only a small portion of average monthly costs—about 13 percent of the average advertised monthly price in the United States.
Our dataset does not include standalone low-income offerings or plans targeted toward Lifeline subscribers, as these plans rarely disclose much information online or advertise sufficiently fast speeds for modern needs. For instance, Charter offers a low-income “Internet Assist” plan that is available to eligible households with at least one member participating in the National School Lunch Program (NSLP), Community Eligible Provision of the NSLP, or Supplemental Security Income.122 Charter’s website contains very minimal information about this plan. Similarly, AT&T offers an Access program advertising three speed tiers, none of which meet the FCC’s current definition for broadband.123 AT&T’s Access plans do not come close to meeting the average advertised download speeds across the United States. Nor do these plans come close to advertising the same download speeds per dollar as the plans in our dataset. U.S. consumers pay $0.16 on average for each Mbps in advertised download speed. By this metric, low-income consumers on AT&T’s $5 per month, 3 Mbps Access plan should expect to pay $0.48 per month, but are instead paying more than ten times that amount.124 These disparities suggest that plans targeted at low-income consumers may offer poor value.
What is Lifeline?
Lifeline is a federal program created in 1985 that provides a $9.25 monthly subsidy for telephone and internet services. Individuals are eligible for Lifeline if their income is at or below 135 percent of the federal poverty guidelines, or by participating in other federal assistance programs such as Supplemental Nutrition Assistance Program (SNAP), Medicaid, Supplemental Security Income, or Federal Public Housing Assistance. The subsidy is restricted to one per household, which is defined as any group of people who live together and share income and expenses, even if they are not related. Eligible consumers can use the subsidy on just one type of service: home phone, mobile phone, bundled mobile phone and internet, or standalone home internet—but no combination of any of these services.
Program participation rates are in decline. Rather than trying to improve participation, the FCC has proposed reforms that would make it more difficult for people to apply for Lifeline and maintain their eligibility, restrict provider participation (particularly for standalone internet providers), and infringe on subscribers’ privacy.125
ISPs Are Not Transparent With Consumers
The total cost of service is difficult to determine in the United States. ISPs advertise monthly prices for their services, but these prices are seldom inclusive of ancillary fees and price changes over time. ISPs frequently offer time-limited promotional rates for monthly internet costs, but when the promotional term expires, consumers have to pay the non-promotional rate, which is not always disclosed on providers’ websites. On top of these monthly internet costs, consumers pay fees for equipment purchase or rental, installation and activation, data overages, and early contract termination. These ancillary fees can be perceived as “hidden” fees due to a lack of transparency and complex contract terms. ISPs have also been fined for deceptive billing practices.126 Both trends underscore the urgent need for transparency and robust consumer protections that we detail in the “U.S. Policy Recommendations” section.
Time-limited promotions make it difficult for consumers to understand the prices they can expect to pay for internet access. These promotions are advertised on websites, sometimes without transparency into the prices that consumers would be charged once the promotional term has expired. More transparency around what consumers will be charged at any time is crucial to determining whether plans advertised in an area are truly affordable. The average promotion size for all plans in our dataset is $15.83.127 The average promotion size for U.S. plans is $22.64,128 but the price increase after a promotion expired ranges from 6 to 193 percent of the initial promotional price.129
When providers employ complex pricing structures with numerous itemized fees, consumers may not anticipate these price increases and take them into account in their initial decision-making. Time-limited promotional pricing can also demonstrate a facet of providers’ market power, as they may possess the ability to increase prices over time while maintaining the same plan qualities.
Do Website Restrictions Inhibit Price Transparency?
Web user agreements are common across websites. They detail “terms of service,” “terms of use,” or “acceptable use” policies that govern what users can do on a website. However, since we last published our Cost of Connectivity report in 2014, several ISPs have amended their web user agreements in a manner that inhibits price transparency and discourages public understanding of the cost of internet service.130
For instance, at the time of data collection for the current report, several providers included provisions prohibiting individuals from gathering data or reproducing content from their websites in their web user agreements. AT&T and CenturyLink prohibit users from “systemically collect[ing] and us[ing] any Content including the use of any data mining, or similar data gathering and extraction methods.”131 Verizon prohibits users from “reproduc[ing], display[ing], distribut[ing], or otherwise us[ing] the Site Material in any way for any public or commercial purpose.”132
Toward the goal of greater transparency to empower users, we urge providers to remove these restrictive provisions. Consumers need publicly available data about pricing and plan terms to understand what they are paying for. Researchers need this data to better understand the opaque market for internet service. Policymakers can use this data to inform efforts to close the digital divide. Advertising data also supports an open process for users to challenge inaccurate data without fear of retaliation from industry.
ISP websites typically feature the monthly internet price, but installation and activation fees, equipment fees, data overage penalties, and contract termination fees are generally harder to find. These additional fees can be sidelined to terms and conditions pages or PDF documents accessible through small hyperlinks on the bottom of provider websites or buried in fine print on ISPs’ service agreements. For instance, the comprehensive fee schedule for AT&T is available on its website in the legal policy section located at the bottom of the main webpage.133 Consumers do not always read the (very) fine print to find the contract termination fees,134 and as a result are more likely to underestimate their switching costs—an important distinction when consumers are more likely to overestimate cost-savings from long-term contracts that are more visibly advertised.135
These pricing structures make it difficult for consumers to understand the total price they can expect to pay for internet service. In 2018, 69 percent of U.S. consumers reported experiencing an “unexpected or hidden fee” from a cable, internet, or phone service provider in the past two years.136
Some of these fees may not be disclosed to people when they sign up for internet service. In a 2019 study, Consumer Reports detailed many of these undisclosed fees, including internet service-related fees, administrative fees, and convenience fees.137 For instance, Frontier charged a mandatory internet infrastructure surcharge and RCN charged a mandatory network access and maintenance fee.138 This medley of hidden costs can result in a bill that is up to 45 percent higher than what is advertised.139 It’s also worth noting that Frontier previously charged consumers a $10 monthly router fee, even if they used their own routers. This practice has since become illegal as of early 2020.140
To increase transparency around ISPs’ pricing structures, ISPs should disclose key information about their services in a standardized format, as the FCC encouraged ISPs to do in 2016.141 OTI recommends a format similar to a nutrition label, which we explain in the next section.
Citations
- “The Cost of Fixed-Line Broadband in 206 Countries,” Cable.co.uk, Existent Ltd., 2020, <a href="<a href="<a href="source">source">source">source">source
- See, e.g., Thomas Phillipon, The Great Reversal (Cambridge, MA: Belknap Press, 2019).
- David Leonhardt, “Big Business Is Overcharging You $5,000 a Year,” New York Times, November 10, 2019, <a href="<a href="<a href="source">source">source">source">source
- While this official definition for “broadband” exists, no government agency has set benchmarks for how to measure or verify these speeds. See, e.g., Peter Boothe and Georgia Bullen, “How fast is my Internet? Speed Tests, Accuracy, NDT & M-Lab,” Measurement Lab, March 26, 2019, <a href="<a href="<a href="source">source">source">source">source for more information.
- 2015 Broadband Progress Report and Notice of Inquiry on Immediate Action to Accelerate Deployment, Federal Communications Commission, adopted January 29, 2015, released February 4, 2015, <a href="<a href="<a href="source">source">source">source">source
- Jameson Zimmer, “FCC Broadband Definition Has Changed Before and Will Change Again,” BroadbandNow, February 10, 2018, <a href="<a href="<a href="source">source">source">source">source
- Statement of Commissioner Jessica Rosenworcel, Dissenting, “Fourteenth Broadband Deployment Report Notice of Inquiry,” Rosenworcel Dissenting Statement, adopted August 8, 2018, released: August 9, 2018, 14, <a href="<a href="<a href="source">source">source">source">source
- Amir Nasr, Eric Null, Joshua Stager, Reply Comments of New America’s Open Technology Institute, GN Docket No. 18-238, WC Docket No. 11-10, (October 1, 2018), <a href="<a href="<a href="source">source">source">source">source
- “A third of Americans live in a household with three or more smartphones,” Pew Research Center, May 25, 2017, <a href="<a href="<a href="source">source">source">source">source
- “Household Broadband Guide,” Federal Communications Commission, last modified February 5, 2020, <a href="<a href="<a href="source">source">source">source">source
- Jonathan Sallet, “Tell The Story We Know: Broadband Competition is Too Limited,” Benton Institute for Broadband & Society, March 6, 2020, <a href="<a href="<a href="source">source">source">source">source
- Frontier has since filed for bankruptcy and has sold its operations in Washington, Oregon, Idaho, and Montana. It maintains operations in 25 states. Jon Brodkin, “Frontier Files for Bankruptcy, Says Its Broadband Service Won’t Get Any Worse,” Ars Technica, April 15, 2020, <a href="<a href="<a href="source">source">source">source">source
- H. Trostle and Christopher Mitchell, Profiles of Monopoly: Big Cable and Telecom, (Institute for Local Self-Reliance, July 2018), <a href="<a href="<a href="source">source">source">source">source
- See, e.g., Claire Park, The Cost of Connectivity in West Virginia, (Washington, D.C.: New America’s Open Technology Institute, April 1, 2020), <a href="<a href="<a href="source">source">source">source">source ; and Bill Callahan, “AT&T’s Digital Redlining of Dallas: New Research by Dr. Brian Whitacre,” National Digital Inclusion Alliance, August 6, 2019, <a href="<a href="<a href="source">source">source">source">source
- See, e.g., Monica Anderson, “Mobile Technology and Home Broadband 2019,” Pew Research Center, June 13, 2019, <a href="<a href="<a href="source">source">source">source">source and John B. Horrigan and Maeve Duggan, “3. Barriers to Broadband Adoption: Cost is Now a Substantial Challenge For Many Non-Users,” Pew Research Center, December 21, 2015, <a href="<a href="<a href="source">source">source">source">source
- Emily A. Vogels, Andrew Perrin, Lee Rainie, and Monica Anderson, “53% of Americans Say the Internet Has Been Essential During the COVID-19 Outbreak,” Pew Research Center, April 30, 2020, <a href="<a href="<a href="source">source">source">source">source
- See, Emily A. Vogels, Andrew Perrin, Lee Rainie, and Monica Anderson, “53% of Americans Say the Internet Has Been Essential During the COVID-19 Outbreak,” Pew Research Center, April 30, 2020, <a href="<a href="<a href="source">source">source">source">source
- The 2014 report included 24 cities, and we include all but two of these cities in this year’s report. We omit Berlin, Germany because we were unable to find any standalone internet plans advertised on providers’ websites. We omit Bristol, Virginia because the city has since sold its municipal network: Brandon Bailey, “Sunset Digital to become Point Broadband,” NBC/CW WCYB-TV, May 2, 2019, <a href="<a href="source">source">source">source
- Bill Callahan, “AT&T’s Digital Redlining Of Cleveland,” National Digital Inclusion Alliance (blog), March 10, 2017, <a href="<a href="source">source">source">source
- Claire Park, The Cost of Connectivity in West Virginia, (Washington, D.C.: New America’s Open Technology Institute, April 1, 2020), <a href="<a href="source">source">source">source
- For instance, Sonic, an ISP that services the San Francisco and Los Angeles areas, offered bundle options with internet and phone services at the time of data collection. This approach means that at least several ISPs are excluded from our dataset.
- See, e.g., Amir Nasr, Claire Park, Eric Null, Comments of New America’s Open Technology Institute and Access Now, GN Docket No. 19-285, (November 21, 2019), <a href="<a href="source">source">source">source (“Specifically, mobile broadband is not a substitute for fixed broadband due to the functional difference in how consumers use the services. Mobile broadband is typically higher cost, less reliable (especially in rural areas), slower, and subject to data caps and expensive overage fees in comparison to fixed broadband. Further, mobile broadband is increasingly reliant on fixed broadband for backhaul and offloaded traffic. It would make no sense for the Commission to deem mobile broadband a substitute for fixed broadband when the former service is dependent on the latter.”)
- “Fixed Broadband Deployment,” Federal Communications Commission, June 2019, <a href="<a href="source">source">source">source
- Researchers’ language proficiencies included German, Korean, and Spanish.
- As indicated below, the lack of data is signified by “no data” or a “—” in our data visualization and appendices.
- For example, if a plan advertises a two-year contract with promotional pricing for the first 12 months, we calculate the average price for the entire contract term and record it as the monthly promotional price. For this particular example, we would take the average of 12 months at the promotional price and the sum of 12 months at the non-promotional price.
- 2019 Broadband Deployment Report, Federal Communications Commission, adopted May 8, 2019, released May 29, 2019<a href="<a href="source">source">source">source
- We record rental fees for Comcast’s wireless gateway under “modem rental fees” throughout our dataset and note that a consumer would not have to pay an additional fee to rent a router.
- See Becky Chao and Lukas Pietrzak, The Cost of Connectivity in Ammon, Idaho, (Washington, D.C.: New America’s Open Technology Institute, January 22, 2020), <a href="<a href="source">source">source">source for more information.
- “Google Fiber Fee Schedule,” Google Fiber, last modified April 13, 2020, <a href="<a href="source">source">source">source
- WTFee Survey 2018 Nationally Representative Multi-Mode Survey, (Consumer Reports: January 3, 2019), <a href="<a href="source">source">source">source ; Karl Bode, “Hidden Fees Mean US Cable & Broadband Bills Can Be 45% Higher Than Advertised,” techdirt, October 1, 2019, <a href="<a href="source">source">source">source
- “GDP, PPP (current international $),” World Bank, <a href="<a href="source">source">source">source
- Lifeline is the federal subsidy program for internet and phone services. For more information, see “What is Lifeline?” in the “COVID-19 Exacerbates Affordability Problems, Particularly for BIPOC Communities and Low-income Households” section of this report.
- “Lifeline,” Community Development Program, CenturyLink, last accessed May 27, 2020, <a href="<a href="source">source">source">source
- “Frontier Lifeline Program,” Frontier Communications Corporation, last accessed May 27, 2020, <a href="<a href="source">source">source">source
- “Lifeline,” RCN telecom Services, last accessed May 27, 2020, <a href="<a href="source">source">source">source
- “Frequently Asked Questions,” Low-Cost Home Internet, AT&T, last accessed May 27, 2020, <a href="<a href="source">source">source">source
- “Spectrum Internet Assist,” Charter Communications, last accessed May 27, 2020, <a href="<a href="source">source">source">source
- “Internet Essentials Brings Affordable High-Speed Internet Home,” Internet Essentials, Comcast, last accessed May 27, 2020, <a href="<a href="source">source">source">source
- Tyler Cooper, “DSL vs Cable vs Fiber: Comparing Internet Options,” BroadbandNow, last updated December 12, 2019, <a href="<a href="source">source">source">source
- Cooper, “DSL vs Cable vs Fiber: Comparing Internet Options.”
- Our analysis on monthly internet prices throughout this report defaults to promotional pricing, unless no information on promotional pricing is provided, in which case, we adopt the non-promotional pricing for that plan instead. We note all other exceptions to this rule.
- Visnja Cik Krizanovic, Drago Zagar, and Kresimir Grgic, “A framework for optimal techno-economic assessment of broadband access solutions and digital inclusion of rural population in global information society,” Universal Access Information Society, 17 (2018): 517–540, <a href="<a href="source">source">source">source
- More information on the differences between a modem and router are detailed in the “Focus on the Fees” section.
- Advertised data provides the best publicly available information on internet pricing in the United States, as no government agency collects this information.
- The estimate for Asia is limited by the lack of data on self-installation fees among Asian providers and activation fees for Hong Kong and Tokyo providers in our dataset. In addition, our dataset does not include information on Wi-Fi router purchase fees in Seoul or Tokyo and modem purchase fees in Hong Kong or Seoul because providers in our dataset do not advertise them. As a result, this estimate for total one-time costs a consumer in Asia would pay for self-installation and equipment purchases only includes the average modem purchase fee in Tokyo.
- Fiber penetration in the United States is 15.55 percent, while the average among OECD countries is 26.81 percent. “OECD broadband statistics update,” Organization for EconomicCo-operation and Development, March 3, 2020, <a href="source">source">source
- The United States has the most expensive average and median monthly prices for fiber-based plans coming to $79.92 and $57.99 whereas in South Korea, which has the highest in fiber penetration rate according to the OECD, fiber-based plans cost on average $31.71 a month and median monthly prices are $30.42. Within our dataset, Denmark, France, Latvia, and Japan, which among the OECD countries rank higher in fiber penetration rates than the United States, also have lower monthly prices for fiber-based plans on average and median than the United States. Organization for Economic Co-operation and Development, “OECD broadband statistics update.”
- Organization for Economic Co-operation and Development, “OECD broadband statistics update.”
- See, e.g., H. Trostle and Christopher Mitchell, Profiles of Monopoly:Big Cable and Telecom, (Institute for Local Self-Reliance, July 2018), <a href="source">source">source
- Hong Kong’s average monthly internet price of $148.92 represents an outlier that pulls the average for Asia upward.
- Inti Pacheco and Shalini Ramachandran, “Do You Pay Too Much for Internet Service? See How Your Bill Compares,” Wall Street Journal, December 24, 2019, <a href="source">source">source
- See Appendix A for population density sources.
- Seoul is excluded from this calculation because the plans in our dataset did not include information on advertised upload speeds.
- In the absence of government collection of pricing data or ISP disclosure of their records, advertising remains one of the best available sources of public information on internet pricing.
- Similar to our analysis on monthly internet prices, we look only at the monthly price that ISPs advertise for internet access and exclude monthly or one-time autopay/paperless billing discounts, data overage penalties, equipment fees, installation fees, and activation fees in our analysis on monthly internet prices.
- Amir Nasr, Eric Null, Joshua Stager, Reply Comments of New America’s Open Technology Institute, GN Docket No. 18-238, WC Docket No. 11-10, (October 1, 2018), <a href="source">source">source
- Users require higher upload speeds to ensure they have enough capacity to run a query on a search engine, post or send a picture, or communicate with someone via video conferencing. Often, users are performing multiple tasks at once, making upload speeds even more important. See, e.g., Becky Chao, Sarah Morris, Amir Nasr, Eric Null, Joshua Stager, Comments of New America’s Open Technology Institute, GN Docket No. 18-238, GN Docket No. 18-231, WC Docket No. 11-10, September 17, 2018, <a href="source">source">source ; Christine Ottoni, “Content creators can do more with the fastest Internet,” Ting Wake Forest News, Ting, April 3, 2019, <a href="source">source">source ; Peter Christiansen, ed. Cara Haynes, “What Is a Good Download and Upload Speed?” HighSpeedInternet.com, June 2, 2020, <a href="source">source">source ; and Alex Bybyk, “What is a good upload speed for streaming?” Restream, August 19, 2019, <a href="source">source">source
- Statement of Commissioner Jessica Rosenworcel, Dissenting, “Fourteenth Broadband Deployment Report Notice of Inquiry,” Rosenworcel Dissenting Statement, adopted August 8, 2018, released: August 9, 2018, 14, <a href="source">source">source
- We calculated this number by taking the average difference between installation and self-installation fees for all plans that specified both.
- “What is a Modem,” Linksys, last accessed May 27, 2020, source">source
- Melanie Pinola, “Understanding Wi-Fi and How It Works,” Lifewire, May 1, 2020, source">source
- Molly McLaughlin, “Modem vs. Router: How Do They Differ?” Lifewire, April 9, 2020,source">source ; “Router vs. Modem: What’s the Difference?” Comcast, February 8, 2019, source">source
- This combined price excludes other fees that a consumer would have to pay, such as installation fees, activation fees, and data overage penalties.
- The average data overage penalty fee was calculated using the average data overage penalty for Toronto ISP Ebox, which came to $20.29/GB. Ebox does not specify one fee, but charges between $0.40 and $40.17 per GB over the data cap, so the average overage penalty was calculated assuming one plan charged the lowest end of the range, and another charged the highest. Swisscom in Zurich, eo Hikari, NTT East, and Softbank in Tokyo, Wave in Seattle, and Netvigator in Hong Kong, specify data caps but not the corresponding penalty.
- Danielle Kehl and Patrick Lucey, Artificial Scarcity: How Data Caps Harm Consumers and Innovation, (Washington, DC: New America, June 2015), source">source
- See, e.g., United States Government Accountability Office, Broadband Internet: FCC Should Track the Application of Fixed Internet Usage-Based Pricing and Help Improve Consumer Education, (Washington, DC: United States Government Accountability Office, November 2014),source">source
- See, e.g., Katie Watson, “Data Caps and Vulnerable Populations,” February 4, 2016, Benton Institute for Broadband & Society, source">source
- Katie Watson, “Data Caps and Vulnerable Populations,” February 4, 2016, Benton Institute for Broadband & Society, source">source
- See, e.g.,”Reducing Zoom Data and Bandwidth Use,” Cornell University, last updated March 27, 2020, source">source
- See, e.g., Applications of AT&T Inc. and DIRECTV for Consent to Assign or Transfer Control of Licenses and Authorizations, MB Docket No. 14-90, Memorandum Opinion and Order, para. 213, source">source
- While AT&T isn’t implementing this self-preferencing on its home internet plans at this time, the lack of sufficient guardrails in the form of net neutrality protections does not rule out this possibility in the future; Nilay Patel, “HBO Max won’t hit AT&T data caps, but Netflix and Disney Plus will,” Verge, June 2, 2020, source">source ; Jon Brodkin, “AT&T exempts HBO Max from data caps but still limits your Netflix use,” Ars Technica, June 2, 2020, source">source
- Rob Pegoraro, The Coronavirus Might Have Just Killed ISP Data Caps,” Fast Company, March 21, 2020, source">source
- Kathleen Burke, “Keep All Americans Connected By Prohibiting Data Caps During the COVID-19 Pandemic,” Public Knowledge (blog), March 27, 2020, source">source
- Jon Brodkin, “Comcast waiving data caps hasn’t hurt its network—why not make it permanent?,” Ars Technica, March 31, 2020, source">source
- Danielle Kehl and Patrick Lucey, Artificial Scarcity: How Data Caps Harm Consumers and Innovation, (Washington, DC: New America, June 2015), 7, source">source
- Tyler Cooper, “Internet Contracts and Fees: what you need to know,” BroadbandNow, July 16, 2018, source">source
- We calculate the average early contract termination fee using two data points for the Magnet plan advertised in Dublin. Magnet charges between $124.62 and $249.25 for early contract termination. We include one data point for the minimum fee and another for the maximum, coming to an average contract termination fee of $186.94 for Magnet.
- We calculated this number by taking the average difference between early termination fees for plans that advertised same speeds, but different monthly prices for different contract lengths.
- See, e.g., Oren Bar-Gill and Omri Ben-Shahar, “Exit from Contract,” Journal of Legal Analysis, 6 no.1, (October 2014): 151–183, source">source
- Oren Bar-Gill and Omri Ben-Shahar, “Exit from Contract.”
- Tom Wheeler, “Prepared Remarks of FCC Chairman Tom Wheeler: ‘The Facts and Future of Broadband Competition,’” Federal Communications Commission, September 4, 2014, source">source
- See H. Trostle and Christopher Mitchell, Profiles of Monopoly:Big Cable and Telecom, (Institute for Local Self-Reliance, July 2018), source">source
- “Contract Buyout Eligibility and Redemption Details,” Residential Terms of Service, Charter Communications, last accessed May 27, 2020, source">source
- “Early Termination Fee Instructions,” Verizon, last accessed May 27, 2020, source">source
- See, e.g., Oren Bar-Gill and Omri Ben-Shahar, “Exit from Contract,” Journal of Legal Analysis, 6 no.1, (October 2014): 151–183, source">source
- See, e.g., “Early Termination Fee Instructions,” Verizon, last accessed May 27, 2020, source">source
- This plan count excludes six plans with identical monthly prices for different contract terms. The plans excluded are identified in our methodology.
- We calculate the average price for all plans in our dataset using the promotional price for each entry unless it is not available, in which case, we use the non-promotional price instead. Because providers do not always offer plans with promotional pricing or disclose non-promotional pricing, this average captures our dataset most comprehensively.
- “Community Network Map,” Institute for Local Self-Reliance, updated January 2020, source
- Claire Park, Community Broadband: The Fast, Affordable Internet Option That's Flying Under the Radar (Washington, D.C.: New America, 2020), source ;Becky Chao and Lukas Pietrzak, The Cost of Connectivity in Ammon, Idaho, (Washington, D.C.: New America’s Open Technology Institute, January 22, 2020), source
- We exclude any additional fees that apply to plans operating on municipal networks in our analysis. In Ammon, Idaho, for example, consumers of the city’s open access network are subject to an additional monthly utility fee of $16.50 and separate construction fee paid to the city, on top of the monthly price paid to the provider. See Becky Chao and Lukas Pietrzak, The Cost of Connectivity in Ammon, Idaho, (Washington, D.C.: New America’s Open Technology Institute, January 22, 2020), source for more information.
- This comparison only includes monthly internet costs and excludes any additional fees. For the private network comparison, we use the average cost per Mbps based on monthly prices and speeds advertised by AT&T in Lafayette, La.
- This comparison only includes monthly internet costs and excludes any additional fees. See Becky Chao and Lukas Pietrzak, The Cost of Connectivity in Ammon, Idaho, (Washington, D.C.: New America’s Open Technology Institute, January 22, 2020), source for more information.
- Jon Brodkin, “Comcast, Beware: New city-run broadband offers 1Gbps for $60 a month,” Ars Technica, August 30, 2019, source
- Dan Mahoney and Greg Rafert, “Broadband Competition Helps to Drive Lower Prices and Faster Download Speeds for U.S. Residential Consumers,” Analysis Group Whitepaper, November 2016, 21-22, 24, source
- Rafi Goldberg, “Unplugged: NTIA Survey Finds Some Americans Still Avoid Home Internet Use,” National Telecommunications and Information Administration, April 15, 2019, source
- Elise Gould, “Black-white wage gaps are worse today than in 2000,” Economic Policy Institute, February 27, 2020, source
- See, e.g., S. Derek Turner, Digital Denied: The Impact of Systemic Racial Discrimination on Home-Internet Adoption, (Free Press: December 2016), source; Robert Fairlie, “Race and the Digital Divide,” UC Santa Cruz: Department of Economics, UCSC, September 11, 2014, source
- Brian Howard and Traci Morris, Tribal Tech Assessment: The State of Internet Service on Tribal Lands, (American Indian Policy Institute: July 27, 2019), source
- See, e.g., S. Derek Turner, Digital Denied: The Impact of Systemic Racial Discrimination on Home-Internet Adoption, (Free Press: December 2016), source; AT&T has also allegedly engaged in “digital redlining” in Cleveland, Ohio, see, e.g., Bill Callahan, “AT&T’s Digital Redlining Of Cleveland,” National Digital Inclusion Alliance (blog), March 10, 2017, source
- Darrick Hamilton, Preface, Dedrick Asante-Muhammad, Chuck Collins, and Omar Ocampo, White Supremacy is the Preexisting Condition: Eight Solutions to Ensure Economic Recovery Reduces the Racial Wealth Divide, Institute for Policy Studies, June 19, 2020, source; See, also, Ernie Tedeschi and Quoctrung Bui, “Unemployment Tracker: Job Losses for Black Workers Are Deepening,” New York Times, last updated June 16, 2020, source
- Emily A. Vogels, Andrew Perrin, Lee Rainie, and Monica Anderson, “53% of Americans Say the Internet Has Been Essential During the COVID-19 Outbreak,” Pew Research Center, April 30, 2020, source
- Emily A. Vogels, Andrew Perrin, Lee Rainie, and Monica Anderson, “53% of Americans Say the Internet Has Been Essential During the COVID-19 Outbreak.”
- See, e.g., By Suzanne Woolley, Nikitha Sattiraju, and Scott Moritz, “U.S. Schools Trying to Teach Online Highlight a Digital Divide,” Bloomberg, March 26, 2020,source
- Emily A. Vogels, Andrew Perrin, Lee Rainie, and Monica Anderson, “53% of Americans Say the Internet Has Been Essential During the COVID-19 Outbreak,” Pew Research Center, April 30, 2020, source
- See, e.g., Brian Howard and Mikhail Sundust, “COVID-19: The Impact of Limited Internet Access and Issues with Social Distancing for Native Students,” American Indian Policy Institute, Spring 2020, source
- Jonathan Sallet, “Tell The Story We Know: Broadband Competition is Too Limited,” Benton Institute for Broadband & Society, March 6, 2020, source
- A report from the Benton Institute for Broadband and Society found that low-income participants in the Twin Cities, Minnesota were able to afford internet services offered by non-profit partnership programs at $10 per month. Colin Rhinesmith, Digital Inclusion and Meaningful Broadband Adoption Initiatives, (Evanston, IL: Benton Institute for Broadband and Society, January 2016), source
- This plan count excludes six plans that offer the same monthly price at different contract terms. The excluded plans are disclosed in our “Methodology” section.
- This average was calculated for the 64 plans that offered an initial promotional price of $50 and under and advertised the non-promotional price on their websites. Plans that did not disclose non-promotional prices were excluded from this calculation.
- For instance, community members enrolled in a non-profit partnership program offering internet access for $10 a month have said that increasing the cost to $20 a month would pose financial difficulties. Colin Rhinesmith, Digital Inclusion and Meaningful Broadband Adoption Initiatives, (Evanston, IL: Benton Institute for Broadband and Society, January 2016), source
- This plan count excludes six plans that offer the same monthly price at different contract terms. The excluded plans are disclosed in our “Methodology” section.
- See Becky Chao and Lukas Pietrzak, The Cost of Connectivity in Ammon, Idaho, (Washington, D.C.: New America’s Open Technology Institute, January 22, 2020), source for more information.
- Providers abroad did not appear to advertise similar discounts.
- See, e.g., Xavier Jaravel, The Unequal Gains from Product Innovations: Evidence from the U.S. Retail Sector, The Quarterly Journal of Economics 134, issue 2, (May 2019): 715–783, source
- Bourree Lam, “The Surging Cost of Basic Needs,” Atlantic, June 2, 2016, source
- Sarah Morris, Joshua Stager, Eric Null, Amir Nasr, Becky Chao, Comments of New America’s Open Technology Institute in the Matter of Bridging the Digital Divide for Low-Income Consumers, WC Docket No. 17-287, (February 21, 2018), source
- “Spectrum Internet Assist,” Charter, last accessed May 27, 2020, source
- AT&T provides the fastest speed available at a consumer’s residence. “Frequently Asked Questions,” Low-Cost Home Internet, AT&T, last accessed May 27, 2020, source
- At $5 a month, the AT&T plan charges low-income consumers by 10.42 times more than the average cost of plans in our U.S. dataset.
- Amir Nasr and Claire Park, “The Government Is Severing a Lifeline for Low-Income Americans,” New America Weekly, March 5, 2020, source ; Federal Communications Commission, Fifth Report and Order, Memorandum Opinion and Order on Reconsideration, and Further Notice of Proposed Rulemaking, WC Docket No. 17-287, WC Docket No. 11-42, WC Docket No. 09-197, adopted October 30, 2019, released November 14, 2019,source
- See, e.g. “AT&T to Pay $60 Million to Resolve FTC Allegations It Misled Consumers with ‘Unlimited Data’ Promises,” Federal Trade Commission, November 5, 2019, source
- We calculate this average for the 299 plans that providers advertised both promotional and non-promotional pricing for. Plans that did not disclose either promotional or non-promotional prices are excluded from this calculation.
- We calculate this average for the 140 plans that providers advertised both promotional and non-promotional pricing for. Plans that did not disclose either promotional (meaning that providers did not offer promotional pricing) or non-promotional prices are excluded from this calculation.
- We calculate the size of the price increase for the 140 plans with both advertised promotional and non-promotional pricing by taking the size of the promotional and dividing it by the initial promotional price.
- See David Talbot, Kira Hessekiel, and Danielle Kehl, Community Owned Fiber Networks: Value Leaders in America, (Cambridge, MA: Berkman KleinCenter for Internet & Society, 2017), source
- “14. Acceptable Use,” AT&T Website Terms of Use, AT&T, effective January 2020, source ; “Century Link Website User Agreement,” CenturyLink, effective June 1, 2014, source
- “Terms and Conditions,” Verizon, last accessed May 27, 2020, source
- “AT&T Internet Consumer Fee Schedule,” Legal Policy Center, AT&T, source; “AT&T Internet Consumer Fee Schedule,” AT&T, source
- Caroline Cakebread, “You're not alone, no one reads terms of service agreements,” Business Insider, November 15, 2017, source
- See, e.g., Oren Bar-Gill and Omri Ben-Shahar, “Exit from Contract,” Journal of Legal Analysis, 6 no.1, (October 2014): 151–183, source
- WTFee Survey 2018 Nationally Representative Multi-Mode Survey, (Consumer Reports: January 3, 2019), source
- WTFee Survey 2018 Nationally Representative Multi-Mode Survey, (Consumer Reports: January 3, 2019)
- “Taxes and Surcharges,” Understand My Bill, Frontier, last accessed May 27, 2020, source
- “US cable and fixed telecom bundle rates up to 45% higher than advertised,” GlobalData, September 27, 2019, source
- Jon Brodkin, “US Finally Prohibits ISPs From Charging for Routers They Don’t Provide,” Ars Technica, January 7, 2020, source ; Frontier has also since gone bankrupt.
- Federal Communications Commission, Report and Order On Remand, Declaratory Ruling, and Order, GN Docket No. 14-28, adopted February 26, 2015, released March 12, 2015, 80, source
U.S. Policy Recommendations
Our dataset indicates that, for many consumers, the cost of connectivity is simply too high—and too complicated. In this section, we offer recommendations for how U.S. policymakers can help consumers. While no single recommendation is a panacea, collectively they would make internet service more affordable and accessible in the United States.
The FCC Should Collect Better Data on the Cost and Availability of Internet Service
Policymakers and the public need better data on internet availability, access, and affordability. The FCC’s widely maligned maps of internet deployment are inaccurate and do not match up with reality. The maps’ flaws stem from the underlying dataset, which is self-reported from ISPs and prone to overcounting. Pricing data is even more opaque. ISPs do not publicly disclose any datasets about their prices. No government agency collects pricing data, either. All of this leaves consumers and lawmakers in the dark. The government must collect more accurate and granular data on actual deployment, available speeds, and pricing.142
On deployment, the government relies on self-reported data from the ISPs that is inherently flawed. All facilities-based providers are required to report deployment data to the FCC twice a year in a filing known as Form 477. ISPs must disclose where they can feasibly offer internet service at speeds exceeding 200 kilobits per second (kbps) in at least one direction (upload or download speed) and list the census blocks where “they can or do offer service to at least one location.”143 This method is imprecise and overcounts availability, especially in rural areas where census blocks tend to be larger.144 In addition, the FCC’s Form 477 instructions state that, “broadband connections are available in a census block if the provider does, or could, within a service interval that is typical for that type of connection—that is, without an extraordinary commitment of resources—provision two-way data transmission to and from the Internet with advertised speeds exceeding 200 kbps in at least one direction to end-user premises in the census block.”145 By asking ISPs to self-report the areas where they merely could feasibly provide high-speed broadband, Form 477 data risks overstating internet availability.146
With respect to speed data, the FCC similarly relies on ISP-reported data that does not always match the speeds users actually experience. Independent studies have found that many U.S. communities experience different speeds than the data that ISPs report to the FCC.147 For example, OTI’s United States of Broadband Map visualized the difference between download and upload speeds based on FCC data and the speeds actually experienced by users, as measured by M-Lab data.148 It’s important to note that there are various reasons these discrepancies could exist. Subscribers may have chosen a plan with a lower speed limit (and presumably lower price) than the service the ISP reported to the FCC. This consideration makes drawing conclusions about the data challenging—and underscores the need for clearer, more robust reporting and analysis from the expert agency tasked with this work.
The situation is worst of all for pricing data. Currently, no government agency collects data on internet prices. High prices have been identified as a key cause of the digital divide.149 Yet policymakers have no data on prices to guide their efforts to close the digital divide. The government also needs pricing data to create an evidentiary record that could inform future regulatory and antitrust enforcement. The FCC could also use pricing data to identify any pricing discrimination that may exist on the basis of income, race, or geography. The challenges in collecting pricing data described in our research methodology makes clear that, absent a clear government mandate, this data will remain uncollected at scale. In July 2020, the House of Representatives passed a bill that directs the FCC to collect pricing data from ISPs.150 Unfortunately, the Senate has not taken action on this bill.
Indeed, it is extremely burdensome for independent researchers to conduct the type of research included in this report. ISPs are not transparent about pricing terms, and it’s difficult to determine where service is even available. Comparative analysis of internet service plans is challenging, too, due to a lack of standardization across providers and the complex plan structure. Therefore, it is critical that the government collect and analyze accurate and granular internet deployment, availability, and access data that includes pricing data.
ISPs Should Clearly Disclose Price and Service Terms in a “Broadband Nutrition Label”
A clear takeaway from our research is that the cost of connectivity is difficult to find and often hidden in convoluted pricing schemes or obscure contract terms. Consumers cannot make informed decisions in this environment. Accordingly, the United States needs better truth-in-billing requirements for internet service.
As explained in this report, ISPs advertise prices that are not inclusive of all costs, instead relying on convoluted lists of itemized fees that can confuse consumers. The advertised price for monthly service often excludes ancillary fees for equipment, installation, and activation. Some costs, like contract termination fees, may be buried in lengthy terms of service. Other fees may not be disclosed at all.151 These hidden fees make it difficult for consumers to identify the total cost, often resulting in bills that are unexpectedly higher than what is disclosed on a provider’s website.152 This complexity also makes it difficult for consumers to comparison-shop.
People need to know what they are paying for. They need more transparency from ISPs. To this end, OTI has long advocated for a “broadband nutrition label,” a standardized format—similar to the Food and Drug Administration’s (FDA) familiar nutrition labels—that ISPs can use to disclose the prices, speeds, and terms of their various services.153 In 2016, the FCC created a broadband consumer label that largely adopted these concepts.154
This label was unanimously endorsed by a diverse committee of ISPs, government officials, and consumer advocates.155 The label is voluntary for ISPs to use, but the FCC has done little to promote or encourage its adoption in recent years. The FCC should do more to revive the label so it becomes as familiar to consumers as the FDA’s nutrition labels. In July 2020, the House of Representatives passed a bill that requires the FCC to incentivize widespread adoption of the label. The bill also requires the FCC to hold public hearings to learn more about how consumers evaluate internet services and whether current disclosures are sufficient.156 Unfortunately, the Senate has not taken action on this bill. But the FCC should not wait for Congress; the agency can do these things now. Doing so would help give consumers the truth-in-billing clarity that has eluded them for so long in this market.
The Government Should Expand Lifeline and Other Low-income Internet Discounts
Lifeline is the only federal program that directly addresses the affordability of telecommunications services. Households with annual incomes at or below 135 percent of federal poverty guidelines, and/or individuals who participate in other federal assistance programs like Medicare or SNAP may qualify to receive $9.25 a month toward telecommunications services through the Lifeline program.
Our study underscores how the Lifeline subsidy is essential to helping people access employment opportunities, healthcare, government services, and other benefits that come with being connected. The majority of plans in our U.S. dataset cost over $50 a month, and only 64 of the 118 plans that fall under this benchmark meet the current FCC definition for broadband speeds at 25/3 Mbps—the excessively slow speeds of plans targeted toward low-income households, have been long recognized as a pervasive problem.157 Essentially no plans in our dataset meet the $10 price benchmark that Sallet recommends.158 As detailed earlier in our report, we find that six plans on Ammon’s open access network in our dataset meet this benchmark, but the monthly prices for these plans do not include the additional fees consumers pay for the open access network.159 After accounting for these true costs, the monthly price would exceed the $10 benchmark. Our findings provide additional evidence that internet access in the United States remains unaffordable and therefore inaccessible for many households, especially those that are considered low-income.
The FCC and Congress, which oversee the Lifeline program, should focus on expanding the program and connecting more low-income families. Lifeline has long suffered from underutilization and lack of public awareness. In 2018, only 25 percent of eligible households participated in the program; in Wyoming and Nebraska, the participation rate was just 3 percent.160 This participation rate has consistently declined in recent years, from 33 percent in 2016 to 28 percent in 2017.161 Unfortunately, the FCC has proposed new rules for Lifeline that have been described as “death by a thousand cuts” for the program.162 The FCC should abandon this misguided proposal and focus on efforts that will expand participation and increase the subsidy to cover a more meaningful portion of the cost of internet service.163
Moreover, Congress is currently considering multiple bills to help make internet service more affordable during the COVID-19 pandemic. One of the strongest proposals is the HEROES Act, which would establish a $50 monthly subsidy for qualifying low-income households and students to purchase internet service during the public health emergency. The bill passed the House in May and awaits consideration in the Senate.164
Congress Should Legalize Municipal Networks in Every State
Our research demonstrates that municipal networks deliver some of the most affordable and fastest internet service in the United States. However, municipal networks are not fully permitted under the laws of many states. At least 20 states restrict or outright prohibit these networks from existing. These laws must be repealed.
Municipal networks bring many benefits to communities. Our research on Ammon, Idaho shows how a municipal network can spark competition and significantly reduce prices.165 Wilson, N.C., offers another instructive example. When Wilson built out its municipal network called Greenlight, an incumbent cable company held rates flat even as it raised rates in nearby areas by up to 40 percent for comparable offerings.166 The competition introduced by the municipal network saved Wilson residents more than $1 million per year.167 One study found that, in 23 communities across the United States, municipally-owned fiber networks charged less than the incumbent private ISPs when averaged over four years, whereas private ISPs typically charged low initial rates that increased after 12 months.168
Unfortunately, large incumbent ISPs have lobbied at least 20 states to enact laws that effectively outlaw municipal networks—to protect the incumbents from having to compete against affordable, consumer-friendly services.169 The laws vary from state to state, with some explicitly prohibiting municipalities from selling telecommunications services, while other jurisdictions impose additional taxes on municipal networks or require that they get approval from a two-thirds supermajority of voters in costly and time-consuming ballot initiatives.170 In July 2020, the House of Representatives passed a bill that repeals these state laws and allow every community to invest in their own broadband infrastructure.171 Unfortunately, the Senate has not taken action on this bill. State legislatures could also repeal these laws without Congress’s help.
The Government Should Protect Consumers from Landlord-Tenant Scams and Digital Redlining
The internet services examined in our study are often not available to every resident in a city due to a variety of anti-consumer practices that limit consumer choice. The government should take steps to protect consumers from at least two of these practices: landlord exclusivity deals and digital redlining.
First, ISPs often broker special deals with landlords of apartment complexes and other multiple tenant environments (MTEs) that ensure only one ISP can serve the building’s tenants—even if multiple ISPs are equipped to serve the building.172 Because our research assesses internet services on a city-wide basis, we do not capture this dynamic in our report. However, this practice contributes to a longstanding inequity that harms many apartment dwellers and needlessly limits their options for internet service. These deals effectively give an ISP a monopoly on a building’s tenants, allowing the provider to raise prices or degrade service without fear of losing customers.173 The FCC tried to ban these exclusivity deals in the past, but ISPs found ways to circumvent the rules with new revenue-sharing schemes, bulk billing arrangements, and exclusive wiring deals. Congress should direct the FCC to close these loopholes once and for all.
Second, there is growing evidence that some ISPs purposefully neglect low-income neighborhoods. The National Digital Inclusion Alliance examined this practice, known as digital redlining, in a study that detailed AT&T’s “pattern of long-term, systematic failure to invest” in Cleveland, Ohio’s low-income neighborhoods.174 As AT&T upgraded service to more affluent neighbors, Cleveland’s poorest residents were left behind with antiquated networks that may not even meet the federal definition of broadband. This practice contributes to growing inequality and can deny people access to low-income discounts. For example, in April 2020, Verizon introduced a $20 discount for low-income consumers in response to the COVID-19 pandemic. The discount, which could bring the baseline price for internet service down to $19.99 per month, was only made available to customers of Verizon’s Fios service—which the company has not deployed in many low-income neighborhoods.175 Verizon has left many low-income areas with an antiquated DSL network that is ineligible for the discount.176 Congress and the FCC must address the willful neglect of low-income neighborhoods by prioritizing federal infrastructure funds for these areas and requiring that any ISP receiving subsidies must serve every household in a community, not just the most affluent.
The Government Should Strengthen Antitrust Enforcement in the Internet Services Market
Our research confirms that U.S. consumers pay more for internet access than consumers abroad. Economists like Thomas Philippon have attributed higher U.S. prices to a lack of competition and weak U.S. competition policy.177 As such, U.S. antitrust enforcers—namely the FCC and the Department of Justice (DOJ)—must do more to ensure a competitive marketplace and block harmful mergers that further undermine competition.
The U.S. market for internet service is dominated by just four companies: Comcast, AT&T, Verizon, and Charter. This lack of choice directly affects the cost and quality of internet service. Researchers have established that the number of providers in a given market correlates with competitive aspects, such as higher internet speeds.178 Research has also demonstrated that competition at the 1 Gbps speed level—the equivalent of 1,000 Mbps—leads to price reductions. For plans advertised between 25 Mbps and 1,000 Mbps download speed, the average price reduction is $13.28 to $29.08 per month. This research also found that each additional provider offering 1 Gbps service in a market reduces prices for comparable plans by $50 to $60 per month.179
Several recent antitrust investigations demonstrate the potential for anticompetitive harm in this sector. For example, when Comcast sought to acquire Time Warner Cable in 2014, the DOJ and the FCC found that the new company would be able to charge higher fees as a result of its increased size and would also prevent new entry into internet and video services markets.180 During the AT&T/DirecTV merger in 2015, the FCC concluded that the integrated company would have the incentive to engage in anticompetitive practices through data caps. The agency was concerned that the company might selectively target data caps to thwart competitors in the online video space.181
In such a consolidated market, there is potential for increasingly complex mergers involving ISPs. Future deals could challenge the government’s traditional lenses on vertical and horizontal mergers, but enforcers must be vigilant to scrutinize every transaction for innovative ways an ISP could use the merger to raise prices or otherwise adversely affect consumers.182
Antitrust enforcers have imposed merger conditions that create more affordable options, although these are imperfect solutions. For instance, Comcast agreed to offer high-speed internet access to 2.5 million low-income households for less than $10 per month as a condition of its acquisition of NBCUniversal in 2011.183 But many households did not qualify for the program, and the government struggled to monitor and enforce the condition. Moreover, Comcast openly boasted that the company had planned to offer the low-income service years earlier, but held back to entice the FCC to approve the NBCU transaction.184 This case study suggests that ISPs can offer low-income discounts without gaming the nation’s antitrust laws.
If enforcers ultimately permit a merger, conditions that create meaningful low-income discounts are better than no commitments at all. But there are long-term repercussions that come with consolidating private power: consumers are left with little to no choice once the commitments expire, and they become more susceptible to anticompetitive practices. It’s also difficult to hold companies accountable if they fail to meet the conditions or deliver the efficiencies they claimed when they sought regulatory approval.185 For instance, years after the Comcast/NBCU merger, the company is still criticized for failing to deliver on its commitments.186
Most recently, the T-Mobile/Sprint merger consolidated the market of wireless carriers from four to three—a critical tipping point in markets that often leads to price increases.187 Although we do not examine mobile wireless internet pricing in this report, it is important to note that mobile and fixed internet are not substitutes and exist in separate markets.
Ultimately, stronger enforcement of the nation’s antitrust laws could block anticompetitive ISP practices, prevent harmful mergers, or break up ISPs that have become too big. Better antitrust enforcement creates healthier markets, which leads to lower prices.
Citations
- “The Cost of Fixed-Line Broadband in 206 Countries,” Cable.co.uk, Existent Ltd., 2020, <a href="<a href="<a href="<a href="source">source">source">source">source">source
- See, e.g., Thomas Phillipon, The Great Reversal (Cambridge, MA: Belknap Press, 2019).
- David Leonhardt, “Big Business Is Overcharging You $5,000 a Year,” New York Times, November 10, 2019, <a href="<a href="<a href="<a href="source">source">source">source">source">source
- While this official definition for “broadband” exists, no government agency has set benchmarks for how to measure or verify these speeds. See, e.g., Peter Boothe and Georgia Bullen, “How fast is my Internet? Speed Tests, Accuracy, NDT & M-Lab,” Measurement Lab, March 26, 2019, <a href="<a href="<a href="<a href="source">source">source">source">source">source for more information.
- 2015 Broadband Progress Report and Notice of Inquiry on Immediate Action to Accelerate Deployment, Federal Communications Commission, adopted January 29, 2015, released February 4, 2015, <a href="<a href="<a href="<a href="source">source">source">source">source">source
- Jameson Zimmer, “FCC Broadband Definition Has Changed Before and Will Change Again,” BroadbandNow, February 10, 2018, <a href="<a href="<a href="<a href="source">source">source">source">source">source
- Statement of Commissioner Jessica Rosenworcel, Dissenting, “Fourteenth Broadband Deployment Report Notice of Inquiry,” Rosenworcel Dissenting Statement, adopted August 8, 2018, released: August 9, 2018, 14, <a href="<a href="<a href="<a href="source">source">source">source">source">source
- Amir Nasr, Eric Null, Joshua Stager, Reply Comments of New America’s Open Technology Institute, GN Docket No. 18-238, WC Docket No. 11-10, (October 1, 2018), <a href="<a href="<a href="<a href="source">source">source">source">source">source
- “A third of Americans live in a household with three or more smartphones,” Pew Research Center, May 25, 2017, <a href="<a href="<a href="<a href="source">source">source">source">source">source
- “Household Broadband Guide,” Federal Communications Commission, last modified February 5, 2020, <a href="<a href="<a href="<a href="source">source">source">source">source">source
- Jonathan Sallet, “Tell The Story We Know: Broadband Competition is Too Limited,” Benton Institute for Broadband & Society, March 6, 2020, <a href="<a href="<a href="<a href="source">source">source">source">source">source
- Frontier has since filed for bankruptcy and has sold its operations in Washington, Oregon, Idaho, and Montana. It maintains operations in 25 states. Jon Brodkin, “Frontier Files for Bankruptcy, Says Its Broadband Service Won’t Get Any Worse,” Ars Technica, April 15, 2020, <a href="<a href="<a href="<a href="source">source">source">source">source">source
- H. Trostle and Christopher Mitchell, Profiles of Monopoly: Big Cable and Telecom, (Institute for Local Self-Reliance, July 2018), <a href="<a href="<a href="<a href="source">source">source">source">source">source
- See, e.g., Claire Park, The Cost of Connectivity in West Virginia, (Washington, D.C.: New America’s Open Technology Institute, April 1, 2020), <a href="<a href="<a href="<a href="source">source">source">source">source">source ; and Bill Callahan, “AT&T’s Digital Redlining of Dallas: New Research by Dr. Brian Whitacre,” National Digital Inclusion Alliance, August 6, 2019, <a href="<a href="<a href="<a href="source">source">source">source">source">source
- See, e.g., Monica Anderson, “Mobile Technology and Home Broadband 2019,” Pew Research Center, June 13, 2019, <a href="<a href="<a href="<a href="source">source">source">source">source">source and John B. Horrigan and Maeve Duggan, “3. Barriers to Broadband Adoption: Cost is Now a Substantial Challenge For Many Non-Users,” Pew Research Center, December 21, 2015, <a href="<a href="<a href="<a href="source">source">source">source">source">source
- Emily A. Vogels, Andrew Perrin, Lee Rainie, and Monica Anderson, “53% of Americans Say the Internet Has Been Essential During the COVID-19 Outbreak,” Pew Research Center, April 30, 2020, <a href="<a href="<a href="<a href="source">source">source">source">source">source
- See, Emily A. Vogels, Andrew Perrin, Lee Rainie, and Monica Anderson, “53% of Americans Say the Internet Has Been Essential During the COVID-19 Outbreak,” Pew Research Center, April 30, 2020, <a href="<a href="<a href="<a href="source">source">source">source">source">source
- The 2014 report included 24 cities, and we include all but two of these cities in this year’s report. We omit Berlin, Germany because we were unable to find any standalone internet plans advertised on providers’ websites. We omit Bristol, Virginia because the city has since sold its municipal network: Brandon Bailey, “Sunset Digital to become Point Broadband,” NBC/CW WCYB-TV, May 2, 2019, <a href="<a href="<a href="source">source">source">source">source
- Bill Callahan, “AT&T’s Digital Redlining Of Cleveland,” National Digital Inclusion Alliance (blog), March 10, 2017, <a href="<a href="<a href="source">source">source">source">source
- Claire Park, The Cost of Connectivity in West Virginia, (Washington, D.C.: New America’s Open Technology Institute, April 1, 2020), <a href="<a href="<a href="source">source">source">source">source
- For instance, Sonic, an ISP that services the San Francisco and Los Angeles areas, offered bundle options with internet and phone services at the time of data collection. This approach means that at least several ISPs are excluded from our dataset.
- See, e.g., Amir Nasr, Claire Park, Eric Null, Comments of New America’s Open Technology Institute and Access Now, GN Docket No. 19-285, (November 21, 2019), <a href="<a href="<a href="source">source">source">source">source (“Specifically, mobile broadband is not a substitute for fixed broadband due to the functional difference in how consumers use the services. Mobile broadband is typically higher cost, less reliable (especially in rural areas), slower, and subject to data caps and expensive overage fees in comparison to fixed broadband. Further, mobile broadband is increasingly reliant on fixed broadband for backhaul and offloaded traffic. It would make no sense for the Commission to deem mobile broadband a substitute for fixed broadband when the former service is dependent on the latter.”)
- “Fixed Broadband Deployment,” Federal Communications Commission, June 2019, <a href="<a href="<a href="source">source">source">source">source
- Researchers’ language proficiencies included German, Korean, and Spanish.
- As indicated below, the lack of data is signified by “no data” or a “—” in our data visualization and appendices.
- For example, if a plan advertises a two-year contract with promotional pricing for the first 12 months, we calculate the average price for the entire contract term and record it as the monthly promotional price. For this particular example, we would take the average of 12 months at the promotional price and the sum of 12 months at the non-promotional price.
- 2019 Broadband Deployment Report, Federal Communications Commission, adopted May 8, 2019, released May 29, 2019<a href="<a href="<a href="source">source">source">source">source
- We record rental fees for Comcast’s wireless gateway under “modem rental fees” throughout our dataset and note that a consumer would not have to pay an additional fee to rent a router.
- See Becky Chao and Lukas Pietrzak, The Cost of Connectivity in Ammon, Idaho, (Washington, D.C.: New America’s Open Technology Institute, January 22, 2020), <a href="<a href="<a href="source">source">source">source">source for more information.
- “Google Fiber Fee Schedule,” Google Fiber, last modified April 13, 2020, <a href="<a href="<a href="source">source">source">source">source
- WTFee Survey 2018 Nationally Representative Multi-Mode Survey, (Consumer Reports: January 3, 2019), <a href="<a href="<a href="source">source">source">source">source ; Karl Bode, “Hidden Fees Mean US Cable & Broadband Bills Can Be 45% Higher Than Advertised,” techdirt, October 1, 2019, <a href="<a href="<a href="source">source">source">source">source
- “GDP, PPP (current international $),” World Bank, <a href="<a href="<a href="source">source">source">source">source
- Lifeline is the federal subsidy program for internet and phone services. For more information, see “What is Lifeline?” in the “COVID-19 Exacerbates Affordability Problems, Particularly for BIPOC Communities and Low-income Households” section of this report.
- “Lifeline,” Community Development Program, CenturyLink, last accessed May 27, 2020, <a href="<a href="<a href="source">source">source">source">source
- “Frontier Lifeline Program,” Frontier Communications Corporation, last accessed May 27, 2020, <a href="<a href="<a href="source">source">source">source">source
- “Lifeline,” RCN telecom Services, last accessed May 27, 2020, <a href="<a href="<a href="source">source">source">source">source
- “Frequently Asked Questions,” Low-Cost Home Internet, AT&T, last accessed May 27, 2020, <a href="<a href="<a href="source">source">source">source">source
- “Spectrum Internet Assist,” Charter Communications, last accessed May 27, 2020, <a href="<a href="<a href="source">source">source">source">source
- “Internet Essentials Brings Affordable High-Speed Internet Home,” Internet Essentials, Comcast, last accessed May 27, 2020, <a href="<a href="<a href="source">source">source">source">source
- Tyler Cooper, “DSL vs Cable vs Fiber: Comparing Internet Options,” BroadbandNow, last updated December 12, 2019, <a href="<a href="<a href="source">source">source">source">source
- Cooper, “DSL vs Cable vs Fiber: Comparing Internet Options.”
- Our analysis on monthly internet prices throughout this report defaults to promotional pricing, unless no information on promotional pricing is provided, in which case, we adopt the non-promotional pricing for that plan instead. We note all other exceptions to this rule.
- Visnja Cik Krizanovic, Drago Zagar, and Kresimir Grgic, “A framework for optimal techno-economic assessment of broadband access solutions and digital inclusion of rural population in global information society,” Universal Access Information Society, 17 (2018): 517–540, <a href="<a href="<a href="source">source">source">source">source
- More information on the differences between a modem and router are detailed in the “Focus on the Fees” section.
- Advertised data provides the best publicly available information on internet pricing in the United States, as no government agency collects this information.
- The estimate for Asia is limited by the lack of data on self-installation fees among Asian providers and activation fees for Hong Kong and Tokyo providers in our dataset. In addition, our dataset does not include information on Wi-Fi router purchase fees in Seoul or Tokyo and modem purchase fees in Hong Kong or Seoul because providers in our dataset do not advertise them. As a result, this estimate for total one-time costs a consumer in Asia would pay for self-installation and equipment purchases only includes the average modem purchase fee in Tokyo.
- Fiber penetration in the United States is 15.55 percent, while the average among OECD countries is 26.81 percent. “OECD broadband statistics update,” Organization for EconomicCo-operation and Development, March 3, 2020, <a href="<a href="source">source">source">source
- The United States has the most expensive average and median monthly prices for fiber-based plans coming to $79.92 and $57.99 whereas in South Korea, which has the highest in fiber penetration rate according to the OECD, fiber-based plans cost on average $31.71 a month and median monthly prices are $30.42. Within our dataset, Denmark, France, Latvia, and Japan, which among the OECD countries rank higher in fiber penetration rates than the United States, also have lower monthly prices for fiber-based plans on average and median than the United States. Organization for Economic Co-operation and Development, “OECD broadband statistics update.”
- Organization for Economic Co-operation and Development, “OECD broadband statistics update.”
- See, e.g., H. Trostle and Christopher Mitchell, Profiles of Monopoly:Big Cable and Telecom, (Institute for Local Self-Reliance, July 2018), <a href="<a href="source">source">source">source
- Hong Kong’s average monthly internet price of $148.92 represents an outlier that pulls the average for Asia upward.
- Inti Pacheco and Shalini Ramachandran, “Do You Pay Too Much for Internet Service? See How Your Bill Compares,” Wall Street Journal, December 24, 2019, <a href="<a href="source">source">source">source
- See Appendix A for population density sources.
- Seoul is excluded from this calculation because the plans in our dataset did not include information on advertised upload speeds.
- In the absence of government collection of pricing data or ISP disclosure of their records, advertising remains one of the best available sources of public information on internet pricing.
- Similar to our analysis on monthly internet prices, we look only at the monthly price that ISPs advertise for internet access and exclude monthly or one-time autopay/paperless billing discounts, data overage penalties, equipment fees, installation fees, and activation fees in our analysis on monthly internet prices.
- Amir Nasr, Eric Null, Joshua Stager, Reply Comments of New America’s Open Technology Institute, GN Docket No. 18-238, WC Docket No. 11-10, (October 1, 2018), <a href="<a href="source">source">source">source
- Users require higher upload speeds to ensure they have enough capacity to run a query on a search engine, post or send a picture, or communicate with someone via video conferencing. Often, users are performing multiple tasks at once, making upload speeds even more important. See, e.g., Becky Chao, Sarah Morris, Amir Nasr, Eric Null, Joshua Stager, Comments of New America’s Open Technology Institute, GN Docket No. 18-238, GN Docket No. 18-231, WC Docket No. 11-10, September 17, 2018, <a href="<a href="source">source">source">source ; Christine Ottoni, “Content creators can do more with the fastest Internet,” Ting Wake Forest News, Ting, April 3, 2019, <a href="<a href="source">source">source">source ; Peter Christiansen, ed. Cara Haynes, “What Is a Good Download and Upload Speed?” HighSpeedInternet.com, June 2, 2020, <a href="<a href="source">source">source">source ; and Alex Bybyk, “What is a good upload speed for streaming?” Restream, August 19, 2019, <a href="<a href="source">source">source">source
- Statement of Commissioner Jessica Rosenworcel, Dissenting, “Fourteenth Broadband Deployment Report Notice of Inquiry,” Rosenworcel Dissenting Statement, adopted August 8, 2018, released: August 9, 2018, 14, <a href="<a href="source">source">source">source
- We calculated this number by taking the average difference between installation and self-installation fees for all plans that specified both.
- “What is a Modem,” Linksys, last accessed May 27, 2020, <a href="source">source">source
- Melanie Pinola, “Understanding Wi-Fi and How It Works,” Lifewire, May 1, 2020, <a href="source">source">source
- Molly McLaughlin, “Modem vs. Router: How Do They Differ?” Lifewire, April 9, 2020,<a href="source">source">source ; “Router vs. Modem: What’s the Difference?” Comcast, February 8, 2019, <a href="source">source">source
- This combined price excludes other fees that a consumer would have to pay, such as installation fees, activation fees, and data overage penalties.
- The average data overage penalty fee was calculated using the average data overage penalty for Toronto ISP Ebox, which came to $20.29/GB. Ebox does not specify one fee, but charges between $0.40 and $40.17 per GB over the data cap, so the average overage penalty was calculated assuming one plan charged the lowest end of the range, and another charged the highest. Swisscom in Zurich, eo Hikari, NTT East, and Softbank in Tokyo, Wave in Seattle, and Netvigator in Hong Kong, specify data caps but not the corresponding penalty.
- Danielle Kehl and Patrick Lucey, Artificial Scarcity: How Data Caps Harm Consumers and Innovation, (Washington, DC: New America, June 2015), <a href="source">source">source
- See, e.g., United States Government Accountability Office, Broadband Internet: FCC Should Track the Application of Fixed Internet Usage-Based Pricing and Help Improve Consumer Education, (Washington, DC: United States Government Accountability Office, November 2014),<a href="source">source">source
- See, e.g., Katie Watson, “Data Caps and Vulnerable Populations,” February 4, 2016, Benton Institute for Broadband & Society, <a href="source">source">source
- Katie Watson, “Data Caps and Vulnerable Populations,” February 4, 2016, Benton Institute for Broadband & Society, <a href="source">source">source
- See, e.g.,”Reducing Zoom Data and Bandwidth Use,” Cornell University, last updated March 27, 2020, <a href="source">source">source
- See, e.g., Applications of AT&T Inc. and DIRECTV for Consent to Assign or Transfer Control of Licenses and Authorizations, MB Docket No. 14-90, Memorandum Opinion and Order, para. 213, <a href="source">source">source
- While AT&T isn’t implementing this self-preferencing on its home internet plans at this time, the lack of sufficient guardrails in the form of net neutrality protections does not rule out this possibility in the future; Nilay Patel, “HBO Max won’t hit AT&T data caps, but Netflix and Disney Plus will,” Verge, June 2, 2020, <a href="source">source">source ; Jon Brodkin, “AT&T exempts HBO Max from data caps but still limits your Netflix use,” Ars Technica, June 2, 2020, <a href="source">source">source
- Rob Pegoraro, The Coronavirus Might Have Just Killed ISP Data Caps,” Fast Company, March 21, 2020, <a href="source">source">source
- Kathleen Burke, “Keep All Americans Connected By Prohibiting Data Caps During the COVID-19 Pandemic,” Public Knowledge (blog), March 27, 2020, <a href="source">source">source
- Jon Brodkin, “Comcast waiving data caps hasn’t hurt its network—why not make it permanent?,” Ars Technica, March 31, 2020, <a href="source">source">source
- Danielle Kehl and Patrick Lucey, Artificial Scarcity: How Data Caps Harm Consumers and Innovation, (Washington, DC: New America, June 2015), 7, <a href="source">source">source
- Tyler Cooper, “Internet Contracts and Fees: what you need to know,” BroadbandNow, July 16, 2018, <a href="source">source">source
- We calculate the average early contract termination fee using two data points for the Magnet plan advertised in Dublin. Magnet charges between $124.62 and $249.25 for early contract termination. We include one data point for the minimum fee and another for the maximum, coming to an average contract termination fee of $186.94 for Magnet.
- We calculated this number by taking the average difference between early termination fees for plans that advertised same speeds, but different monthly prices for different contract lengths.
- See, e.g., Oren Bar-Gill and Omri Ben-Shahar, “Exit from Contract,” Journal of Legal Analysis, 6 no.1, (October 2014): 151–183, <a href="source">source">source
- Oren Bar-Gill and Omri Ben-Shahar, “Exit from Contract.”
- Tom Wheeler, “Prepared Remarks of FCC Chairman Tom Wheeler: ‘The Facts and Future of Broadband Competition,’” Federal Communications Commission, September 4, 2014, <a href="source">source">source
- See H. Trostle and Christopher Mitchell, Profiles of Monopoly:Big Cable and Telecom, (Institute for Local Self-Reliance, July 2018), <a href="source">source">source
- “Contract Buyout Eligibility and Redemption Details,” Residential Terms of Service, Charter Communications, last accessed May 27, 2020, <a href="source">source">source
- “Early Termination Fee Instructions,” Verizon, last accessed May 27, 2020, <a href="source">source">source
- See, e.g., Oren Bar-Gill and Omri Ben-Shahar, “Exit from Contract,” Journal of Legal Analysis, 6 no.1, (October 2014): 151–183, <a href="source">source">source
- See, e.g., “Early Termination Fee Instructions,” Verizon, last accessed May 27, 2020, <a href="source">source">source
- This plan count excludes six plans with identical monthly prices for different contract terms. The plans excluded are identified in our methodology.
- We calculate the average price for all plans in our dataset using the promotional price for each entry unless it is not available, in which case, we use the non-promotional price instead. Because providers do not always offer plans with promotional pricing or disclose non-promotional pricing, this average captures our dataset most comprehensively.
- “Community Network Map,” Institute for Local Self-Reliance, updated January 2020, source">source
- Claire Park, Community Broadband: The Fast, Affordable Internet Option That's Flying Under the Radar (Washington, D.C.: New America, 2020), source">source ;Becky Chao and Lukas Pietrzak, The Cost of Connectivity in Ammon, Idaho, (Washington, D.C.: New America’s Open Technology Institute, January 22, 2020), source">source
- We exclude any additional fees that apply to plans operating on municipal networks in our analysis. In Ammon, Idaho, for example, consumers of the city’s open access network are subject to an additional monthly utility fee of $16.50 and separate construction fee paid to the city, on top of the monthly price paid to the provider. See Becky Chao and Lukas Pietrzak, The Cost of Connectivity in Ammon, Idaho, (Washington, D.C.: New America’s Open Technology Institute, January 22, 2020), source">source for more information.
- This comparison only includes monthly internet costs and excludes any additional fees. For the private network comparison, we use the average cost per Mbps based on monthly prices and speeds advertised by AT&T in Lafayette, La.
- This comparison only includes monthly internet costs and excludes any additional fees. See Becky Chao and Lukas Pietrzak, The Cost of Connectivity in Ammon, Idaho, (Washington, D.C.: New America’s Open Technology Institute, January 22, 2020), source">source for more information.
- Jon Brodkin, “Comcast, Beware: New city-run broadband offers 1Gbps for $60 a month,” Ars Technica, August 30, 2019, source">source
- Dan Mahoney and Greg Rafert, “Broadband Competition Helps to Drive Lower Prices and Faster Download Speeds for U.S. Residential Consumers,” Analysis Group Whitepaper, November 2016, 21-22, 24, source">source
- Rafi Goldberg, “Unplugged: NTIA Survey Finds Some Americans Still Avoid Home Internet Use,” National Telecommunications and Information Administration, April 15, 2019, source">source
- Elise Gould, “Black-white wage gaps are worse today than in 2000,” Economic Policy Institute, February 27, 2020, source">source
- See, e.g., S. Derek Turner, Digital Denied: The Impact of Systemic Racial Discrimination on Home-Internet Adoption, (Free Press: December 2016), source">source; Robert Fairlie, “Race and the Digital Divide,” UC Santa Cruz: Department of Economics, UCSC, September 11, 2014, source">source
- Brian Howard and Traci Morris, Tribal Tech Assessment: The State of Internet Service on Tribal Lands, (American Indian Policy Institute: July 27, 2019), source">source
- See, e.g., S. Derek Turner, Digital Denied: The Impact of Systemic Racial Discrimination on Home-Internet Adoption, (Free Press: December 2016), source">source; AT&T has also allegedly engaged in “digital redlining” in Cleveland, Ohio, see, e.g., Bill Callahan, “AT&T’s Digital Redlining Of Cleveland,” National Digital Inclusion Alliance (blog), March 10, 2017, source">source
- Darrick Hamilton, Preface, Dedrick Asante-Muhammad, Chuck Collins, and Omar Ocampo, White Supremacy is the Preexisting Condition: Eight Solutions to Ensure Economic Recovery Reduces the Racial Wealth Divide, Institute for Policy Studies, June 19, 2020, source">source; See, also, Ernie Tedeschi and Quoctrung Bui, “Unemployment Tracker: Job Losses for Black Workers Are Deepening,” New York Times, last updated June 16, 2020, source">source
- Emily A. Vogels, Andrew Perrin, Lee Rainie, and Monica Anderson, “53% of Americans Say the Internet Has Been Essential During the COVID-19 Outbreak,” Pew Research Center, April 30, 2020, source">source
- Emily A. Vogels, Andrew Perrin, Lee Rainie, and Monica Anderson, “53% of Americans Say the Internet Has Been Essential During the COVID-19 Outbreak.”
- See, e.g., By Suzanne Woolley, Nikitha Sattiraju, and Scott Moritz, “U.S. Schools Trying to Teach Online Highlight a Digital Divide,” Bloomberg, March 26, 2020,source">source
- Emily A. Vogels, Andrew Perrin, Lee Rainie, and Monica Anderson, “53% of Americans Say the Internet Has Been Essential During the COVID-19 Outbreak,” Pew Research Center, April 30, 2020, source">source
- See, e.g., Brian Howard and Mikhail Sundust, “COVID-19: The Impact of Limited Internet Access and Issues with Social Distancing for Native Students,” American Indian Policy Institute, Spring 2020, source">source
- Jonathan Sallet, “Tell The Story We Know: Broadband Competition is Too Limited,” Benton Institute for Broadband & Society, March 6, 2020, source">source
- A report from the Benton Institute for Broadband and Society found that low-income participants in the Twin Cities, Minnesota were able to afford internet services offered by non-profit partnership programs at $10 per month. Colin Rhinesmith, Digital Inclusion and Meaningful Broadband Adoption Initiatives, (Evanston, IL: Benton Institute for Broadband and Society, January 2016), source">source
- This plan count excludes six plans that offer the same monthly price at different contract terms. The excluded plans are disclosed in our “Methodology” section.
- This average was calculated for the 64 plans that offered an initial promotional price of $50 and under and advertised the non-promotional price on their websites. Plans that did not disclose non-promotional prices were excluded from this calculation.
- For instance, community members enrolled in a non-profit partnership program offering internet access for $10 a month have said that increasing the cost to $20 a month would pose financial difficulties. Colin Rhinesmith, Digital Inclusion and Meaningful Broadband Adoption Initiatives, (Evanston, IL: Benton Institute for Broadband and Society, January 2016), source">source
- This plan count excludes six plans that offer the same monthly price at different contract terms. The excluded plans are disclosed in our “Methodology” section.
- See Becky Chao and Lukas Pietrzak, The Cost of Connectivity in Ammon, Idaho, (Washington, D.C.: New America’s Open Technology Institute, January 22, 2020), source">source for more information.
- Providers abroad did not appear to advertise similar discounts.
- See, e.g., Xavier Jaravel, The Unequal Gains from Product Innovations: Evidence from the U.S. Retail Sector, The Quarterly Journal of Economics 134, issue 2, (May 2019): 715–783, source">source
- Bourree Lam, “The Surging Cost of Basic Needs,” Atlantic, June 2, 2016, source">source
- Sarah Morris, Joshua Stager, Eric Null, Amir Nasr, Becky Chao, Comments of New America’s Open Technology Institute in the Matter of Bridging the Digital Divide for Low-Income Consumers, WC Docket No. 17-287, (February 21, 2018), source">source
- “Spectrum Internet Assist,” Charter, last accessed May 27, 2020, source">source
- AT&T provides the fastest speed available at a consumer’s residence. “Frequently Asked Questions,” Low-Cost Home Internet, AT&T, last accessed May 27, 2020, source">source
- At $5 a month, the AT&T plan charges low-income consumers by 10.42 times more than the average cost of plans in our U.S. dataset.
- Amir Nasr and Claire Park, “The Government Is Severing a Lifeline for Low-Income Americans,” New America Weekly, March 5, 2020, source">source ; Federal Communications Commission, Fifth Report and Order, Memorandum Opinion and Order on Reconsideration, and Further Notice of Proposed Rulemaking, WC Docket No. 17-287, WC Docket No. 11-42, WC Docket No. 09-197, adopted October 30, 2019, released November 14, 2019,source">source
- See, e.g. “AT&T to Pay $60 Million to Resolve FTC Allegations It Misled Consumers with ‘Unlimited Data’ Promises,” Federal Trade Commission, November 5, 2019, source">source
- We calculate this average for the 299 plans that providers advertised both promotional and non-promotional pricing for. Plans that did not disclose either promotional or non-promotional prices are excluded from this calculation.
- We calculate this average for the 140 plans that providers advertised both promotional and non-promotional pricing for. Plans that did not disclose either promotional (meaning that providers did not offer promotional pricing) or non-promotional prices are excluded from this calculation.
- We calculate the size of the price increase for the 140 plans with both advertised promotional and non-promotional pricing by taking the size of the promotional and dividing it by the initial promotional price.
- See David Talbot, Kira Hessekiel, and Danielle Kehl, Community Owned Fiber Networks: Value Leaders in America, (Cambridge, MA: Berkman KleinCenter for Internet & Society, 2017), source">source
- “14. Acceptable Use,” AT&T Website Terms of Use, AT&T, effective January 2020, source">source ; “Century Link Website User Agreement,” CenturyLink, effective June 1, 2014, source">source
- “Terms and Conditions,” Verizon, last accessed May 27, 2020, source">source
- “AT&T Internet Consumer Fee Schedule,” Legal Policy Center, AT&T, source">source; “AT&T Internet Consumer Fee Schedule,” AT&T, source">source
- Caroline Cakebread, “You're not alone, no one reads terms of service agreements,” Business Insider, November 15, 2017, source">source
- See, e.g., Oren Bar-Gill and Omri Ben-Shahar, “Exit from Contract,” Journal of Legal Analysis, 6 no.1, (October 2014): 151–183, source">source
- WTFee Survey 2018 Nationally Representative Multi-Mode Survey, (Consumer Reports: January 3, 2019), source">source
- WTFee Survey 2018 Nationally Representative Multi-Mode Survey, (Consumer Reports: January 3, 2019)
- “Taxes and Surcharges,” Understand My Bill, Frontier, last accessed May 27, 2020, source">source
- “US cable and fixed telecom bundle rates up to 45% higher than advertised,” GlobalData, September 27, 2019, source">source
- Jon Brodkin, “US Finally Prohibits ISPs From Charging for Routers They Don’t Provide,” Ars Technica, January 7, 2020, source">source ; Frontier has also since gone bankrupt.
- Federal Communications Commission, Report and Order On Remand, Declaratory Ruling, and Order, GN Docket No. 14-28, adopted February 26, 2015, released March 12, 2015, 80, source">source
- Amir Nasr, “Why We Can’t Forget Cost When Discussing Broadband Mapping,” New America Weekly, June 20, 2019, source
- “Fixed Broadband Deployment Data from FCC Form 477,” Federal Communications Commission, updated March 12, 2020, source
- See, e.g., Max Garland, “WV Broadband Council Chairman Blasts FCC Report, Says Data Isn't Correct,” Charleston Gazette-Mail, February 8, 2018, source and Katy Rossiter, “What Are Census Blocks?” United States Census Bureau, July 11, 2011, source
- Federal Communications Commission, FCC Form 477 Local Telephone Competition and Broadband Reporting Instructions for Filings as of December 31, 2019 and Beyond, (Federal Communications Commission: May 21, 2020), source
- Amir Nasr, “Why We Can’t Forget Cost When Discussing Broadband Mapping,” New America Weekly, June 20, 2019, source ; “OTI to FCC: Broadband is Not Reaching All Americans,” New America’s Open Technology Institute (blog), September 19, 2018, source ; “OTI Submits Reply Comments Urging FCC To Strengthen Section 706 Review Process,” New America’s Open Technology Institute (blog), October 4, 2018, source
- See, e.g., H. Trostle, Christopher Barich, and Christopher Mitchell, Broadband Competition in the Rochester Region: Reality vs Federal Statistics, (Institute for Local Self-Reliance), August 2018, source ; “Manchin: FCC Broadband Report is Plain Wrong,” (press release), May 1, 2020, source ; April Simpson, “Can You Hear Me Now? In Quest for Federal Money, States Debunk Mobile Providers’ Coverage Claims,” Pew Charitable Trusts, January 23, 2019, source
- Ross Schulman, Georgia Bullen, Nick Thieme, “The United States of Broadband Map: Mapping the Gulf Between the Broadband Speeds That ISPs Report and Those Measured by Consumers,” New America’s Open Technology Institute, last updated on July 17th, 2019, source
- A survey published by the Pew Research Center in 2019 revealed that whereas 81 percent of households with incomes between $30,000 and $99,000 have home high-speed broadband service, 44 percent of adults with household incomes below $30,000 a year do not. Monica Anderson and Madhumitha Kumar, “Digital divide persists even as lower-income Americans make gains in tech adoption,” Pew Research Center, May 7, 2019, source
- Moving Forward Act, H.R. 2, 116th Congress (2020). source
- See, e.g., Jon Brodkin, “Lawsuit forces CenturyLink to stop charging ‘Internet Cost Recovery Fee’,” Ars Technica, December 11, 2019, source
- Jonathan Schwantes, How Cable Companies Use Hidden Fees to Raise Prices and Disguise the True Cost of Service, (Consumer Reports: October 2019), source
- Emily Hong, Laura Moy, and Isabelle Styslinger, Broadband Truth-in-Labeling: Empowering Consumer Choice Through Standardized Disclosure, (New America’s Open Technology Institute: July 2015), source ; See, also, Broadband Truth-in-Labeling, (New America’s Open Technology Institute: 2009), source
- Consumer and Governmental Affairs, Wireline Competition, and Wireless Telecommunications Bureaus Approve Open Internet Broadband Consumer Labels,” Public Notice, GN Docket No. 14-28, Federal Communications Commission, April 4, 2016, source
- Moving Forward Act, H.R. 2, 116th Congress (2020). source
- Cecilia Kang, “Comcast is Trying to Improve Its Image With a Program for Low-Income Consumers,” Washington Post, May 9, 2014, source
- Jonathan Sallet, Broadband For America’s Future: A Vision For the 2020s, (Evanston, IL: Benton Institute for Broadband & Society, October 2019, source
- Fybercom and QWK in Ammon, Idaho advertise service for a monthly price of $9.98 and $9.38 respectively, but these prices do not include the monthly utility, construction, and other fees subscribers pay. See Becky Chao and Lukas Pietrzak, The Cost of Connectivity in Ammon, Idaho, (Washington, D.C.: New America’s Open Technology Institute, January 22, 2020), source
- Universal Service Administrative Company, “Lifeline Participation,” Program Data, last accessed May 27, 2020, source ; Wyoming and Nebraska share the lowest participation rate among those eligible for Lifeline. The participation rate is estimated to have dropped even further since 2018 to 18 percent in 2019. See Comments of Free Press, WC Docket No. 17-287, WC Docket No. 11-42, WC Docket No. 09-197, Jan. 27, 2020, 11, source
- Universal Service Monitoring Report, CC Docket No. 96-45 WC Docket No. 02-6 WC Docket No. 02-60 WC Docket No. 06-122 WC Docket No. 10-90 WC Docket No. 11-42 WC Docket No. 13-184 WC Docket No. 14-58, 2018, 27, source
- “OTI Urges FCC to Abandon “Misguided and Cynical” Lifeline Proposal,” New America’s Open Technology Institute (press release), January 27, 2020, source
- “OTI Urges FCC to Strengthen Lifeline Safety Net Program During COVID-19 Pandemic,” New America’s Open Technology Institute (press release), March 23, 2020, source
- Health and Economic Recovery Omnibus Emergency Solutions Act (HEROES Act), H.R. 6800, 116th Congress, §2 (2020).
- Becky Chao and Lukas Pietrzak, The Cost of Connectivity in Ammon, Idaho, (Washington, D.C.: New America’s Open Technology Institute, January 22, 2020), source
- Jonathan Sallet, Broadband for America’s Future: A Vision for the 2020s, (Evanston, IL: Benton Institute for Broadband and Society, October 2019), 50, source
- Jonathan Sallet, Broadband for America’s Future: A Vision for the 2020s, 50.
- David Talbot, Kira Hessekiel, and Danielle Kehl, Community-OwnedFiber Networks: Value Leaders in America, (Cambridge, MA: Berkman Klein Center for Internet and Society, January 2018), source
- See, e.g., “State Restrictions on Community Broadband Services or Other Public Communications Initiatives,” Baller Stokes and Lide, July 1, 2019, source ; Kendra Chamberlain, “Municipal Broadband Is Roadblocked Or Outlawed In 22 States,” BroadbandNow, May 13, 2020, source
- “State Restrictions on Community Broadband Services or Other Public Communications Initiatives,” Baller Stokes and Lide, July 1, 2019, source
- Moving Forward Act, H.R. 2, 116th Congress (2020). source; see also Senator Cory Booker, “Community Broadband Act of 2017,” 115th Congress 1st Session, source
- See Charles Barr, Lisa Gonzalez, and Christopher Mitchell, “Transcript: Community Broadband Bits Episode 197,” Institute for Local Self-Reliance, April 21, 2016, source
- See Susan Crawford, “The New Payola: Deals Landlords Cut with Internet Providers,” Wired, June 27, 2016, source ; Broadband Now, The Broadband Report, “Apartment Landlords Are Holding Your Internet Hostage,” July 14, 2016, source
- Connect Your Community and the National Digital Inclusion Alliance, “AT&T’s Digital Redlining Of Cleveland,” (Mar. 10, 2017) (“Specifically, AT&T has chosen not to extend its “Fiber To the Node” VDSL infrastructure – which is now the standard for most Cuyahoga County suburbs and other urban AT&T markets throughout the U.S. – to the majority of Cleveland Census blocks, including the overwhelming majority of blocks with individual poverty rates above 35%”).
- Jon Brodkin, “Verizon refuses to give DSL users its low-income deals during pandemic,” Ars Technica, April 7, 2020, source
- Katie Kienbaum, “Monopoly ISPs Too Big to Make Good on Covid-19 Internet Offers,” Institute for Local Self-Reliance, April 10, 2020, source
- See, Thomas Phillipon, The Great Reversal (Cambridge, MA: Belknap Press, 2019).
- See, e.g, Scott Wallsten and Colleen Mallahan, “residential Broadband Competition in the United States,” March 2010, source ; this study uses FCC Census tract data, which may not accurately reflect experienced speeds or number of providers available in a given market.
- Jonathan Sallet, Broadband for America’s Future: A Vision for the 2020s, (Evanston, IL: Benton Institute for Broadband and Society, October 2019), 49, source
- Nicholas Hill, Nancy L. Rose, and Tor Winston, “Economics at the Antitrust Division 2014–2015: Comcast/Time Warner Cable and Applied Materials/Tokyo Electron.”
- Charlotte Slaiman and Joshua Stager, Comments on the Draft Vertical Merger Guidelines to the Federal Trade Commission by Public Knowledge and New America’s Open Technology Institute, submitted February 26, 2020,source
- Federal Communications Commission, Comcast Corporation and NBC Universal, MB Docket 10-56, para 6, source
- Lisa Gonzelez, “Comcast Gamed FCC for Internet Essentials ‘Concession’ in NBC Merger,” Institute for Local Self-Reliance, December 3, 2012, source
- See, e.g., Charlotte Slaiman and Joshua Stager, Comments on the Draft Vertical Merger Guidelines to the Federal Trade Commission by Public Knowledge and New America’s Open Technology Institute, submitted February 26, 2020,source
- Emily Steel, “Comcast Critics Cast Doubt on Its Intentions,” New York Times, April 23, 2015, source
- See “T-Mobile Completes Merger with Sprint to Create the New T-Mobile,” T-Mobile, April 1, 2020, source ; Yosef Getachew, Jonathan Schwantes, Goergeo Slover, Joshua Stager, Amir Nasr, Becky Chao, Michael Calabrese, Philip Berenbroick, Dylan Gilbert, Laura Blum-Smith, Petition to Deny of Common Cause, Consumers Union, New America’s Open Technology Institute, Public Knowledge and Writers Guild of America, West, Inc., WT Docket No. 18-197, source
Conclusion
Overall, we find that U.S. consumers can still expect to pay more on average for monthly internet prices than consumers abroad. Europe also consistently leads on offering the most affordable prices for minimum advertised broadband speed tiers. From plans that meet the current FCC definition for broadband at 25/3 Mbps to bigger, bolder standards, U.S. consumers pay more for monthly internet prices on average than European consumers based on advertised metrics. In addition, cities in Asia lead on setting international standards for speed and value based on average monthly price per Mbps in advertised download speed. Nonetheless, we find that municipal networks in the United States offer some of the fastest advertised speeds available in the country at relatively affordable prices—and come close to matching the top speeds globally.
With this latest iteration of our Cost of Connectivity study, we hope to better inform targeted policy decisions at the federal, state, and local level. We also offer policy recommendations to improve affordability and access. First, the government must collect better data about internet prices and availability. Second, consumers need greater transparency to understand the total costs they can expect to pay for internet service. Third, the Lifeline program and other low-income discount programs should be expanded to help low-income households access more affordable internet access. Fourth, Congress should legalize municipal networks that offer lower prices and faster speeds. Fifth, the government should protect consumers from landlord-tenant scams and digital redlining. Lastly, the government should strengthen antitrust enforcement to promote competition and lower prices.
Our research demonstrates that internet pricing is complex and obscure. Yet, it is nonetheless a critical piece of information that can guide policies to expand internet access and adoption. With this year’s Cost of Connectivity report, we continue to find evidence of an affordability crisis in the United States. There has never been a greater need for policies that promote competition, increase billing transparency, and make internet service more affordable for more people.
Citations
- “The Cost of Fixed-Line Broadband in 206 Countries,” Cable.co.uk, Existent Ltd., 2020, <a href="<a href="<a href="<a href="<a href="source">source">source">source">source">source">source
- See, e.g., Thomas Phillipon, The Great Reversal (Cambridge, MA: Belknap Press, 2019).
- David Leonhardt, “Big Business Is Overcharging You $5,000 a Year,” New York Times, November 10, 2019, <a href="<a href="<a href="<a href="<a href="source">source">source">source">source">source">source
- While this official definition for “broadband” exists, no government agency has set benchmarks for how to measure or verify these speeds. See, e.g., Peter Boothe and Georgia Bullen, “How fast is my Internet? Speed Tests, Accuracy, NDT & M-Lab,” Measurement Lab, March 26, 2019, <a href="<a href="<a href="<a href="<a href="source">source">source">source">source">source">source for more information.
- 2015 Broadband Progress Report and Notice of Inquiry on Immediate Action to Accelerate Deployment, Federal Communications Commission, adopted January 29, 2015, released February 4, 2015, <a href="<a href="<a href="<a href="<a href="source">source">source">source">source">source">source
- Jameson Zimmer, “FCC Broadband Definition Has Changed Before and Will Change Again,” BroadbandNow, February 10, 2018, <a href="<a href="<a href="<a href="<a href="source">source">source">source">source">source">source
- Statement of Commissioner Jessica Rosenworcel, Dissenting, “Fourteenth Broadband Deployment Report Notice of Inquiry,” Rosenworcel Dissenting Statement, adopted August 8, 2018, released: August 9, 2018, 14, <a href="<a href="<a href="<a href="<a href="source">source">source">source">source">source">source
- Amir Nasr, Eric Null, Joshua Stager, Reply Comments of New America’s Open Technology Institute, GN Docket No. 18-238, WC Docket No. 11-10, (October 1, 2018), <a href="<a href="<a href="<a href="<a href="source">source">source">source">source">source">source
- “A third of Americans live in a household with three or more smartphones,” Pew Research Center, May 25, 2017, <a href="<a href="<a href="<a href="<a href="source">source">source">source">source">source">source
- “Household Broadband Guide,” Federal Communications Commission, last modified February 5, 2020, <a href="<a href="<a href="<a href="<a href="source">source">source">source">source">source">source
- Jonathan Sallet, “Tell The Story We Know: Broadband Competition is Too Limited,” Benton Institute for Broadband & Society, March 6, 2020, <a href="<a href="<a href="<a href="<a href="source">source">source">source">source">source">source
- Frontier has since filed for bankruptcy and has sold its operations in Washington, Oregon, Idaho, and Montana. It maintains operations in 25 states. Jon Brodkin, “Frontier Files for Bankruptcy, Says Its Broadband Service Won’t Get Any Worse,” Ars Technica, April 15, 2020, <a href="<a href="<a href="<a href="<a href="source">source">source">source">source">source">source
- H. Trostle and Christopher Mitchell, Profiles of Monopoly: Big Cable and Telecom, (Institute for Local Self-Reliance, July 2018), <a href="<a href="<a href="<a href="<a href="source">source">source">source">source">source">source
- See, e.g., Claire Park, The Cost of Connectivity in West Virginia, (Washington, D.C.: New America’s Open Technology Institute, April 1, 2020), <a href="<a href="<a href="<a href="<a href="source">source">source">source">source">source">source ; and Bill Callahan, “AT&T’s Digital Redlining of Dallas: New Research by Dr. Brian Whitacre,” National Digital Inclusion Alliance, August 6, 2019, <a href="<a href="<a href="<a href="<a href="source">source">source">source">source">source">source
- See, e.g., Monica Anderson, “Mobile Technology and Home Broadband 2019,” Pew Research Center, June 13, 2019, <a href="<a href="<a href="<a href="<a href="source">source">source">source">source">source">source and John B. Horrigan and Maeve Duggan, “3. Barriers to Broadband Adoption: Cost is Now a Substantial Challenge For Many Non-Users,” Pew Research Center, December 21, 2015, <a href="<a href="<a href="<a href="<a href="source">source">source">source">source">source">source
- Emily A. Vogels, Andrew Perrin, Lee Rainie, and Monica Anderson, “53% of Americans Say the Internet Has Been Essential During the COVID-19 Outbreak,” Pew Research Center, April 30, 2020, <a href="<a href="<a href="<a href="<a href="source">source">source">source">source">source">source
- See, Emily A. Vogels, Andrew Perrin, Lee Rainie, and Monica Anderson, “53% of Americans Say the Internet Has Been Essential During the COVID-19 Outbreak,” Pew Research Center, April 30, 2020, <a href="<a href="<a href="<a href="<a href="source">source">source">source">source">source">source
- The 2014 report included 24 cities, and we include all but two of these cities in this year’s report. We omit Berlin, Germany because we were unable to find any standalone internet plans advertised on providers’ websites. We omit Bristol, Virginia because the city has since sold its municipal network: Brandon Bailey, “Sunset Digital to become Point Broadband,” NBC/CW WCYB-TV, May 2, 2019, <a href="<a href="<a href="<a href="source">source">source">source">source">source
- Bill Callahan, “AT&T’s Digital Redlining Of Cleveland,” National Digital Inclusion Alliance (blog), March 10, 2017, <a href="<a href="<a href="<a href="source">source">source">source">source">source
- Claire Park, The Cost of Connectivity in West Virginia, (Washington, D.C.: New America’s Open Technology Institute, April 1, 2020), <a href="<a href="<a href="<a href="source">source">source">source">source">source
- For instance, Sonic, an ISP that services the San Francisco and Los Angeles areas, offered bundle options with internet and phone services at the time of data collection. This approach means that at least several ISPs are excluded from our dataset.
- See, e.g., Amir Nasr, Claire Park, Eric Null, Comments of New America’s Open Technology Institute and Access Now, GN Docket No. 19-285, (November 21, 2019), <a href="<a href="<a href="<a href="source">source">source">source">source">source (“Specifically, mobile broadband is not a substitute for fixed broadband due to the functional difference in how consumers use the services. Mobile broadband is typically higher cost, less reliable (especially in rural areas), slower, and subject to data caps and expensive overage fees in comparison to fixed broadband. Further, mobile broadband is increasingly reliant on fixed broadband for backhaul and offloaded traffic. It would make no sense for the Commission to deem mobile broadband a substitute for fixed broadband when the former service is dependent on the latter.”)
- “Fixed Broadband Deployment,” Federal Communications Commission, June 2019, <a href="<a href="<a href="<a href="source">source">source">source">source">source
- Researchers’ language proficiencies included German, Korean, and Spanish.
- As indicated below, the lack of data is signified by “no data” or a “—” in our data visualization and appendices.
- For example, if a plan advertises a two-year contract with promotional pricing for the first 12 months, we calculate the average price for the entire contract term and record it as the monthly promotional price. For this particular example, we would take the average of 12 months at the promotional price and the sum of 12 months at the non-promotional price.
- 2019 Broadband Deployment Report, Federal Communications Commission, adopted May 8, 2019, released May 29, 2019<a href="<a href="<a href="<a href="source">source">source">source">source">source
- We record rental fees for Comcast’s wireless gateway under “modem rental fees” throughout our dataset and note that a consumer would not have to pay an additional fee to rent a router.
- See Becky Chao and Lukas Pietrzak, The Cost of Connectivity in Ammon, Idaho, (Washington, D.C.: New America’s Open Technology Institute, January 22, 2020), <a href="<a href="<a href="<a href="source">source">source">source">source">source for more information.
- “Google Fiber Fee Schedule,” Google Fiber, last modified April 13, 2020, <a href="<a href="<a href="<a href="source">source">source">source">source">source
- WTFee Survey 2018 Nationally Representative Multi-Mode Survey, (Consumer Reports: January 3, 2019), <a href="<a href="<a href="<a href="source">source">source">source">source">source ; Karl Bode, “Hidden Fees Mean US Cable & Broadband Bills Can Be 45% Higher Than Advertised,” techdirt, October 1, 2019, <a href="<a href="<a href="<a href="source">source">source">source">source">source
- “GDP, PPP (current international $),” World Bank, <a href="<a href="<a href="<a href="source">source">source">source">source">source
- Lifeline is the federal subsidy program for internet and phone services. For more information, see “What is Lifeline?” in the “COVID-19 Exacerbates Affordability Problems, Particularly for BIPOC Communities and Low-income Households” section of this report.
- “Lifeline,” Community Development Program, CenturyLink, last accessed May 27, 2020, <a href="<a href="<a href="<a href="source">source">source">source">source">source
- “Frontier Lifeline Program,” Frontier Communications Corporation, last accessed May 27, 2020, <a href="<a href="<a href="<a href="source">source">source">source">source">source
- “Lifeline,” RCN telecom Services, last accessed May 27, 2020, <a href="<a href="<a href="<a href="source">source">source">source">source">source
- “Frequently Asked Questions,” Low-Cost Home Internet, AT&T, last accessed May 27, 2020, <a href="<a href="<a href="<a href="source">source">source">source">source">source
- “Spectrum Internet Assist,” Charter Communications, last accessed May 27, 2020, <a href="<a href="<a href="<a href="source">source">source">source">source">source
- “Internet Essentials Brings Affordable High-Speed Internet Home,” Internet Essentials, Comcast, last accessed May 27, 2020, <a href="<a href="<a href="<a href="source">source">source">source">source">source
- Tyler Cooper, “DSL vs Cable vs Fiber: Comparing Internet Options,” BroadbandNow, last updated December 12, 2019, <a href="<a href="<a href="<a href="source">source">source">source">source">source
- Cooper, “DSL vs Cable vs Fiber: Comparing Internet Options.”
- Our analysis on monthly internet prices throughout this report defaults to promotional pricing, unless no information on promotional pricing is provided, in which case, we adopt the non-promotional pricing for that plan instead. We note all other exceptions to this rule.
- Visnja Cik Krizanovic, Drago Zagar, and Kresimir Grgic, “A framework for optimal techno-economic assessment of broadband access solutions and digital inclusion of rural population in global information society,” Universal Access Information Society, 17 (2018): 517–540, <a href="<a href="<a href="<a href="source">source">source">source">source">source
- More information on the differences between a modem and router are detailed in the “Focus on the Fees” section.
- Advertised data provides the best publicly available information on internet pricing in the United States, as no government agency collects this information.
- The estimate for Asia is limited by the lack of data on self-installation fees among Asian providers and activation fees for Hong Kong and Tokyo providers in our dataset. In addition, our dataset does not include information on Wi-Fi router purchase fees in Seoul or Tokyo and modem purchase fees in Hong Kong or Seoul because providers in our dataset do not advertise them. As a result, this estimate for total one-time costs a consumer in Asia would pay for self-installation and equipment purchases only includes the average modem purchase fee in Tokyo.
- Fiber penetration in the United States is 15.55 percent, while the average among OECD countries is 26.81 percent. “OECD broadband statistics update,” Organization for EconomicCo-operation and Development, March 3, 2020, <a href="<a href="<a href="source">source">source">source">source
- The United States has the most expensive average and median monthly prices for fiber-based plans coming to $79.92 and $57.99 whereas in South Korea, which has the highest in fiber penetration rate according to the OECD, fiber-based plans cost on average $31.71 a month and median monthly prices are $30.42. Within our dataset, Denmark, France, Latvia, and Japan, which among the OECD countries rank higher in fiber penetration rates than the United States, also have lower monthly prices for fiber-based plans on average and median than the United States. Organization for Economic Co-operation and Development, “OECD broadband statistics update.”
- Organization for Economic Co-operation and Development, “OECD broadband statistics update.”
- See, e.g., H. Trostle and Christopher Mitchell, Profiles of Monopoly:Big Cable and Telecom, (Institute for Local Self-Reliance, July 2018), <a href="<a href="<a href="source">source">source">source">source
- Hong Kong’s average monthly internet price of $148.92 represents an outlier that pulls the average for Asia upward.
- Inti Pacheco and Shalini Ramachandran, “Do You Pay Too Much for Internet Service? See How Your Bill Compares,” Wall Street Journal, December 24, 2019, <a href="<a href="<a href="source">source">source">source">source
- See Appendix A for population density sources.
- Seoul is excluded from this calculation because the plans in our dataset did not include information on advertised upload speeds.
- In the absence of government collection of pricing data or ISP disclosure of their records, advertising remains one of the best available sources of public information on internet pricing.
- Similar to our analysis on monthly internet prices, we look only at the monthly price that ISPs advertise for internet access and exclude monthly or one-time autopay/paperless billing discounts, data overage penalties, equipment fees, installation fees, and activation fees in our analysis on monthly internet prices.
- Amir Nasr, Eric Null, Joshua Stager, Reply Comments of New America’s Open Technology Institute, GN Docket No. 18-238, WC Docket No. 11-10, (October 1, 2018), <a href="<a href="<a href="source">source">source">source">source
- Users require higher upload speeds to ensure they have enough capacity to run a query on a search engine, post or send a picture, or communicate with someone via video conferencing. Often, users are performing multiple tasks at once, making upload speeds even more important. See, e.g., Becky Chao, Sarah Morris, Amir Nasr, Eric Null, Joshua Stager, Comments of New America’s Open Technology Institute, GN Docket No. 18-238, GN Docket No. 18-231, WC Docket No. 11-10, September 17, 2018, <a href="<a href="<a href="source">source">source">source">source ; Christine Ottoni, “Content creators can do more with the fastest Internet,” Ting Wake Forest News, Ting, April 3, 2019, <a href="<a href="<a href="source">source">source">source">source ; Peter Christiansen, ed. Cara Haynes, “What Is a Good Download and Upload Speed?” HighSpeedInternet.com, June 2, 2020, <a href="<a href="<a href="source">source">source">source">source ; and Alex Bybyk, “What is a good upload speed for streaming?” Restream, August 19, 2019, <a href="<a href="<a href="source">source">source">source">source
- Statement of Commissioner Jessica Rosenworcel, Dissenting, “Fourteenth Broadband Deployment Report Notice of Inquiry,” Rosenworcel Dissenting Statement, adopted August 8, 2018, released: August 9, 2018, 14, <a href="<a href="<a href="source">source">source">source">source
- We calculated this number by taking the average difference between installation and self-installation fees for all plans that specified both.
- “What is a Modem,” Linksys, last accessed May 27, 2020, <a href="<a href="source">source">source">source
- Melanie Pinola, “Understanding Wi-Fi and How It Works,” Lifewire, May 1, 2020, <a href="<a href="source">source">source">source
- Molly McLaughlin, “Modem vs. Router: How Do They Differ?” Lifewire, April 9, 2020,<a href="<a href="source">source">source">source ; “Router vs. Modem: What’s the Difference?” Comcast, February 8, 2019, <a href="<a href="source">source">source">source
- This combined price excludes other fees that a consumer would have to pay, such as installation fees, activation fees, and data overage penalties.
- The average data overage penalty fee was calculated using the average data overage penalty for Toronto ISP Ebox, which came to $20.29/GB. Ebox does not specify one fee, but charges between $0.40 and $40.17 per GB over the data cap, so the average overage penalty was calculated assuming one plan charged the lowest end of the range, and another charged the highest. Swisscom in Zurich, eo Hikari, NTT East, and Softbank in Tokyo, Wave in Seattle, and Netvigator in Hong Kong, specify data caps but not the corresponding penalty.
- Danielle Kehl and Patrick Lucey, Artificial Scarcity: How Data Caps Harm Consumers and Innovation, (Washington, DC: New America, June 2015), <a href="<a href="source">source">source">source
- See, e.g., United States Government Accountability Office, Broadband Internet: FCC Should Track the Application of Fixed Internet Usage-Based Pricing and Help Improve Consumer Education, (Washington, DC: United States Government Accountability Office, November 2014),<a href="<a href="source">source">source">source
- See, e.g., Katie Watson, “Data Caps and Vulnerable Populations,” February 4, 2016, Benton Institute for Broadband & Society, <a href="<a href="source">source">source">source
- Katie Watson, “Data Caps and Vulnerable Populations,” February 4, 2016, Benton Institute for Broadband & Society, <a href="<a href="source">source">source">source
- See, e.g.,”Reducing Zoom Data and Bandwidth Use,” Cornell University, last updated March 27, 2020, <a href="<a href="source">source">source">source
- See, e.g., Applications of AT&T Inc. and DIRECTV for Consent to Assign or Transfer Control of Licenses and Authorizations, MB Docket No. 14-90, Memorandum Opinion and Order, para. 213, <a href="<a href="source">source">source">source
- While AT&T isn’t implementing this self-preferencing on its home internet plans at this time, the lack of sufficient guardrails in the form of net neutrality protections does not rule out this possibility in the future; Nilay Patel, “HBO Max won’t hit AT&T data caps, but Netflix and Disney Plus will,” Verge, June 2, 2020, <a href="<a href="source">source">source">source ; Jon Brodkin, “AT&T exempts HBO Max from data caps but still limits your Netflix use,” Ars Technica, June 2, 2020, <a href="<a href="source">source">source">source
- Rob Pegoraro, The Coronavirus Might Have Just Killed ISP Data Caps,” Fast Company, March 21, 2020, <a href="<a href="source">source">source">source
- Kathleen Burke, “Keep All Americans Connected By Prohibiting Data Caps During the COVID-19 Pandemic,” Public Knowledge (blog), March 27, 2020, <a href="<a href="source">source">source">source
- Jon Brodkin, “Comcast waiving data caps hasn’t hurt its network—why not make it permanent?,” Ars Technica, March 31, 2020, <a href="<a href="source">source">source">source
- Danielle Kehl and Patrick Lucey, Artificial Scarcity: How Data Caps Harm Consumers and Innovation, (Washington, DC: New America, June 2015), 7, <a href="<a href="source">source">source">source
- Tyler Cooper, “Internet Contracts and Fees: what you need to know,” BroadbandNow, July 16, 2018, <a href="<a href="source">source">source">source
- We calculate the average early contract termination fee using two data points for the Magnet plan advertised in Dublin. Magnet charges between $124.62 and $249.25 for early contract termination. We include one data point for the minimum fee and another for the maximum, coming to an average contract termination fee of $186.94 for Magnet.
- We calculated this number by taking the average difference between early termination fees for plans that advertised same speeds, but different monthly prices for different contract lengths.
- See, e.g., Oren Bar-Gill and Omri Ben-Shahar, “Exit from Contract,” Journal of Legal Analysis, 6 no.1, (October 2014): 151–183, <a href="<a href="source">source">source">source
- Oren Bar-Gill and Omri Ben-Shahar, “Exit from Contract.”
- Tom Wheeler, “Prepared Remarks of FCC Chairman Tom Wheeler: ‘The Facts and Future of Broadband Competition,’” Federal Communications Commission, September 4, 2014, <a href="<a href="source">source">source">source
- See H. Trostle and Christopher Mitchell, Profiles of Monopoly:Big Cable and Telecom, (Institute for Local Self-Reliance, July 2018), <a href="<a href="source">source">source">source
- “Contract Buyout Eligibility and Redemption Details,” Residential Terms of Service, Charter Communications, last accessed May 27, 2020, <a href="<a href="source">source">source">source
- “Early Termination Fee Instructions,” Verizon, last accessed May 27, 2020, <a href="<a href="source">source">source">source
- See, e.g., Oren Bar-Gill and Omri Ben-Shahar, “Exit from Contract,” Journal of Legal Analysis, 6 no.1, (October 2014): 151–183, <a href="<a href="source">source">source">source
- See, e.g., “Early Termination Fee Instructions,” Verizon, last accessed May 27, 2020, <a href="<a href="source">source">source">source
- This plan count excludes six plans with identical monthly prices for different contract terms. The plans excluded are identified in our methodology.
- We calculate the average price for all plans in our dataset using the promotional price for each entry unless it is not available, in which case, we use the non-promotional price instead. Because providers do not always offer plans with promotional pricing or disclose non-promotional pricing, this average captures our dataset most comprehensively.
- “Community Network Map,” Institute for Local Self-Reliance, updated January 2020, <a href="source">source">source
- Claire Park, Community Broadband: The Fast, Affordable Internet Option That's Flying Under the Radar (Washington, D.C.: New America, 2020), <a href="source">source">source ;Becky Chao and Lukas Pietrzak, The Cost of Connectivity in Ammon, Idaho, (Washington, D.C.: New America’s Open Technology Institute, January 22, 2020), <a href="source">source">source
- We exclude any additional fees that apply to plans operating on municipal networks in our analysis. In Ammon, Idaho, for example, consumers of the city’s open access network are subject to an additional monthly utility fee of $16.50 and separate construction fee paid to the city, on top of the monthly price paid to the provider. See Becky Chao and Lukas Pietrzak, The Cost of Connectivity in Ammon, Idaho, (Washington, D.C.: New America’s Open Technology Institute, January 22, 2020), <a href="source">source">source for more information.
- This comparison only includes monthly internet costs and excludes any additional fees. For the private network comparison, we use the average cost per Mbps based on monthly prices and speeds advertised by AT&T in Lafayette, La.
- This comparison only includes monthly internet costs and excludes any additional fees. See Becky Chao and Lukas Pietrzak, The Cost of Connectivity in Ammon, Idaho, (Washington, D.C.: New America’s Open Technology Institute, January 22, 2020), <a href="source">source">source for more information.
- Jon Brodkin, “Comcast, Beware: New city-run broadband offers 1Gbps for $60 a month,” Ars Technica, August 30, 2019, <a href="source">source">source
- Dan Mahoney and Greg Rafert, “Broadband Competition Helps to Drive Lower Prices and Faster Download Speeds for U.S. Residential Consumers,” Analysis Group Whitepaper, November 2016, 21-22, 24, <a href="source">source">source
- Rafi Goldberg, “Unplugged: NTIA Survey Finds Some Americans Still Avoid Home Internet Use,” National Telecommunications and Information Administration, April 15, 2019, <a href="source">source">source
- Elise Gould, “Black-white wage gaps are worse today than in 2000,” Economic Policy Institute, February 27, 2020, <a href="source">source">source
- See, e.g., S. Derek Turner, Digital Denied: The Impact of Systemic Racial Discrimination on Home-Internet Adoption, (Free Press: December 2016), <a href="source">source">source; Robert Fairlie, “Race and the Digital Divide,” UC Santa Cruz: Department of Economics, UCSC, September 11, 2014, <a href="source">source">source
- Brian Howard and Traci Morris, Tribal Tech Assessment: The State of Internet Service on Tribal Lands, (American Indian Policy Institute: July 27, 2019), <a href="source">source">source
- See, e.g., S. Derek Turner, Digital Denied: The Impact of Systemic Racial Discrimination on Home-Internet Adoption, (Free Press: December 2016), <a href="source">source">source; AT&T has also allegedly engaged in “digital redlining” in Cleveland, Ohio, see, e.g., Bill Callahan, “AT&T’s Digital Redlining Of Cleveland,” National Digital Inclusion Alliance (blog), March 10, 2017, <a href="source">source">source
- Darrick Hamilton, Preface, Dedrick Asante-Muhammad, Chuck Collins, and Omar Ocampo, White Supremacy is the Preexisting Condition: Eight Solutions to Ensure Economic Recovery Reduces the Racial Wealth Divide, Institute for Policy Studies, June 19, 2020, <a href="source">source">source; See, also, Ernie Tedeschi and Quoctrung Bui, “Unemployment Tracker: Job Losses for Black Workers Are Deepening,” New York Times, last updated June 16, 2020, <a href="source">source">source
- Emily A. Vogels, Andrew Perrin, Lee Rainie, and Monica Anderson, “53% of Americans Say the Internet Has Been Essential During the COVID-19 Outbreak,” Pew Research Center, April 30, 2020, <a href="source">source">source
- Emily A. Vogels, Andrew Perrin, Lee Rainie, and Monica Anderson, “53% of Americans Say the Internet Has Been Essential During the COVID-19 Outbreak.”
- See, e.g., By Suzanne Woolley, Nikitha Sattiraju, and Scott Moritz, “U.S. Schools Trying to Teach Online Highlight a Digital Divide,” Bloomberg, March 26, 2020,<a href="source">source">source
- Emily A. Vogels, Andrew Perrin, Lee Rainie, and Monica Anderson, “53% of Americans Say the Internet Has Been Essential During the COVID-19 Outbreak,” Pew Research Center, April 30, 2020, <a href="source">source">source
- See, e.g., Brian Howard and Mikhail Sundust, “COVID-19: The Impact of Limited Internet Access and Issues with Social Distancing for Native Students,” American Indian Policy Institute, Spring 2020, <a href="source">source">source
- Jonathan Sallet, “Tell The Story We Know: Broadband Competition is Too Limited,” Benton Institute for Broadband & Society, March 6, 2020, <a href="source">source">source
- A report from the Benton Institute for Broadband and Society found that low-income participants in the Twin Cities, Minnesota were able to afford internet services offered by non-profit partnership programs at $10 per month. Colin Rhinesmith, Digital Inclusion and Meaningful Broadband Adoption Initiatives, (Evanston, IL: Benton Institute for Broadband and Society, January 2016), <a href="source">source">source
- This plan count excludes six plans that offer the same monthly price at different contract terms. The excluded plans are disclosed in our “Methodology” section.
- This average was calculated for the 64 plans that offered an initial promotional price of $50 and under and advertised the non-promotional price on their websites. Plans that did not disclose non-promotional prices were excluded from this calculation.
- For instance, community members enrolled in a non-profit partnership program offering internet access for $10 a month have said that increasing the cost to $20 a month would pose financial difficulties. Colin Rhinesmith, Digital Inclusion and Meaningful Broadband Adoption Initiatives, (Evanston, IL: Benton Institute for Broadband and Society, January 2016), <a href="source">source">source
- This plan count excludes six plans that offer the same monthly price at different contract terms. The excluded plans are disclosed in our “Methodology” section.
- See Becky Chao and Lukas Pietrzak, The Cost of Connectivity in Ammon, Idaho, (Washington, D.C.: New America’s Open Technology Institute, January 22, 2020), <a href="source">source">source for more information.
- Providers abroad did not appear to advertise similar discounts.
- See, e.g., Xavier Jaravel, The Unequal Gains from Product Innovations: Evidence from the U.S. Retail Sector, The Quarterly Journal of Economics 134, issue 2, (May 2019): 715–783, <a href="source">source">source
- Bourree Lam, “The Surging Cost of Basic Needs,” Atlantic, June 2, 2016, <a href="source">source">source
- Sarah Morris, Joshua Stager, Eric Null, Amir Nasr, Becky Chao, Comments of New America’s Open Technology Institute in the Matter of Bridging the Digital Divide for Low-Income Consumers, WC Docket No. 17-287, (February 21, 2018), <a href="source">source">source
- “Spectrum Internet Assist,” Charter, last accessed May 27, 2020, <a href="source">source">source
- AT&T provides the fastest speed available at a consumer’s residence. “Frequently Asked Questions,” Low-Cost Home Internet, AT&T, last accessed May 27, 2020, <a href="source">source">source
- At $5 a month, the AT&T plan charges low-income consumers by 10.42 times more than the average cost of plans in our U.S. dataset.
- Amir Nasr and Claire Park, “The Government Is Severing a Lifeline for Low-Income Americans,” New America Weekly, March 5, 2020, <a href="source">source">source ; Federal Communications Commission, Fifth Report and Order, Memorandum Opinion and Order on Reconsideration, and Further Notice of Proposed Rulemaking, WC Docket No. 17-287, WC Docket No. 11-42, WC Docket No. 09-197, adopted October 30, 2019, released November 14, 2019,<a href="source">source">source
- See, e.g. “AT&T to Pay $60 Million to Resolve FTC Allegations It Misled Consumers with ‘Unlimited Data’ Promises,” Federal Trade Commission, November 5, 2019, <a href="source">source">source
- We calculate this average for the 299 plans that providers advertised both promotional and non-promotional pricing for. Plans that did not disclose either promotional or non-promotional prices are excluded from this calculation.
- We calculate this average for the 140 plans that providers advertised both promotional and non-promotional pricing for. Plans that did not disclose either promotional (meaning that providers did not offer promotional pricing) or non-promotional prices are excluded from this calculation.
- We calculate the size of the price increase for the 140 plans with both advertised promotional and non-promotional pricing by taking the size of the promotional and dividing it by the initial promotional price.
- See David Talbot, Kira Hessekiel, and Danielle Kehl, Community Owned Fiber Networks: Value Leaders in America, (Cambridge, MA: Berkman KleinCenter for Internet & Society, 2017), <a href="source">source">source
- “14. Acceptable Use,” AT&T Website Terms of Use, AT&T, effective January 2020, <a href="source">source">source ; “Century Link Website User Agreement,” CenturyLink, effective June 1, 2014, <a href="source">source">source
- “Terms and Conditions,” Verizon, last accessed May 27, 2020, <a href="source">source">source
- “AT&T Internet Consumer Fee Schedule,” Legal Policy Center, AT&T, <a href="source">source">source; “AT&T Internet Consumer Fee Schedule,” AT&T, <a href="source">source">source
- Caroline Cakebread, “You're not alone, no one reads terms of service agreements,” Business Insider, November 15, 2017, <a href="source">source">source
- See, e.g., Oren Bar-Gill and Omri Ben-Shahar, “Exit from Contract,” Journal of Legal Analysis, 6 no.1, (October 2014): 151–183, <a href="source">source">source
- WTFee Survey 2018 Nationally Representative Multi-Mode Survey, (Consumer Reports: January 3, 2019), <a href="source">source">source
- WTFee Survey 2018 Nationally Representative Multi-Mode Survey, (Consumer Reports: January 3, 2019)
- “Taxes and Surcharges,” Understand My Bill, Frontier, last accessed May 27, 2020, <a href="source">source">source
- “US cable and fixed telecom bundle rates up to 45% higher than advertised,” GlobalData, September 27, 2019, <a href="source">source">source
- Jon Brodkin, “US Finally Prohibits ISPs From Charging for Routers They Don’t Provide,” Ars Technica, January 7, 2020, <a href="source">source">source ; Frontier has also since gone bankrupt.
- Federal Communications Commission, Report and Order On Remand, Declaratory Ruling, and Order, GN Docket No. 14-28, adopted February 26, 2015, released March 12, 2015, 80, <a href="source">source">source
- Amir Nasr, “Why We Can’t Forget Cost When Discussing Broadband Mapping,” New America Weekly, June 20, 2019, source">source
- “Fixed Broadband Deployment Data from FCC Form 477,” Federal Communications Commission, updated March 12, 2020, source">source
- See, e.g., Max Garland, “WV Broadband Council Chairman Blasts FCC Report, Says Data Isn't Correct,” Charleston Gazette-Mail, February 8, 2018, source">source and Katy Rossiter, “What Are Census Blocks?” United States Census Bureau, July 11, 2011, source">source
- Federal Communications Commission, FCC Form 477 Local Telephone Competition and Broadband Reporting Instructions for Filings as of December 31, 2019 and Beyond, (Federal Communications Commission: May 21, 2020), source">source
- Amir Nasr, “Why We Can’t Forget Cost When Discussing Broadband Mapping,” New America Weekly, June 20, 2019, source">source ; “OTI to FCC: Broadband is Not Reaching All Americans,” New America’s Open Technology Institute (blog), September 19, 2018, source">source ; “OTI Submits Reply Comments Urging FCC To Strengthen Section 706 Review Process,” New America’s Open Technology Institute (blog), October 4, 2018, source">source
- See, e.g., H. Trostle, Christopher Barich, and Christopher Mitchell, Broadband Competition in the Rochester Region: Reality vs Federal Statistics, (Institute for Local Self-Reliance), August 2018, source">source ; “Manchin: FCC Broadband Report is Plain Wrong,” (press release), May 1, 2020, source">source ; April Simpson, “Can You Hear Me Now? In Quest for Federal Money, States Debunk Mobile Providers’ Coverage Claims,” Pew Charitable Trusts, January 23, 2019, source">source
- Ross Schulman, Georgia Bullen, Nick Thieme, “The United States of Broadband Map: Mapping the Gulf Between the Broadband Speeds That ISPs Report and Those Measured by Consumers,” New America’s Open Technology Institute, last updated on July 17th, 2019, source">source
- A survey published by the Pew Research Center in 2019 revealed that whereas 81 percent of households with incomes between $30,000 and $99,000 have home high-speed broadband service, 44 percent of adults with household incomes below $30,000 a year do not. Monica Anderson and Madhumitha Kumar, “Digital divide persists even as lower-income Americans make gains in tech adoption,” Pew Research Center, May 7, 2019, source">source
- Moving Forward Act, H.R. 2, 116th Congress (2020). source">source
- See, e.g., Jon Brodkin, “Lawsuit forces CenturyLink to stop charging ‘Internet Cost Recovery Fee’,” Ars Technica, December 11, 2019, source">source
- Jonathan Schwantes, How Cable Companies Use Hidden Fees to Raise Prices and Disguise the True Cost of Service, (Consumer Reports: October 2019), source">source
- Emily Hong, Laura Moy, and Isabelle Styslinger, Broadband Truth-in-Labeling: Empowering Consumer Choice Through Standardized Disclosure, (New America’s Open Technology Institute: July 2015), source">source ; See, also, Broadband Truth-in-Labeling, (New America’s Open Technology Institute: 2009), source">source
- Consumer and Governmental Affairs, Wireline Competition, and Wireless Telecommunications Bureaus Approve Open Internet Broadband Consumer Labels,” Public Notice, GN Docket No. 14-28, Federal Communications Commission, April 4, 2016, source">source
- Moving Forward Act, H.R. 2, 116th Congress (2020). source">source
- Cecilia Kang, “Comcast is Trying to Improve Its Image With a Program for Low-Income Consumers,” Washington Post, May 9, 2014, source">source
- Jonathan Sallet, Broadband For America’s Future: A Vision For the 2020s, (Evanston, IL: Benton Institute for Broadband & Society, October 2019, source">source
- Fybercom and QWK in Ammon, Idaho advertise service for a monthly price of $9.98 and $9.38 respectively, but these prices do not include the monthly utility, construction, and other fees subscribers pay. See Becky Chao and Lukas Pietrzak, The Cost of Connectivity in Ammon, Idaho, (Washington, D.C.: New America’s Open Technology Institute, January 22, 2020), source">source
- Universal Service Administrative Company, “Lifeline Participation,” Program Data, last accessed May 27, 2020, source">source ; Wyoming and Nebraska share the lowest participation rate among those eligible for Lifeline. The participation rate is estimated to have dropped even further since 2018 to 18 percent in 2019. See Comments of Free Press, WC Docket No. 17-287, WC Docket No. 11-42, WC Docket No. 09-197, Jan. 27, 2020, 11, source">source
- Universal Service Monitoring Report, CC Docket No. 96-45 WC Docket No. 02-6 WC Docket No. 02-60 WC Docket No. 06-122 WC Docket No. 10-90 WC Docket No. 11-42 WC Docket No. 13-184 WC Docket No. 14-58, 2018, 27, source">source
- “OTI Urges FCC to Abandon “Misguided and Cynical” Lifeline Proposal,” New America’s Open Technology Institute (press release), January 27, 2020, source">source
- “OTI Urges FCC to Strengthen Lifeline Safety Net Program During COVID-19 Pandemic,” New America’s Open Technology Institute (press release), March 23, 2020, source">source
- Health and Economic Recovery Omnibus Emergency Solutions Act (HEROES Act), H.R. 6800, 116th Congress, §2 (2020).
- Becky Chao and Lukas Pietrzak, The Cost of Connectivity in Ammon, Idaho, (Washington, D.C.: New America’s Open Technology Institute, January 22, 2020), source">source
- Jonathan Sallet, Broadband for America’s Future: A Vision for the 2020s, (Evanston, IL: Benton Institute for Broadband and Society, October 2019), 50, source">source
- Jonathan Sallet, Broadband for America’s Future: A Vision for the 2020s, 50.
- David Talbot, Kira Hessekiel, and Danielle Kehl, Community-OwnedFiber Networks: Value Leaders in America, (Cambridge, MA: Berkman Klein Center for Internet and Society, January 2018), source">source
- See, e.g., “State Restrictions on Community Broadband Services or Other Public Communications Initiatives,” Baller Stokes and Lide, July 1, 2019, source">source ; Kendra Chamberlain, “Municipal Broadband Is Roadblocked Or Outlawed In 22 States,” BroadbandNow, May 13, 2020, source">source
- “State Restrictions on Community Broadband Services or Other Public Communications Initiatives,” Baller Stokes and Lide, July 1, 2019, source">source
- Moving Forward Act, H.R. 2, 116th Congress (2020). source">source; see also Senator Cory Booker, “Community Broadband Act of 2017,” 115th Congress 1st Session, source">source
- See Charles Barr, Lisa Gonzalez, and Christopher Mitchell, “Transcript: Community Broadband Bits Episode 197,” Institute for Local Self-Reliance, April 21, 2016, source">source
- See Susan Crawford, “The New Payola: Deals Landlords Cut with Internet Providers,” Wired, June 27, 2016, source">source ; Broadband Now, The Broadband Report, “Apartment Landlords Are Holding Your Internet Hostage,” July 14, 2016, source">source
- Connect Your Community and the National Digital Inclusion Alliance, “AT&T’s Digital Redlining Of Cleveland,” (Mar. 10, 2017) (“Specifically, AT&T has chosen not to extend its “Fiber To the Node” VDSL infrastructure – which is now the standard for most Cuyahoga County suburbs and other urban AT&T markets throughout the U.S. – to the majority of Cleveland Census blocks, including the overwhelming majority of blocks with individual poverty rates above 35%”).
- Jon Brodkin, “Verizon refuses to give DSL users its low-income deals during pandemic,” Ars Technica, April 7, 2020, source">source
- Katie Kienbaum, “Monopoly ISPs Too Big to Make Good on Covid-19 Internet Offers,” Institute for Local Self-Reliance, April 10, 2020, source">source
- See, Thomas Phillipon, The Great Reversal (Cambridge, MA: Belknap Press, 2019).
- See, e.g, Scott Wallsten and Colleen Mallahan, “residential Broadband Competition in the United States,” March 2010, source">source ; this study uses FCC Census tract data, which may not accurately reflect experienced speeds or number of providers available in a given market.
- Jonathan Sallet, Broadband for America’s Future: A Vision for the 2020s, (Evanston, IL: Benton Institute for Broadband and Society, October 2019), 49, source">source
- Nicholas Hill, Nancy L. Rose, and Tor Winston, “Economics at the Antitrust Division 2014–2015: Comcast/Time Warner Cable and Applied Materials/Tokyo Electron.”
- Charlotte Slaiman and Joshua Stager, Comments on the Draft Vertical Merger Guidelines to the Federal Trade Commission by Public Knowledge and New America’s Open Technology Institute, submitted February 26, 2020,source">source
- Federal Communications Commission, Comcast Corporation and NBC Universal, MB Docket 10-56, para 6, source">source
- Lisa Gonzelez, “Comcast Gamed FCC for Internet Essentials ‘Concession’ in NBC Merger,” Institute for Local Self-Reliance, December 3, 2012, source">source
- See, e.g., Charlotte Slaiman and Joshua Stager, Comments on the Draft Vertical Merger Guidelines to the Federal Trade Commission by Public Knowledge and New America’s Open Technology Institute, submitted February 26, 2020,source">source
- Emily Steel, “Comcast Critics Cast Doubt on Its Intentions,” New York Times, April 23, 2015, source">source
- See “T-Mobile Completes Merger with Sprint to Create the New T-Mobile,” T-Mobile, April 1, 2020, source">source ; Yosef Getachew, Jonathan Schwantes, Goergeo Slover, Joshua Stager, Amir Nasr, Becky Chao, Michael Calabrese, Philip Berenbroick, Dylan Gilbert, Laura Blum-Smith, Petition to Deny of Common Cause, Consumers Union, New America’s Open Technology Institute, Public Knowledge and Writers Guild of America, West, Inc., WT Docket No. 18-197, source">source
Appendices
Appendix A: Population Densities
We list the cities included in this year’s study with their respective population, surface area, and population density. Cities are grouped in intervals of 1,000 people per square kilometer, up until 10,000 people per square kilometer, at which point we group the four relevant cities together.
Appendix B: U.S. Dataset
We include details on the 297 U.S. plans examined in our study.
Appendix C: International Dataset
We include details on the 463 international plans examined in our study.
Citations
- “The Cost of Fixed-Line Broadband in 206 Countries,” Cable.co.uk, Existent Ltd., 2020, <a href="<a href="<a href="<a href="<a href="<a href="source">source">source">source">source">source">source">source
- See, e.g., Thomas Phillipon, The Great Reversal (Cambridge, MA: Belknap Press, 2019).
- David Leonhardt, “Big Business Is Overcharging You $5,000 a Year,” New York Times, November 10, 2019, <a href="<a href="<a href="<a href="<a href="<a href="source">source">source">source">source">source">source">source
- While this official definition for “broadband” exists, no government agency has set benchmarks for how to measure or verify these speeds. See, e.g., Peter Boothe and Georgia Bullen, “How fast is my Internet? Speed Tests, Accuracy, NDT & M-Lab,” Measurement Lab, March 26, 2019, <a href="<a href="<a href="<a href="<a href="<a href="source">source">source">source">source">source">source">source for more information.
- 2015 Broadband Progress Report and Notice of Inquiry on Immediate Action to Accelerate Deployment, Federal Communications Commission, adopted January 29, 2015, released February 4, 2015, <a href="<a href="<a href="<a href="<a href="<a href="source">source">source">source">source">source">source">source
- Jameson Zimmer, “FCC Broadband Definition Has Changed Before and Will Change Again,” BroadbandNow, February 10, 2018, <a href="<a href="<a href="<a href="<a href="<a href="source">source">source">source">source">source">source">source
- Statement of Commissioner Jessica Rosenworcel, Dissenting, “Fourteenth Broadband Deployment Report Notice of Inquiry,” Rosenworcel Dissenting Statement, adopted August 8, 2018, released: August 9, 2018, 14, <a href="<a href="<a href="<a href="<a href="<a href="source">source">source">source">source">source">source">source
- Amir Nasr, Eric Null, Joshua Stager, Reply Comments of New America’s Open Technology Institute, GN Docket No. 18-238, WC Docket No. 11-10, (October 1, 2018), <a href="<a href="<a href="<a href="<a href="<a href="source">source">source">source">source">source">source">source
- “A third of Americans live in a household with three or more smartphones,” Pew Research Center, May 25, 2017, <a href="<a href="<a href="<a href="<a href="<a href="source">source">source">source">source">source">source">source
- “Household Broadband Guide,” Federal Communications Commission, last modified February 5, 2020, <a href="<a href="<a href="<a href="<a href="<a href="source">source">source">source">source">source">source">source
- Jonathan Sallet, “Tell The Story We Know: Broadband Competition is Too Limited,” Benton Institute for Broadband & Society, March 6, 2020, <a href="<a href="<a href="<a href="<a href="<a href="source">source">source">source">source">source">source">source
- Frontier has since filed for bankruptcy and has sold its operations in Washington, Oregon, Idaho, and Montana. It maintains operations in 25 states. Jon Brodkin, “Frontier Files for Bankruptcy, Says Its Broadband Service Won’t Get Any Worse,” Ars Technica, April 15, 2020, <a href="<a href="<a href="<a href="<a href="<a href="source">source">source">source">source">source">source">source
- H. Trostle and Christopher Mitchell, Profiles of Monopoly: Big Cable and Telecom, (Institute for Local Self-Reliance, July 2018), <a href="<a href="<a href="<a href="<a href="<a href="source">source">source">source">source">source">source">source
- See, e.g., Claire Park, The Cost of Connectivity in West Virginia, (Washington, D.C.: New America’s Open Technology Institute, April 1, 2020), <a href="<a href="<a href="<a href="<a href="<a href="source">source">source">source">source">source">source">source ; and Bill Callahan, “AT&T’s Digital Redlining of Dallas: New Research by Dr. Brian Whitacre,” National Digital Inclusion Alliance, August 6, 2019, <a href="<a href="<a href="<a href="<a href="<a href="source">source">source">source">source">source">source">source
- See, e.g., Monica Anderson, “Mobile Technology and Home Broadband 2019,” Pew Research Center, June 13, 2019, <a href="<a href="<a href="<a href="<a href="<a href="source">source">source">source">source">source">source">source and John B. Horrigan and Maeve Duggan, “3. Barriers to Broadband Adoption: Cost is Now a Substantial Challenge For Many Non-Users,” Pew Research Center, December 21, 2015, <a href="<a href="<a href="<a href="<a href="<a href="source">source">source">source">source">source">source">source
- Emily A. Vogels, Andrew Perrin, Lee Rainie, and Monica Anderson, “53% of Americans Say the Internet Has Been Essential During the COVID-19 Outbreak,” Pew Research Center, April 30, 2020, <a href="<a href="<a href="<a href="<a href="<a href="source">source">source">source">source">source">source">source
- See, Emily A. Vogels, Andrew Perrin, Lee Rainie, and Monica Anderson, “53% of Americans Say the Internet Has Been Essential During the COVID-19 Outbreak,” Pew Research Center, April 30, 2020, <a href="<a href="<a href="<a href="<a href="<a href="source">source">source">source">source">source">source">source
- The 2014 report included 24 cities, and we include all but two of these cities in this year’s report. We omit Berlin, Germany because we were unable to find any standalone internet plans advertised on providers’ websites. We omit Bristol, Virginia because the city has since sold its municipal network: Brandon Bailey, “Sunset Digital to become Point Broadband,” NBC/CW WCYB-TV, May 2, 2019, <a href="<a href="<a href="<a href="<a href="source">source">source">source">source">source">source
- Bill Callahan, “AT&T’s Digital Redlining Of Cleveland,” National Digital Inclusion Alliance (blog), March 10, 2017, <a href="<a href="<a href="<a href="<a href="source">source">source">source">source">source">source
- Claire Park, The Cost of Connectivity in West Virginia, (Washington, D.C.: New America’s Open Technology Institute, April 1, 2020), <a href="<a href="<a href="<a href="<a href="source">source">source">source">source">source">source
- For instance, Sonic, an ISP that services the San Francisco and Los Angeles areas, offered bundle options with internet and phone services at the time of data collection. This approach means that at least several ISPs are excluded from our dataset.
- See, e.g., Amir Nasr, Claire Park, Eric Null, Comments of New America’s Open Technology Institute and Access Now, GN Docket No. 19-285, (November 21, 2019), <a href="<a href="<a href="<a href="<a href="source">source">source">source">source">source">source (“Specifically, mobile broadband is not a substitute for fixed broadband due to the functional difference in how consumers use the services. Mobile broadband is typically higher cost, less reliable (especially in rural areas), slower, and subject to data caps and expensive overage fees in comparison to fixed broadband. Further, mobile broadband is increasingly reliant on fixed broadband for backhaul and offloaded traffic. It would make no sense for the Commission to deem mobile broadband a substitute for fixed broadband when the former service is dependent on the latter.”)
- “Fixed Broadband Deployment,” Federal Communications Commission, June 2019, <a href="<a href="<a href="<a href="<a href="source">source">source">source">source">source">source
- Researchers’ language proficiencies included German, Korean, and Spanish.
- As indicated below, the lack of data is signified by “no data” or a “—” in our data visualization and appendices.
- For example, if a plan advertises a two-year contract with promotional pricing for the first 12 months, we calculate the average price for the entire contract term and record it as the monthly promotional price. For this particular example, we would take the average of 12 months at the promotional price and the sum of 12 months at the non-promotional price.
- 2019 Broadband Deployment Report, Federal Communications Commission, adopted May 8, 2019, released May 29, 2019<a href="<a href="<a href="<a href="<a href="source">source">source">source">source">source">source
- We record rental fees for Comcast’s wireless gateway under “modem rental fees” throughout our dataset and note that a consumer would not have to pay an additional fee to rent a router.
- See Becky Chao and Lukas Pietrzak, The Cost of Connectivity in Ammon, Idaho, (Washington, D.C.: New America’s Open Technology Institute, January 22, 2020), <a href="<a href="<a href="<a href="<a href="source">source">source">source">source">source">source for more information.
- “Google Fiber Fee Schedule,” Google Fiber, last modified April 13, 2020, <a href="<a href="<a href="<a href="<a href="source">source">source">source">source">source">source
- WTFee Survey 2018 Nationally Representative Multi-Mode Survey, (Consumer Reports: January 3, 2019), <a href="<a href="<a href="<a href="<a href="source">source">source">source">source">source">source ; Karl Bode, “Hidden Fees Mean US Cable & Broadband Bills Can Be 45% Higher Than Advertised,” techdirt, October 1, 2019, <a href="<a href="<a href="<a href="<a href="source">source">source">source">source">source">source
- “GDP, PPP (current international $),” World Bank, <a href="<a href="<a href="<a href="<a href="source">source">source">source">source">source">source
- Lifeline is the federal subsidy program for internet and phone services. For more information, see “What is Lifeline?” in the “COVID-19 Exacerbates Affordability Problems, Particularly for BIPOC Communities and Low-income Households” section of this report.
- “Lifeline,” Community Development Program, CenturyLink, last accessed May 27, 2020, <a href="<a href="<a href="<a href="<a href="source">source">source">source">source">source">source
- “Frontier Lifeline Program,” Frontier Communications Corporation, last accessed May 27, 2020, <a href="<a href="<a href="<a href="<a href="source">source">source">source">source">source">source
- “Lifeline,” RCN telecom Services, last accessed May 27, 2020, <a href="<a href="<a href="<a href="<a href="source">source">source">source">source">source">source
- “Frequently Asked Questions,” Low-Cost Home Internet, AT&T, last accessed May 27, 2020, <a href="<a href="<a href="<a href="<a href="source">source">source">source">source">source">source
- “Spectrum Internet Assist,” Charter Communications, last accessed May 27, 2020, <a href="<a href="<a href="<a href="<a href="source">source">source">source">source">source">source
- “Internet Essentials Brings Affordable High-Speed Internet Home,” Internet Essentials, Comcast, last accessed May 27, 2020, <a href="<a href="<a href="<a href="<a href="source">source">source">source">source">source">source
- Tyler Cooper, “DSL vs Cable vs Fiber: Comparing Internet Options,” BroadbandNow, last updated December 12, 2019, <a href="<a href="<a href="<a href="<a href="source">source">source">source">source">source">source
- Cooper, “DSL vs Cable vs Fiber: Comparing Internet Options.”
- Our analysis on monthly internet prices throughout this report defaults to promotional pricing, unless no information on promotional pricing is provided, in which case, we adopt the non-promotional pricing for that plan instead. We note all other exceptions to this rule.
- Visnja Cik Krizanovic, Drago Zagar, and Kresimir Grgic, “A framework for optimal techno-economic assessment of broadband access solutions and digital inclusion of rural population in global information society,” Universal Access Information Society, 17 (2018): 517–540, <a href="<a href="<a href="<a href="<a href="source">source">source">source">source">source">source
- More information on the differences between a modem and router are detailed in the “Focus on the Fees” section.
- Advertised data provides the best publicly available information on internet pricing in the United States, as no government agency collects this information.
- The estimate for Asia is limited by the lack of data on self-installation fees among Asian providers and activation fees for Hong Kong and Tokyo providers in our dataset. In addition, our dataset does not include information on Wi-Fi router purchase fees in Seoul or Tokyo and modem purchase fees in Hong Kong or Seoul because providers in our dataset do not advertise them. As a result, this estimate for total one-time costs a consumer in Asia would pay for self-installation and equipment purchases only includes the average modem purchase fee in Tokyo.
- Fiber penetration in the United States is 15.55 percent, while the average among OECD countries is 26.81 percent. “OECD broadband statistics update,” Organization for EconomicCo-operation and Development, March 3, 2020, <a href="<a href="<a href="<a href="source">source">source">source">source">source
- The United States has the most expensive average and median monthly prices for fiber-based plans coming to $79.92 and $57.99 whereas in South Korea, which has the highest in fiber penetration rate according to the OECD, fiber-based plans cost on average $31.71 a month and median monthly prices are $30.42. Within our dataset, Denmark, France, Latvia, and Japan, which among the OECD countries rank higher in fiber penetration rates than the United States, also have lower monthly prices for fiber-based plans on average and median than the United States. Organization for Economic Co-operation and Development, “OECD broadband statistics update.”
- Organization for Economic Co-operation and Development, “OECD broadband statistics update.”
- See, e.g., H. Trostle and Christopher Mitchell, Profiles of Monopoly:Big Cable and Telecom, (Institute for Local Self-Reliance, July 2018), <a href="<a href="<a href="<a href="source">source">source">source">source">source
- Hong Kong’s average monthly internet price of $148.92 represents an outlier that pulls the average for Asia upward.
- Inti Pacheco and Shalini Ramachandran, “Do You Pay Too Much for Internet Service? See How Your Bill Compares,” Wall Street Journal, December 24, 2019, <a href="<a href="<a href="<a href="source">source">source">source">source">source
- See Appendix A for population density sources.
- Seoul is excluded from this calculation because the plans in our dataset did not include information on advertised upload speeds.
- In the absence of government collection of pricing data or ISP disclosure of their records, advertising remains one of the best available sources of public information on internet pricing.
- Similar to our analysis on monthly internet prices, we look only at the monthly price that ISPs advertise for internet access and exclude monthly or one-time autopay/paperless billing discounts, data overage penalties, equipment fees, installation fees, and activation fees in our analysis on monthly internet prices.
- Amir Nasr, Eric Null, Joshua Stager, Reply Comments of New America’s Open Technology Institute, GN Docket No. 18-238, WC Docket No. 11-10, (October 1, 2018), <a href="<a href="<a href="<a href="source">source">source">source">source">source
- Users require higher upload speeds to ensure they have enough capacity to run a query on a search engine, post or send a picture, or communicate with someone via video conferencing. Often, users are performing multiple tasks at once, making upload speeds even more important. See, e.g., Becky Chao, Sarah Morris, Amir Nasr, Eric Null, Joshua Stager, Comments of New America’s Open Technology Institute, GN Docket No. 18-238, GN Docket No. 18-231, WC Docket No. 11-10, September 17, 2018, <a href="<a href="<a href="<a href="source">source">source">source">source">source ; Christine Ottoni, “Content creators can do more with the fastest Internet,” Ting Wake Forest News, Ting, April 3, 2019, <a href="<a href="<a href="<a href="source">source">source">source">source">source ; Peter Christiansen, ed. Cara Haynes, “What Is a Good Download and Upload Speed?” HighSpeedInternet.com, June 2, 2020, <a href="<a href="<a href="<a href="source">source">source">source">source">source ; and Alex Bybyk, “What is a good upload speed for streaming?” Restream, August 19, 2019, <a href="<a href="<a href="<a href="source">source">source">source">source">source
- Statement of Commissioner Jessica Rosenworcel, Dissenting, “Fourteenth Broadband Deployment Report Notice of Inquiry,” Rosenworcel Dissenting Statement, adopted August 8, 2018, released: August 9, 2018, 14, <a href="<a href="<a href="<a href="source">source">source">source">source">source
- We calculated this number by taking the average difference between installation and self-installation fees for all plans that specified both.
- “What is a Modem,” Linksys, last accessed May 27, 2020, <a href="<a href="<a href="source">source">source">source">source
- Melanie Pinola, “Understanding Wi-Fi and How It Works,” Lifewire, May 1, 2020, <a href="<a href="<a href="source">source">source">source">source
- Molly McLaughlin, “Modem vs. Router: How Do They Differ?” Lifewire, April 9, 2020,<a href="<a href="<a href="source">source">source">source">source ; “Router vs. Modem: What’s the Difference?” Comcast, February 8, 2019, <a href="<a href="<a href="source">source">source">source">source
- This combined price excludes other fees that a consumer would have to pay, such as installation fees, activation fees, and data overage penalties.
- The average data overage penalty fee was calculated using the average data overage penalty for Toronto ISP Ebox, which came to $20.29/GB. Ebox does not specify one fee, but charges between $0.40 and $40.17 per GB over the data cap, so the average overage penalty was calculated assuming one plan charged the lowest end of the range, and another charged the highest. Swisscom in Zurich, eo Hikari, NTT East, and Softbank in Tokyo, Wave in Seattle, and Netvigator in Hong Kong, specify data caps but not the corresponding penalty.
- Danielle Kehl and Patrick Lucey, Artificial Scarcity: How Data Caps Harm Consumers and Innovation, (Washington, DC: New America, June 2015), <a href="<a href="<a href="source">source">source">source">source
- See, e.g., United States Government Accountability Office, Broadband Internet: FCC Should Track the Application of Fixed Internet Usage-Based Pricing and Help Improve Consumer Education, (Washington, DC: United States Government Accountability Office, November 2014),<a href="<a href="<a href="source">source">source">source">source
- See, e.g., Katie Watson, “Data Caps and Vulnerable Populations,” February 4, 2016, Benton Institute for Broadband & Society, <a href="<a href="<a href="source">source">source">source">source
- Katie Watson, “Data Caps and Vulnerable Populations,” February 4, 2016, Benton Institute for Broadband & Society, <a href="<a href="<a href="source">source">source">source">source
- See, e.g.,”Reducing Zoom Data and Bandwidth Use,” Cornell University, last updated March 27, 2020, <a href="<a href="<a href="source">source">source">source">source
- See, e.g., Applications of AT&T Inc. and DIRECTV for Consent to Assign or Transfer Control of Licenses and Authorizations, MB Docket No. 14-90, Memorandum Opinion and Order, para. 213, <a href="<a href="<a href="source">source">source">source">source
- While AT&T isn’t implementing this self-preferencing on its home internet plans at this time, the lack of sufficient guardrails in the form of net neutrality protections does not rule out this possibility in the future; Nilay Patel, “HBO Max won’t hit AT&T data caps, but Netflix and Disney Plus will,” Verge, June 2, 2020, <a href="<a href="<a href="source">source">source">source">source ; Jon Brodkin, “AT&T exempts HBO Max from data caps but still limits your Netflix use,” Ars Technica, June 2, 2020, <a href="<a href="<a href="source">source">source">source">source
- Rob Pegoraro, The Coronavirus Might Have Just Killed ISP Data Caps,” Fast Company, March 21, 2020, <a href="<a href="<a href="source">source">source">source">source
- Kathleen Burke, “Keep All Americans Connected By Prohibiting Data Caps During the COVID-19 Pandemic,” Public Knowledge (blog), March 27, 2020, <a href="<a href="<a href="source">source">source">source">source
- Jon Brodkin, “Comcast waiving data caps hasn’t hurt its network—why not make it permanent?,” Ars Technica, March 31, 2020, <a href="<a href="<a href="source">source">source">source">source
- Danielle Kehl and Patrick Lucey, Artificial Scarcity: How Data Caps Harm Consumers and Innovation, (Washington, DC: New America, June 2015), 7, <a href="<a href="<a href="source">source">source">source">source
- Tyler Cooper, “Internet Contracts and Fees: what you need to know,” BroadbandNow, July 16, 2018, <a href="<a href="<a href="source">source">source">source">source
- We calculate the average early contract termination fee using two data points for the Magnet plan advertised in Dublin. Magnet charges between $124.62 and $249.25 for early contract termination. We include one data point for the minimum fee and another for the maximum, coming to an average contract termination fee of $186.94 for Magnet.
- We calculated this number by taking the average difference between early termination fees for plans that advertised same speeds, but different monthly prices for different contract lengths.
- See, e.g., Oren Bar-Gill and Omri Ben-Shahar, “Exit from Contract,” Journal of Legal Analysis, 6 no.1, (October 2014): 151–183, <a href="<a href="<a href="source">source">source">source">source
- Oren Bar-Gill and Omri Ben-Shahar, “Exit from Contract.”
- Tom Wheeler, “Prepared Remarks of FCC Chairman Tom Wheeler: ‘The Facts and Future of Broadband Competition,’” Federal Communications Commission, September 4, 2014, <a href="<a href="<a href="source">source">source">source">source
- See H. Trostle and Christopher Mitchell, Profiles of Monopoly:Big Cable and Telecom, (Institute for Local Self-Reliance, July 2018), <a href="<a href="<a href="source">source">source">source">source
- “Contract Buyout Eligibility and Redemption Details,” Residential Terms of Service, Charter Communications, last accessed May 27, 2020, <a href="<a href="<a href="source">source">source">source">source
- “Early Termination Fee Instructions,” Verizon, last accessed May 27, 2020, <a href="<a href="<a href="source">source">source">source">source
- See, e.g., Oren Bar-Gill and Omri Ben-Shahar, “Exit from Contract,” Journal of Legal Analysis, 6 no.1, (October 2014): 151–183, <a href="<a href="<a href="source">source">source">source">source
- See, e.g., “Early Termination Fee Instructions,” Verizon, last accessed May 27, 2020, <a href="<a href="<a href="source">source">source">source">source
- This plan count excludes six plans with identical monthly prices for different contract terms. The plans excluded are identified in our methodology.
- We calculate the average price for all plans in our dataset using the promotional price for each entry unless it is not available, in which case, we use the non-promotional price instead. Because providers do not always offer plans with promotional pricing or disclose non-promotional pricing, this average captures our dataset most comprehensively.
- “Community Network Map,” Institute for Local Self-Reliance, updated January 2020, <a href="<a href="source">source">source">source
- Claire Park, Community Broadband: The Fast, Affordable Internet Option That's Flying Under the Radar (Washington, D.C.: New America, 2020), <a href="<a href="source">source">source">source ;Becky Chao and Lukas Pietrzak, The Cost of Connectivity in Ammon, Idaho, (Washington, D.C.: New America’s Open Technology Institute, January 22, 2020), <a href="<a href="source">source">source">source
- We exclude any additional fees that apply to plans operating on municipal networks in our analysis. In Ammon, Idaho, for example, consumers of the city’s open access network are subject to an additional monthly utility fee of $16.50 and separate construction fee paid to the city, on top of the monthly price paid to the provider. See Becky Chao and Lukas Pietrzak, The Cost of Connectivity in Ammon, Idaho, (Washington, D.C.: New America’s Open Technology Institute, January 22, 2020), <a href="<a href="source">source">source">source for more information.
- This comparison only includes monthly internet costs and excludes any additional fees. For the private network comparison, we use the average cost per Mbps based on monthly prices and speeds advertised by AT&T in Lafayette, La.
- This comparison only includes monthly internet costs and excludes any additional fees. See Becky Chao and Lukas Pietrzak, The Cost of Connectivity in Ammon, Idaho, (Washington, D.C.: New America’s Open Technology Institute, January 22, 2020), <a href="<a href="source">source">source">source for more information.
- Jon Brodkin, “Comcast, Beware: New city-run broadband offers 1Gbps for $60 a month,” Ars Technica, August 30, 2019, <a href="<a href="source">source">source">source
- Dan Mahoney and Greg Rafert, “Broadband Competition Helps to Drive Lower Prices and Faster Download Speeds for U.S. Residential Consumers,” Analysis Group Whitepaper, November 2016, 21-22, 24, <a href="<a href="source">source">source">source
- Rafi Goldberg, “Unplugged: NTIA Survey Finds Some Americans Still Avoid Home Internet Use,” National Telecommunications and Information Administration, April 15, 2019, <a href="<a href="source">source">source">source
- Elise Gould, “Black-white wage gaps are worse today than in 2000,” Economic Policy Institute, February 27, 2020, <a href="<a href="source">source">source">source
- See, e.g., S. Derek Turner, Digital Denied: The Impact of Systemic Racial Discrimination on Home-Internet Adoption, (Free Press: December 2016), <a href="<a href="source">source">source">source; Robert Fairlie, “Race and the Digital Divide,” UC Santa Cruz: Department of Economics, UCSC, September 11, 2014, <a href="<a href="source">source">source">source
- Brian Howard and Traci Morris, Tribal Tech Assessment: The State of Internet Service on Tribal Lands, (American Indian Policy Institute: July 27, 2019), <a href="<a href="source">source">source">source
- See, e.g., S. Derek Turner, Digital Denied: The Impact of Systemic Racial Discrimination on Home-Internet Adoption, (Free Press: December 2016), <a href="<a href="source">source">source">source; AT&T has also allegedly engaged in “digital redlining” in Cleveland, Ohio, see, e.g., Bill Callahan, “AT&T’s Digital Redlining Of Cleveland,” National Digital Inclusion Alliance (blog), March 10, 2017, <a href="<a href="source">source">source">source
- Darrick Hamilton, Preface, Dedrick Asante-Muhammad, Chuck Collins, and Omar Ocampo, White Supremacy is the Preexisting Condition: Eight Solutions to Ensure Economic Recovery Reduces the Racial Wealth Divide, Institute for Policy Studies, June 19, 2020, <a href="<a href="source">source">source">source; See, also, Ernie Tedeschi and Quoctrung Bui, “Unemployment Tracker: Job Losses for Black Workers Are Deepening,” New York Times, last updated June 16, 2020, <a href="<a href="source">source">source">source
- Emily A. Vogels, Andrew Perrin, Lee Rainie, and Monica Anderson, “53% of Americans Say the Internet Has Been Essential During the COVID-19 Outbreak,” Pew Research Center, April 30, 2020, <a href="<a href="source">source">source">source
- Emily A. Vogels, Andrew Perrin, Lee Rainie, and Monica Anderson, “53% of Americans Say the Internet Has Been Essential During the COVID-19 Outbreak.”
- See, e.g., By Suzanne Woolley, Nikitha Sattiraju, and Scott Moritz, “U.S. Schools Trying to Teach Online Highlight a Digital Divide,” Bloomberg, March 26, 2020,<a href="<a href="source">source">source">source
- Emily A. Vogels, Andrew Perrin, Lee Rainie, and Monica Anderson, “53% of Americans Say the Internet Has Been Essential During the COVID-19 Outbreak,” Pew Research Center, April 30, 2020, <a href="<a href="source">source">source">source
- See, e.g., Brian Howard and Mikhail Sundust, “COVID-19: The Impact of Limited Internet Access and Issues with Social Distancing for Native Students,” American Indian Policy Institute, Spring 2020, <a href="<a href="source">source">source">source
- Jonathan Sallet, “Tell The Story We Know: Broadband Competition is Too Limited,” Benton Institute for Broadband & Society, March 6, 2020, <a href="<a href="source">source">source">source
- A report from the Benton Institute for Broadband and Society found that low-income participants in the Twin Cities, Minnesota were able to afford internet services offered by non-profit partnership programs at $10 per month. Colin Rhinesmith, Digital Inclusion and Meaningful Broadband Adoption Initiatives, (Evanston, IL: Benton Institute for Broadband and Society, January 2016), <a href="<a href="source">source">source">source
- This plan count excludes six plans that offer the same monthly price at different contract terms. The excluded plans are disclosed in our “Methodology” section.
- This average was calculated for the 64 plans that offered an initial promotional price of $50 and under and advertised the non-promotional price on their websites. Plans that did not disclose non-promotional prices were excluded from this calculation.
- For instance, community members enrolled in a non-profit partnership program offering internet access for $10 a month have said that increasing the cost to $20 a month would pose financial difficulties. Colin Rhinesmith, Digital Inclusion and Meaningful Broadband Adoption Initiatives, (Evanston, IL: Benton Institute for Broadband and Society, January 2016), <a href="<a href="source">source">source">source
- This plan count excludes six plans that offer the same monthly price at different contract terms. The excluded plans are disclosed in our “Methodology” section.
- See Becky Chao and Lukas Pietrzak, The Cost of Connectivity in Ammon, Idaho, (Washington, D.C.: New America’s Open Technology Institute, January 22, 2020), <a href="<a href="source">source">source">source for more information.
- Providers abroad did not appear to advertise similar discounts.
- See, e.g., Xavier Jaravel, The Unequal Gains from Product Innovations: Evidence from the U.S. Retail Sector, The Quarterly Journal of Economics 134, issue 2, (May 2019): 715–783, <a href="<a href="source">source">source">source
- Bourree Lam, “The Surging Cost of Basic Needs,” Atlantic, June 2, 2016, <a href="<a href="source">source">source">source
- Sarah Morris, Joshua Stager, Eric Null, Amir Nasr, Becky Chao, Comments of New America’s Open Technology Institute in the Matter of Bridging the Digital Divide for Low-Income Consumers, WC Docket No. 17-287, (February 21, 2018), <a href="<a href="source">source">source">source
- “Spectrum Internet Assist,” Charter, last accessed May 27, 2020, <a href="<a href="source">source">source">source
- AT&T provides the fastest speed available at a consumer’s residence. “Frequently Asked Questions,” Low-Cost Home Internet, AT&T, last accessed May 27, 2020, <a href="<a href="source">source">source">source
- At $5 a month, the AT&T plan charges low-income consumers by 10.42 times more than the average cost of plans in our U.S. dataset.
- Amir Nasr and Claire Park, “The Government Is Severing a Lifeline for Low-Income Americans,” New America Weekly, March 5, 2020, <a href="<a href="source">source">source">source ; Federal Communications Commission, Fifth Report and Order, Memorandum Opinion and Order on Reconsideration, and Further Notice of Proposed Rulemaking, WC Docket No. 17-287, WC Docket No. 11-42, WC Docket No. 09-197, adopted October 30, 2019, released November 14, 2019,<a href="<a href="source">source">source">source
- See, e.g. “AT&T to Pay $60 Million to Resolve FTC Allegations It Misled Consumers with ‘Unlimited Data’ Promises,” Federal Trade Commission, November 5, 2019, <a href="<a href="source">source">source">source
- We calculate this average for the 299 plans that providers advertised both promotional and non-promotional pricing for. Plans that did not disclose either promotional or non-promotional prices are excluded from this calculation.
- We calculate this average for the 140 plans that providers advertised both promotional and non-promotional pricing for. Plans that did not disclose either promotional (meaning that providers did not offer promotional pricing) or non-promotional prices are excluded from this calculation.
- We calculate the size of the price increase for the 140 plans with both advertised promotional and non-promotional pricing by taking the size of the promotional and dividing it by the initial promotional price.
- See David Talbot, Kira Hessekiel, and Danielle Kehl, Community Owned Fiber Networks: Value Leaders in America, (Cambridge, MA: Berkman KleinCenter for Internet & Society, 2017), <a href="<a href="source">source">source">source
- “14. Acceptable Use,” AT&T Website Terms of Use, AT&T, effective January 2020, <a href="<a href="source">source">source">source ; “Century Link Website User Agreement,” CenturyLink, effective June 1, 2014, <a href="<a href="source">source">source">source
- “Terms and Conditions,” Verizon, last accessed May 27, 2020, <a href="<a href="source">source">source">source
- “AT&T Internet Consumer Fee Schedule,” Legal Policy Center, AT&T, <a href="<a href="source">source">source">source; “AT&T Internet Consumer Fee Schedule,” AT&T, <a href="<a href="source">source">source">source
- Caroline Cakebread, “You're not alone, no one reads terms of service agreements,” Business Insider, November 15, 2017, <a href="<a href="source">source">source">source
- See, e.g., Oren Bar-Gill and Omri Ben-Shahar, “Exit from Contract,” Journal of Legal Analysis, 6 no.1, (October 2014): 151–183, <a href="<a href="source">source">source">source
- WTFee Survey 2018 Nationally Representative Multi-Mode Survey, (Consumer Reports: January 3, 2019), <a href="<a href="source">source">source">source
- WTFee Survey 2018 Nationally Representative Multi-Mode Survey, (Consumer Reports: January 3, 2019)
- “Taxes and Surcharges,” Understand My Bill, Frontier, last accessed May 27, 2020, <a href="<a href="source">source">source">source
- “US cable and fixed telecom bundle rates up to 45% higher than advertised,” GlobalData, September 27, 2019, <a href="<a href="source">source">source">source
- Jon Brodkin, “US Finally Prohibits ISPs From Charging for Routers They Don’t Provide,” Ars Technica, January 7, 2020, <a href="<a href="source">source">source">source ; Frontier has also since gone bankrupt.
- Federal Communications Commission, Report and Order On Remand, Declaratory Ruling, and Order, GN Docket No. 14-28, adopted February 26, 2015, released March 12, 2015, 80, <a href="<a href="source">source">source">source
- Amir Nasr, “Why We Can’t Forget Cost When Discussing Broadband Mapping,” New America Weekly, June 20, 2019, <a href="source">source">source
- “Fixed Broadband Deployment Data from FCC Form 477,” Federal Communications Commission, updated March 12, 2020, <a href="source">source">source
- See, e.g., Max Garland, “WV Broadband Council Chairman Blasts FCC Report, Says Data Isn't Correct,” Charleston Gazette-Mail, February 8, 2018, <a href="source">source">source and Katy Rossiter, “What Are Census Blocks?” United States Census Bureau, July 11, 2011, <a href="source">source">source
- Federal Communications Commission, FCC Form 477 Local Telephone Competition and Broadband Reporting Instructions for Filings as of December 31, 2019 and Beyond, (Federal Communications Commission: May 21, 2020), <a href="source">source">source
- Amir Nasr, “Why We Can’t Forget Cost When Discussing Broadband Mapping,” New America Weekly, June 20, 2019, <a href="source">source">source ; “OTI to FCC: Broadband is Not Reaching All Americans,” New America’s Open Technology Institute (blog), September 19, 2018, <a href="source">source">source ; “OTI Submits Reply Comments Urging FCC To Strengthen Section 706 Review Process,” New America’s Open Technology Institute (blog), October 4, 2018, <a href="source">source">source
- See, e.g., H. Trostle, Christopher Barich, and Christopher Mitchell, Broadband Competition in the Rochester Region: Reality vs Federal Statistics, (Institute for Local Self-Reliance), August 2018, <a href="source">source">source ; “Manchin: FCC Broadband Report is Plain Wrong,” (press release), May 1, 2020, <a href="source">source">source ; April Simpson, “Can You Hear Me Now? In Quest for Federal Money, States Debunk Mobile Providers’ Coverage Claims,” Pew Charitable Trusts, January 23, 2019, <a href="source">source">source
- Ross Schulman, Georgia Bullen, Nick Thieme, “The United States of Broadband Map: Mapping the Gulf Between the Broadband Speeds That ISPs Report and Those Measured by Consumers,” New America’s Open Technology Institute, last updated on July 17th, 2019, <a href="source">source">source
- A survey published by the Pew Research Center in 2019 revealed that whereas 81 percent of households with incomes between $30,000 and $99,000 have home high-speed broadband service, 44 percent of adults with household incomes below $30,000 a year do not. Monica Anderson and Madhumitha Kumar, “Digital divide persists even as lower-income Americans make gains in tech adoption,” Pew Research Center, May 7, 2019, <a href="source">source">source
- Moving Forward Act, H.R. 2, 116th Congress (2020). <a href="source">source">source
- See, e.g., Jon Brodkin, “Lawsuit forces CenturyLink to stop charging ‘Internet Cost Recovery Fee’,” Ars Technica, December 11, 2019, <a href="source">source">source
- Jonathan Schwantes, How Cable Companies Use Hidden Fees to Raise Prices and Disguise the True Cost of Service, (Consumer Reports: October 2019), <a href="source">source">source
- Emily Hong, Laura Moy, and Isabelle Styslinger, Broadband Truth-in-Labeling: Empowering Consumer Choice Through Standardized Disclosure, (New America’s Open Technology Institute: July 2015), <a href="source">source">source ; See, also, Broadband Truth-in-Labeling, (New America’s Open Technology Institute: 2009), <a href="source">source">source
- Consumer and Governmental Affairs, Wireline Competition, and Wireless Telecommunications Bureaus Approve Open Internet Broadband Consumer Labels,” Public Notice, GN Docket No. 14-28, Federal Communications Commission, April 4, 2016, <a href="source">source">source
- Moving Forward Act, H.R. 2, 116th Congress (2020). <a href="source">source">source
- Cecilia Kang, “Comcast is Trying to Improve Its Image With a Program for Low-Income Consumers,” Washington Post, May 9, 2014, <a href="source">source">source
- Jonathan Sallet, Broadband For America’s Future: A Vision For the 2020s, (Evanston, IL: Benton Institute for Broadband & Society, October 2019, <a href="source">source">source
- Fybercom and QWK in Ammon, Idaho advertise service for a monthly price of $9.98 and $9.38 respectively, but these prices do not include the monthly utility, construction, and other fees subscribers pay. See Becky Chao and Lukas Pietrzak, The Cost of Connectivity in Ammon, Idaho, (Washington, D.C.: New America’s Open Technology Institute, January 22, 2020), <a href="source">source">source
- Universal Service Administrative Company, “Lifeline Participation,” Program Data, last accessed May 27, 2020, <a href="source">source">source ; Wyoming and Nebraska share the lowest participation rate among those eligible for Lifeline. The participation rate is estimated to have dropped even further since 2018 to 18 percent in 2019. See Comments of Free Press, WC Docket No. 17-287, WC Docket No. 11-42, WC Docket No. 09-197, Jan. 27, 2020, 11, <a href="source">source">source
- Universal Service Monitoring Report, CC Docket No. 96-45 WC Docket No. 02-6 WC Docket No. 02-60 WC Docket No. 06-122 WC Docket No. 10-90 WC Docket No. 11-42 WC Docket No. 13-184 WC Docket No. 14-58, 2018, 27, <a href="source">source">source
- “OTI Urges FCC to Abandon “Misguided and Cynical” Lifeline Proposal,” New America’s Open Technology Institute (press release), January 27, 2020, <a href="source">source">source
- “OTI Urges FCC to Strengthen Lifeline Safety Net Program During COVID-19 Pandemic,” New America’s Open Technology Institute (press release), March 23, 2020, <a href="source">source">source
- Health and Economic Recovery Omnibus Emergency Solutions Act (HEROES Act), H.R. 6800, 116th Congress, §2 (2020).
- Becky Chao and Lukas Pietrzak, The Cost of Connectivity in Ammon, Idaho, (Washington, D.C.: New America’s Open Technology Institute, January 22, 2020), <a href="source">source">source
- Jonathan Sallet, Broadband for America’s Future: A Vision for the 2020s, (Evanston, IL: Benton Institute for Broadband and Society, October 2019), 50, <a href="source">source">source
- Jonathan Sallet, Broadband for America’s Future: A Vision for the 2020s, 50.
- David Talbot, Kira Hessekiel, and Danielle Kehl, Community-OwnedFiber Networks: Value Leaders in America, (Cambridge, MA: Berkman Klein Center for Internet and Society, January 2018), <a href="source">source">source
- See, e.g., “State Restrictions on Community Broadband Services or Other Public Communications Initiatives,” Baller Stokes and Lide, July 1, 2019, <a href="source">source">source ; Kendra Chamberlain, “Municipal Broadband Is Roadblocked Or Outlawed In 22 States,” BroadbandNow, May 13, 2020, <a href="source">source">source
- “State Restrictions on Community Broadband Services or Other Public Communications Initiatives,” Baller Stokes and Lide, July 1, 2019, <a href="source">source">source
- Moving Forward Act, H.R. 2, 116th Congress (2020). <a href="source">source">source; see also Senator Cory Booker, “Community Broadband Act of 2017,” 115th Congress 1st Session, <a href="source">source">source
- See Charles Barr, Lisa Gonzalez, and Christopher Mitchell, “Transcript: Community Broadband Bits Episode 197,” Institute for Local Self-Reliance, April 21, 2016, <a href="source">source">source
- See Susan Crawford, “The New Payola: Deals Landlords Cut with Internet Providers,” Wired, June 27, 2016, <a href="source">source">source ; Broadband Now, The Broadband Report, “Apartment Landlords Are Holding Your Internet Hostage,” July 14, 2016, <a href="source">source">source
- Connect Your Community and the National Digital Inclusion Alliance, “AT&T’s Digital Redlining Of Cleveland,” (Mar. 10, 2017) (“Specifically, AT&T has chosen not to extend its “Fiber To the Node” VDSL infrastructure – which is now the standard for most Cuyahoga County suburbs and other urban AT&T markets throughout the U.S. – to the majority of Cleveland Census blocks, including the overwhelming majority of blocks with individual poverty rates above 35%”).
- Jon Brodkin, “Verizon refuses to give DSL users its low-income deals during pandemic,” Ars Technica, April 7, 2020, <a href="source">source">source
- Katie Kienbaum, “Monopoly ISPs Too Big to Make Good on Covid-19 Internet Offers,” Institute for Local Self-Reliance, April 10, 2020, <a href="source">source">source
- See, Thomas Phillipon, The Great Reversal (Cambridge, MA: Belknap Press, 2019).
- See, e.g, Scott Wallsten and Colleen Mallahan, “residential Broadband Competition in the United States,” March 2010, <a href="source">source">source ; this study uses FCC Census tract data, which may not accurately reflect experienced speeds or number of providers available in a given market.
- Jonathan Sallet, Broadband for America’s Future: A Vision for the 2020s, (Evanston, IL: Benton Institute for Broadband and Society, October 2019), 49, <a href="source">source">source
- Nicholas Hill, Nancy L. Rose, and Tor Winston, “Economics at the Antitrust Division 2014–2015: Comcast/Time Warner Cable and Applied Materials/Tokyo Electron.”
- Charlotte Slaiman and Joshua Stager, Comments on the Draft Vertical Merger Guidelines to the Federal Trade Commission by Public Knowledge and New America’s Open Technology Institute, submitted February 26, 2020,<a href="source">source">source
- Federal Communications Commission, Comcast Corporation and NBC Universal, MB Docket 10-56, para 6, <a href="source">source">source
- Lisa Gonzelez, “Comcast Gamed FCC for Internet Essentials ‘Concession’ in NBC Merger,” Institute for Local Self-Reliance, December 3, 2012, <a href="source">source">source
- See, e.g., Charlotte Slaiman and Joshua Stager, Comments on the Draft Vertical Merger Guidelines to the Federal Trade Commission by Public Knowledge and New America’s Open Technology Institute, submitted February 26, 2020,<a href="source">source">source
- Emily Steel, “Comcast Critics Cast Doubt on Its Intentions,” New York Times, April 23, 2015, <a href="source">source">source
- See “T-Mobile Completes Merger with Sprint to Create the New T-Mobile,” T-Mobile, April 1, 2020, <a href="source">source">source ; Yosef Getachew, Jonathan Schwantes, Goergeo Slover, Joshua Stager, Amir Nasr, Becky Chao, Michael Calabrese, Philip Berenbroick, Dylan Gilbert, Laura Blum-Smith, Petition to Deny of Common Cause, Consumers Union, New America’s Open Technology Institute, Public Knowledge and Writers Guild of America, West, Inc., WT Docket No. 18-197, <a href="source">source">source