Enhancing Representation in Massachusetts: The Case for Preferential and Proportional Electoral Systems

This project was commissioned by New America and is published in collaboration with the Data and Democracy Lab (formerly the Metric Geometry and Gerrymandering Group Lab). This brief summarizes the key findings of the project and features excerpts from the full report.
Overview
The Massachusetts state legislature remains unrepresentative of the state’s population, both in terms of ethnicity and partisanship. This imbalance is partly due to the state’s electoral system, which, like most other states, uses single-member district plurality. In this system, the one candidate who receives the most votes wins each district. Alternative electoral systems—such as ranking systems or list-based proportional systems—could enhance representation in the state.
This brief summarizes a report from the Data and Democracy Lab (formerly the Metric Geometry and Gerrymandering Group), commissioned by New America and led by Professor Moon Duchin. The report presents results of computational simulations of Massachusetts state legislature elections held under different electoral systems: (1) plurality; (2) instant run-off (also known as ranked-choice voting); (3) the single-transferable vote (STV, or proportional ranked-choice voting); and (4) list-based proportional systems. The simulations use ranking models designed to mimic realistic voter behavior and apply them across a large number of plausible electoral maps.
The findings indicate that the single-transferable vote and list-based proportional systems would significantly improve the representation of minority voters—both in terms of race and ethnicity and along partisan lines—in the Massachusetts legislature. However, ranked-choice voting alone would not improve minority representation, as it still elects only one winning candidate for office. The simulations also reveal that while lower minority voter turnout does reduce representation under STV, the impact is less severe than expected. Additionally, minority representation is improved when there are fewer minority candidates on the ballot.
For details on the methodology, simulations, and findings, read the full report.
Research Questions
- How do alternative voting methods impact the representation of minority voters, both ethnic and partisan, in the Massachusetts state legislature?
- How do changes in district magnitude, turnout rates, the number of minority candidates running, and polarization between racial groups influence the representation of minorities in the Massachusetts state legislature?
Key Takeaways
- The single-transferable vote—when voters are able to rank candidates in elections where more than one candidate can win—is likely to achieve a legislature that reflects the demographics of Massachusetts, both in terms of ethnicity and partisanship, based on simulated maps and models. Party-list systems have the same effect on partisan representation.
- Ranked-choice voting in single-winner districts does not help secure the proportional representation of ethnic and partisan minorities in the Massachusetts legislature.
- Too many minority candidates on the ballot can negatively affect minority representation, as it leads to voters spreading their support over various candidates.
Background and Research Design
The Massachusetts bicameral legislative body—formally, the Massachusetts General Court—does not reflect the demographic or political makeup of the state. White members of the legislature are present in proportions that outpace their share of the population by significant margins, while Black, Latino, and Asian residents remain disproportionately underrepresented. Additionally, Republicans are underrepresented in the legislature: Although they consistently secure around 30 percent of the major party vote share in statewide elections, they only make up 7.5 percent of the State Senate and 15.6 percent of the State House.
The winner-take-all electoral system used by Massachusetts—and almost every other state—is largely responsible for this disproportionality. Winner-take-all systems require that jurisdictions be subdivided into smaller electoral districts from which one legislator is elected. This raises the specter of abusive line-drawing practices known as gerrymandering, which have been used to shut out minority groups from power. Even more concerning, studies have shown that even when districts are drawn without the intention to gerrymander, minority groups still tend to be systematically underrepresented in winner-take-all elections.
To fix this problem, reformers have proposed alternative electoral systems in American elections, such as instant runoff voting (IRV), also known as ranked-choice voting (RCV) in single-member districts; the single-transferable vote (STV), or proportional ranked-choice voting in multi-member districts; and list-based proportional representation systems.
In RCV elections, voters rank candidates according to their preferences, and the candidate who wins a majority of the vote share wins the district seat; if no candidate achieves a majority, then the lowest ranked candidate is eliminated, and their votes are transferred to the second-ranked preferences until a majority winner is elected. RCV, however, does not modify the number of legislators elected from each district, so it remains a winner-take-all system. STV, in contrast, expands this number, ostensibly allowing for greater proportionality in the final electoral outcomes. In STV elections, voters also rank candidates based on their preferences; then, when a candidate passes a vote threshold, they win a seat and their votes in excess of the threshold are transferred to the second-ranked candidates until all seats are filled. Like in RCV, if no candidate meets the threshold in the first round, the lowest-ranked candidate gets eliminated and their votes are transferred to the voters’ second-ranked candidates. In list-based systems, voters vote for candidates within a party list, or for a ranked-party list, and then a party wins seats in the district in proportion to its vote share. The party then allocates seats to its candidates based on the number of votes the candidates get or on the original ranking the party presented to voters.
RCV reforms have been gaining momentum in the United States. In 2022, Alaska joined Maine to become the second state employing RCV for statewide elections. Many localities, especially across California, use RCV for mayoral races. And localities like Cambridge, Massachusetts, have been using STV to conduct city council and school board elections since 1941. In 2023, Portland, Oregon, became only the second sizable city to adopt STV.
Despite this momentum, the limited number of localities that use these alternative voting systems for their elections makes it challenging to rigorously study the effects of RCV and STV on minority representation. To gain a better understanding of how alternative voting systems affect representation, this research project used novel computational techniques to simulate elections with realistic electoral maps that can vary in district magnitude while maintaining the size of the current Massachusetts legislature: 40 Senators and 160 legislators.
The project used three novel generative models to simulate voting behavior with ranked-choice ballots in these maps. These models seek to mimic how voters would rank candidates using different strategies. In the Plackett-Luce (PL) model, voters have an overall preference for candidates and then flip a weighted coin to rank from each slate. The Bradley-Terry (BT), or deliberative voter, model has voters assess pairwise comparison of candidates against their preferences. The Cambridge Sampler (CS) model uses historical data from Cambridge, Massachusetts elections, selecting ballot types at random from the record of STV elections. (For examples of other work using these models, see the Political Reform report The Future is Proportional and Moon Duchin and Anthony Pizzimenti’s report Modeling the Fair Representation Act.)
The simulations are done under certain conditions that can be varied, one by one, to understand how the elections play out when these change. These conditions are:
- Structure: The electoral system used. In addition to STV, the project also models RCV, list-based systems, and the status quo of plurality in single-member districts.
- Magnitude: How many legislators are elected from each district. The models use m=1 (for single-member districts) or m=4 or 5 (for multi-member districts).
- Ranking Behavior: The voting behavior model used to rank candidates.
- Bloc Cohesion: The level of polarization between voting blocs versus the cross-over voting within each bloc.
- Candidate Availability: How many candidates run from each group.
- Candidate Strength: The tendency of the voting groups to rank the candidates in each slate in a consensus order or with more variation. This can help model the impact of coordinated campaigns of voter mobilization.
- Voter Turnout: A crucial variable that helps assess the effects of one voting bloc having a higher rate of voting participation than the other.
Results
Updated at 10:30 a.m. on May 6, 2025: This section has been updated with a new figure that more accurately reflects the distribution of possible seats under different electoral systems and allows for a clearer comparison of the performance of the different systems.
The models are assessed relative to the following benchmarks. First, Black and Hispanic proportionality: Black and Hispanic voters together make up 17 percent of the voting-age population (VAP) of the state, so if they were proportionally represented in the legislature, they would have about 17 percent of the seats. The second benchmark is people-of-color (POC) proportionality: Once all non-white voters are included, their share of the VAP increases to 30 percent, so about 30 percent of legislators would be non-white if they were represented in proportion to their share of the VAP. The third benchmark is combined support proportionality: It is the expected share of minority legislators (by race/ethnicity) if 80 percent of voters of color were joined by 30 percent of white voters in supporting candidates of color, equivalent to roughly 45 percent of the VAP. This is the cohesion parameter, or W70/C80, which means that white voters will vote for white candidates 70 percent of the time, and voters of color will vote for candidates of color 80 percent of the time.
Finally, the Elizabeth Warren and Joe Biden benchmarks give an idea of party proportionality. Biden received roughly 67 percent of the major-party vote in 2020, while Elizabeth Warren notched 63 percent against Geoff Diehl in the 2018 Senate contest. Since these candidates were preferred by both voters of color and white voters alike, this should overstate support for the POC-preferred slate under conditions of polarization. The models assume that POC-preferred candidates are POC candidates, and party proportionality refers to the party that was preferred by a majority of POC voters.
The basic model for the Massachusetts Senate simulates elections using STV and maps with five member districts (see the full report for results of the models that vary the parameters and for the results of the state House models). In the model, there is a cohesion parameter of W70/C80 and 15 candidates run in each district. The split of white/non-white candidates is proportional to the white/non-white population in the district, rounded to the nearest integer: If a district has 55 percent minority share of the VAP, then the model runs with eight POC-preferred candidates and seven candidates preferred by the white voting group. Rounding out the basic scenario, it is assumed that each group turns out at the same rate as the share of the voting-age population.
The baseline model simulations for the state senate find that STV would improve minority representation. In all models, POC-preferred candidates were predicted to win a range of seats that exceeds the number of seats we’d expect if the share of Black and Hispanic voters were proportionally represented in the Senate (seven seats) and the number of seats we’d expect if all voters of color were proportionally represented (12 seats). The range of predicted seats is most in line with support proportionality (18 seats). The Cambridge model produces a higher range of estimated minority-held seats (15–25) because it pulls from historical data and voters do not rank all the candidates in the real world.
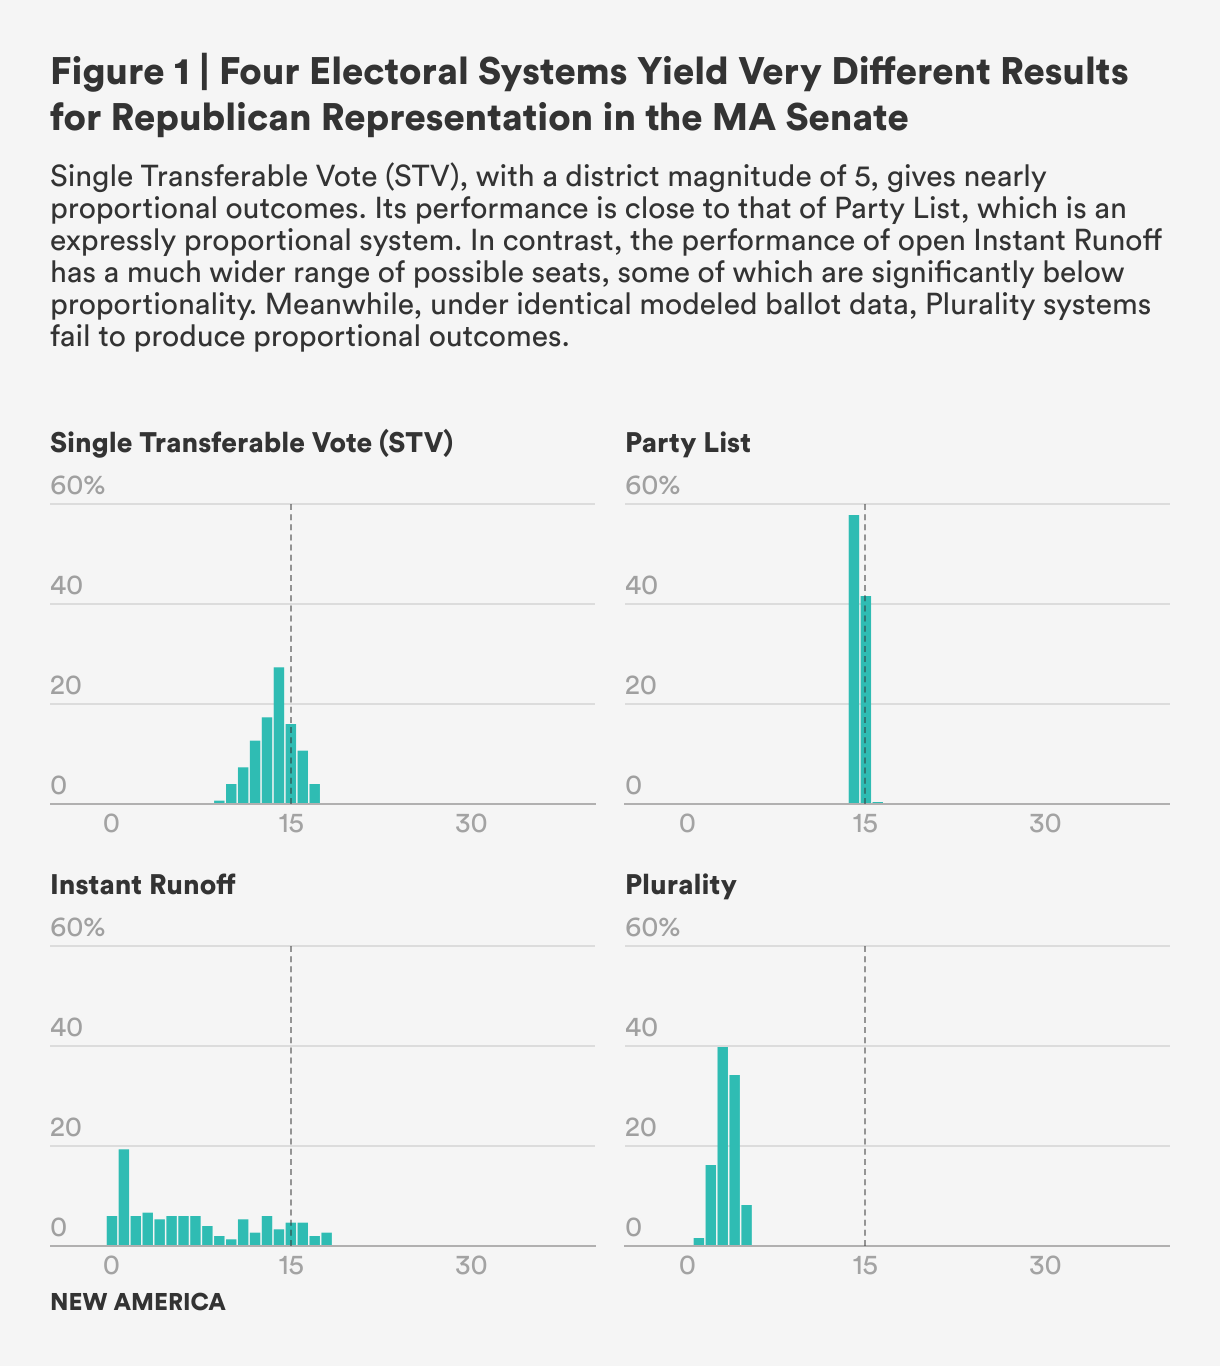
From this baseline model, it is possible to change parameters one at a time. The simulations show that when minority turnout is reduced to two-thirds of white turnout, the representation of voters of color drops but not substantially, with 12 to 24 POC candidates elected instead of 15 to 25. In this case, racial/ethnic minority representation is buffered from a calamitous drop because of high rates of cross-group voting.
Next, the models vary the number of minority candidates in terms of race/ethnicity to assess possible effects of vote splitting. The models restrict minority voters to only Black and Hispanic groups. As a result, the minority share of the VAP drops to 17 percent from 30 percent, but representation actually improves when voters rank based on the Cambridge model. This is because the choice to set up candidates in proportion to the minority population now gives three POC-preferred candidates out of 15 in each district, on average. This turns out to be advantageous, allowing all of them to be elected when voters have a tendency to not rank all the candidates, as in the Cambridge model. In contrast, there is a sharp drop in representation when there are more POC-preferred candidates (a fixed seven out of 15 instead of three out of 15 in each district) because of vote splitting.
The models also indicate that when the minority group is a partisan group (i.e., Republicans in Massachusetts), STV produces roughly proportional outcomes across the simulations under equal turnout. In these models, a drop in Republican turnout has a much larger effect on Republican representation because of high levels of partisan polarization: the high cohesion settings (how many Democrats would vote for Republicans) do not cushion the losses.
Moving beyond STV, the models also explore the effects of party-list systems, comparing them to elections that favored Democrats or Republicans at the state level. List-based systems are expressly proportional, and as expected, the models find that party lists result in more proportional outcomes.
Finally, a direct comparison of the different electoral systems for partisan minority representation produces some surprising results. The performance of RCV is almost indistinguishable to that of the status quo plurality system when it comes to the election of Republicans in proportion to the party’s state vote share. RCV, however, achieves better representation when there are fewer minority candidates running. STV with a magnitude of five representatives per district results in more Republican candidates being elected, although not quite in proportion to their vote share. STV achieves more proportional results for Republicans when there are fewer Republican candidates running in each district. List-based systems perform the best as they mechanically translate vote shares to seats in a proportional manner.
Conclusion
The tools of statistical modeling allow for comparisons across electoral systems, while varying assumptions about voting conditions one at a time. This gives users access to robust projections that can inform reform efforts in Massachusetts and other states with realistic trends and assumptions.
Modeling studies, however, must be interpreted with caution, as their outputs are far from providing guarantees of future performance. One limitation of these models is that they assume that minority-preferred candidates are minority candidates (both in racial/ethnic groups and across party lines), but that is not necessarily true. Moreover, these techniques can only show how outcomes vary if some factors are held constant while others change; the models do not have the capacity to predict endogenous factors, such as the impact on voter mobilization that is brought on by system change itself, or the concomitant changes to campaign strategies and candidate availability.
The broad findings for STV in the two chambers of the state legislature indicate that it is likely to provide representation of choice for communities of color in proportion to the combined support for their slates by minority and majority voters. This is true across a wide range of variations in voter behavior, cohesion, candidate availability, candidate strength, district magnitudes, and the choice of boundary lines for zones. Meanwhile, the mere adoption of ranked-choice without expanding the district magnitude does not achieve greater representation: RCV in single-member districts gives projections that lag as far behind proportionality as status quo plurality elections. This is intuitively reasonable, since it is the larger magnitudes that make fractional outcomes possible—no clever choice of system can give a bloc of voters their “fair share” of a single elected official.
Issues
Programs/Projects/Initiatives
Related