Varying Degrees 2020
Abstract
As states around the country begin to grapple with the economic effects of COVID-19, discussions about value, funding, and accountability in higher education will be front and center.
The Varying Degrees Survey, which seeks to understand how Americans view higher education, was fielded in February 11–24, 2020, before the full force of the pandemic hit the U.S. What was learned will provide an important baseline to help measure how perceptions change over the course of this public health and economic crisis, while informing policy decisions in a post-pandemic world.
Acknowledgments
Varying Degrees was funded by the Bill & Melinda Gates Foundation. New America thanks the foundation for its support. The findings and conclusions contained within are those of the authors and do not necessarily reflect positions or policies of the Bill & Melinda Gates Foundation.
The authors would like to thank Stephen Burd for editing, Sabrina Detlef for her copyediting support, and Riker Pasterkiewicz, Julie Brosnan, Fabio Murgia, Joe Wilkes, and Naomi Mourduch Toubman for their communications and data visualization support.
Executive Summary
Varying Degrees is New America’s annual effort to gauge opinions about education after high school. In the four years since we began to publish the survey, we have seen an economic boom. This year, that boom came to an abrupt and tragic end. Unlike previous recessions, this one has been caused by a global pandemic, and it is unclear how our economy will be able to restart with so many Americans social distancing. As restrictions are loosened, surely some of the tens of millions of people who have lost their jobs will be able to go back to work. Others, however, will have no job to go back to, as months of sheltering in place will close many businesses for good.
What will this mean for colleges and universities? It is too soon to say. Most had to shut down their campuses to stop the spread of COVID-19 and rush to remote learning only. While there is hope that some students will be able to return to physical campuses in the fall, many institutions are planning for a fall semester that will be mostly online. No one knows what this will mean for enrollments, which usually peak anytime a recession occurs. Institutions that have been on the financial brink since the last recession will now face closure either over loss of revenue or enormous growth in tuition to cover funding gaps.
Just before the national emergency, Varying Degrees 2020: New America’s Fourth Annual Survey on Higher Education surveyed 1,512 Americans ages 18 and older to better understand their perceptions of education after high school.1 It provides an important baseline to judge how attitudes and perceptions change in the face of this public health and economic crisis. As in previous years, the survey shows unifying themes, as well as differences, among various demographics when it comes to our questions about value, funding, and accountability. Since the United States is gearing up for a presidential election in the fall, we paid special attention to the political affiliations of respondents.2 Our data will provide a chance to learn how the crisis will change people’s opinions of education beyond high school when we poll Americans again next year.
Our top findings this year include:
- Americans believe that education beyond high school creates more opportunities, is worth the investment, and promotes social mobility. About four in five Americans think people who pursue further education after high school will have more job opportunities than those who do not. A similar number believe that education after high school offers a good return on investment and a staggering 92 percent believe that it offers pathways to economic mobility. Most hope that their children or another close family member pursue education after high school. Only 17 percent of Americans would feel comfortable with their children or close family members pursuing only a high school diploma.
- While Americans believe in the value proposition of education beyond high school, they also believe higher education needs to change. Only one-third of Americans believe higher education is fine the way it is. Cost is the primary concern for the large majority who do not agree that higher education is fine the way it is. About half of Americans believe that someone can find a high-quality education that is also affordable. Approximately 63 percent of Americans believe government should fund higher education because it is good for society, compared with 35 percent who believe it should be funded by individuals because they are the ones who will primarily benefit.
- The vast majority of Americans (90 percent) believe that publicly available data on low graduation rates, high dropout rates, low earnings, and high student loan default rates are important indicators of quality. A majority of respondents also believe that public financial support for colleges and universities should be tied to some of these outcomes. Most Americans agree that a college or university should lose access to taxpayer dollars if it has low graduation rates (78 percent); low rates of graduates earning a living wage (74 percent); high rates of graduates earning less than the average high school graduate (72 percent); low rates of graduates paying down their student loans (68 percent); and high default rates for student loan repayments (64 percent).
Citations
- Methodology can be found in Appendix.
- Political party identification information was gathered at time of survey. D1: What do you consider to be your primary political party identification? Democrat 37%; Republican 26%; Independent 21%; Other 5%; Skipped (on web) 1%. For more information about the demographic splits in Varying Degrees, download the data on source.
Preface
Every year that we collect data for Varying Degrees, New America’s annual survey of how Americans feel about higher education, something new challenges our data collection, interpretation, underlying assumptions, and analysis. And every year we review the questionnaire, make tweaks based on previous data, and add new questions relevant to what is happening at the moment. All of this work is aimed at better understanding the opinions and perceptions of Americans over time when it comes to the value, funding, and accountability of education after high school.
This year started out no different. When New America finalized its survey instrument in early January, a novel coronavirus was spreading in China and seemed a distant reality. When we fielded the survey in February, we were only beginning to understand the possibility that there would be an epidemic spread. By the end of our data collection in late February, the first deaths had been reported in the United States and an outbreak in Washington State was underway. Cases and deaths started being reported around the country. Less than two weeks later, in early March, the World Health Organization declared that this coronavirus, officially referred to as COVID-19, was a global pandemic.
States and localities started instituting restrictions, many eventually calling for extreme social distancing to prevent a surge of cases in our healthcare system. Most colleges and universities told their residential students not to come back from spring break or to leave campus immediately. Local K–12 schools shut down. Students around the country fired up whatever computing technology they had when they were abruptly forced into online learning. Employees who were able to telework were sent home. Much of the service industry shuttered so quickly that unemployment rates soared to levels unseen in modern history, making the worst of unemployment filings from the Great Recession look like a blip. A roaring economy came to a sudden, abrupt halt.
Meanwhile, COVID-19 cases and deaths keep rising. Anxiety and grief abound, leaving people wondering when we will ever return to a normal way of life. So much is unknown. The data we collected pre-pandemic might as well have been a hundred years ago.
In the midst of a global public health and economic crisis, public opinion on education beyond high school has already likely changed. Unlike the previous recession, the economic pain of this recession will be hard to alleviate with our normal financial tools. COVID-19 will not go away anytime soon, and we likely face a year or more of social distancing and shelter in place requirements, which will result in a deeply impacted economy.
Recessions usually equate with more people turning to education after high school to gain skills and pursue careers in a changed economy. During the Great Recession, enrollment soared to heights never seen before in colleges and universities across the nation. So much is unpredictable now, as colleges and universities do not even know if they will be able to host on campus students in the fall. But here are a few things that seem likely. Some will face budget shortfalls so great that they will have to close. State and local budgets will take such a thorough beating that students, many who have faced losses in income, will face steep increases in tuition at public colleges and universities. Online education will be relied on in ways we have never seen before.
No one’s life will go untouched by this crisis. This crisis will fundamentally change our economy in the short term and have repercussions in the long term. Our economy will have to adapt to a new normal for the one to two years when the threat of this disease is the highest. Some sectors will be hard hit, while new industries will grow. Certain ways of doing business will adapt.
Education after high school will also adapt. There will be new programs and new ways to learn and to meet the increasingly complicated lives of today’s students. If federal and state governments want to set the country on the path of economic recovery, they must invest in their citizens. Part of that investment will be through increased funding for post-high school educational opportunities.
Varying Degrees provides the public opinion data to help policymakers understand how people value education after high school, how it should be funded, and how it should be held accountable. Though these data are divorced from the current reality of our economic times, there is no doubt that the value of education after high school will only grow, and they provide an important baseline to judge how attitudes and perceptions change as the result of this crisis. Our numbers show there is strong bipartisan agreement that higher education needs to be funded and that it provides a good return on investment. Next year, we will be able to see the impact of this public health and economic crisis on public opinion about education after high school.
Who knows what the next year will bring. But we remain steadfast in providing researchers and policymakers with important trend line data that will help us understand the new America that emerges.
Findings
Value
The majority of Americans have experienced some type of education after high school.1 According to the U.S. Census Bureau’s 2017 American Community Survey, 60 percent have at least some college experience, and 30 percent hold a bachelor’s degree or higher. These numbers are encouraging, as the value of education beyond high school for individuals and society has been well documented. People with a higher education earn more over a lifetime than those with only a high school diploma.2 They generally live a healthier life, pay more in taxes, and contribute more to charities.3
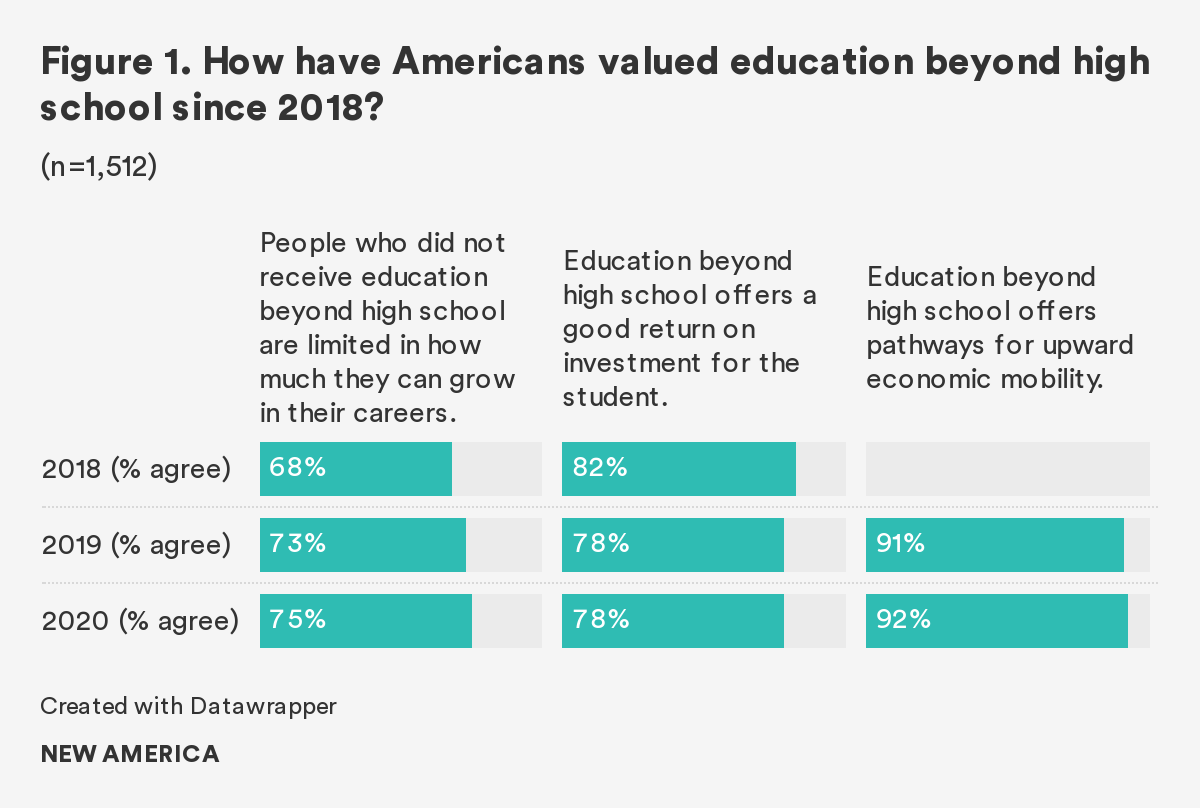
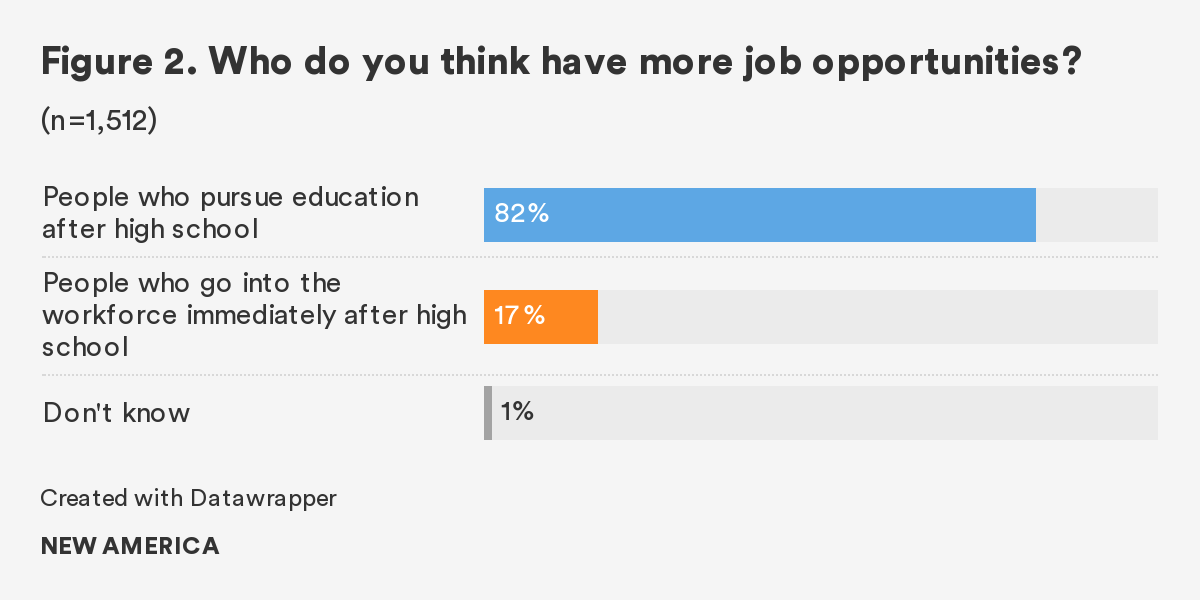
Since 2017, Varying Degrees has shown that Americans also believe in the value of education beyond high school. Americans believe that education beyond high school creates more opportunities, is worth the investment, and promotes social mobility.
Three out of four Americans (75 percent) think that people without education after high school are limited in their career growth, and 82 percent believe people who pursue further education will have more job opportunities than those who only work after graduating from high school. Nearly 80 percent of Americans also believe education beyond high school offers a good return on investment and 92 percent believe it offers a pathway to upward economic mobility. The rates of agreement in these areas have remained mostly consistent since 2018 (See Figures 1-2).
Americans believe that people with any level of higher education—be it some college but no degree, technical certificate, associate degree, or higher—will be better off than those without it. One in two Americans believe that people with some college but no degree will earn more than those without any education beyond high school, and 71 percent believe it is easier for people with only some college to find a well-paying and stable career than those without any education after high school. The share of those agreeing with those statements increases with each higher level of education. Nearly three in four Americans believe those with technical certificates and associate degrees will earn more than those without them. The share rises to 87 percent for those with bachelor’s degrees and more than 90 percent for those with graduate degrees.
Only a small share of Americans (17 percent) recommend their children or family members pursue only up to a high school diploma. Most hope that their close family members will enroll in college and earn some type of higher education credential. A majority of Americans also value apprenticeship, which is an educational model that combines paid, structured on-the-job training with in-classroom learning. Eighty-five percent of Americans feel comfortable recommending their children or family members enroll in an apprenticeship program; 90 percent would do so if that apprenticeship program leads to an associate or bachelor’s degree.
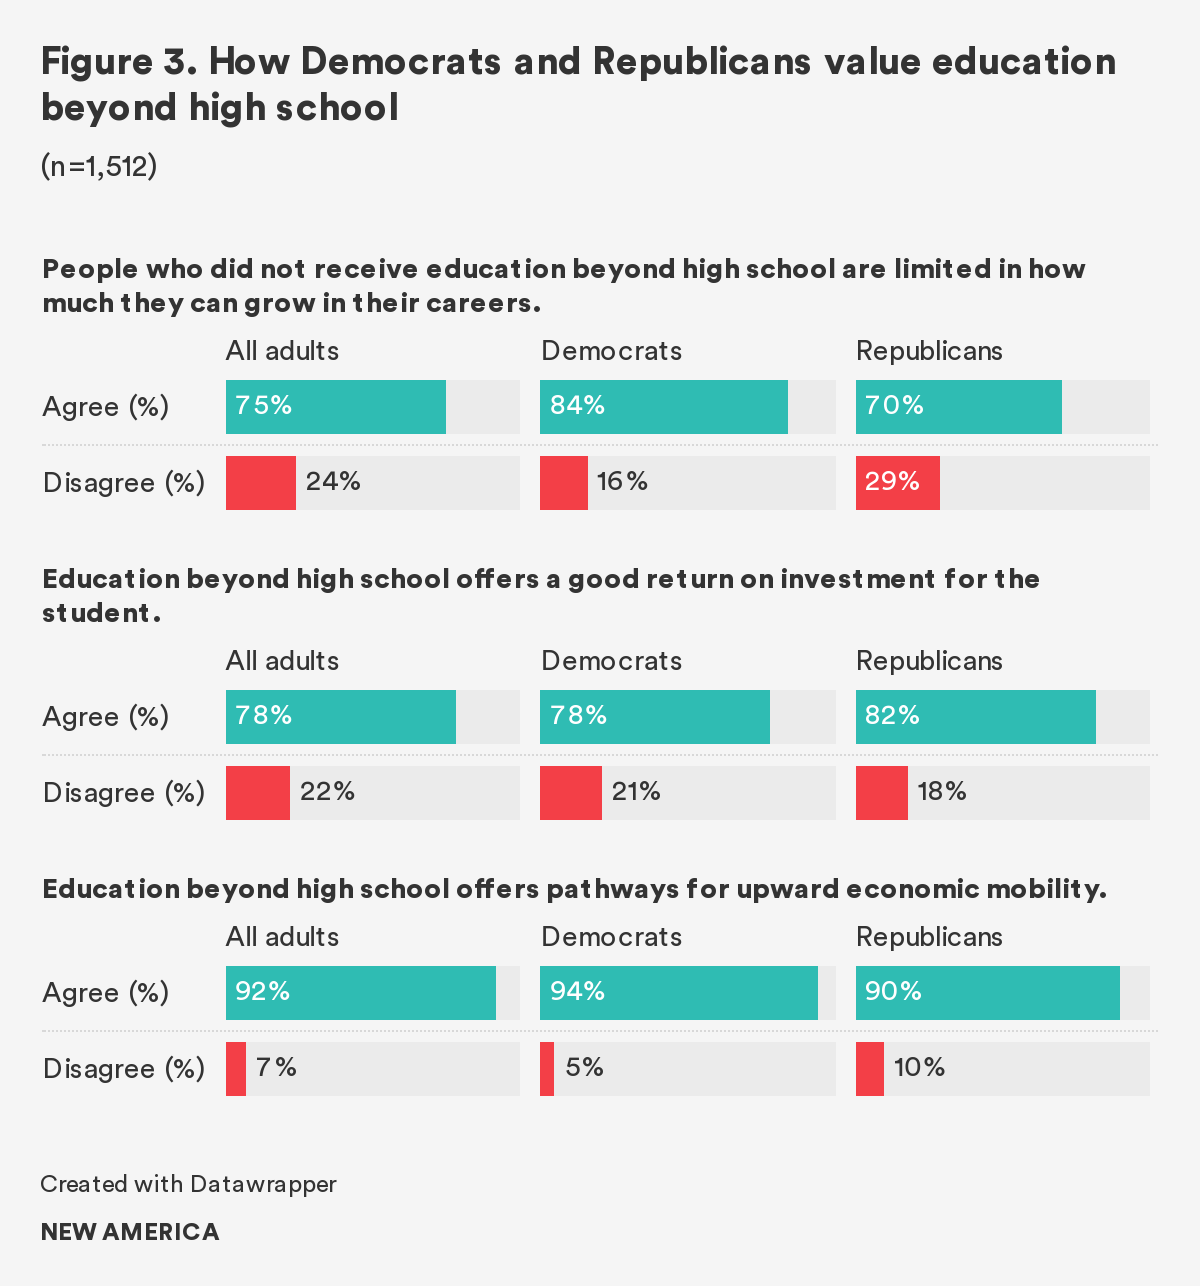
It is rare to see that Democrats and Republicans agree on anything, but the value of higher education is one of the few things that unite them (See Figure 3). A significant majority of Democrats and Republicans think that people without education beyond high school face limitations in their career development, although a significantly greater share of Democrats than Republicans (84 percent versus 70 percent) believe so. Similar shares of both groups agree that education beyond high school offers a good return on investment (Democrats: 78 percent, Republicans: 82 percent) and provides pathways for upward economic mobility (Democrats: 94 percent, Republicans 90 percent). They also agree that each level of education after high school will bring greater income and stability to those who have it and feel comfortable recommending their children or family members pursue education beyond high school.
However, stark differences exist among generations and racial groups, although a majority still believes in education after high school.
Among all generations,4 Millennials seem to be the most dubious about the value of higher education. The share of Millennials who think that people with education after high school have more job opportunities is the smallest (76 percent) among all generations, significantly less than Generation Z (90 percent) and the Silent Generation (93 percent). Fewer Millennials believe in the upward economic mobility provided by education after high school (88 percent) and see the return on investment from higher education (71 percent), than Baby Boomers (95 and 81 percent, respectively) and the Silent Generation (99 and 88 percent, respectively).
A majority of Americans from all races agree with the opportunities that education from higher education can bring, but white and Asian Americans agree at a much higher rate compared to Black and Latinx Americans. A significantly greater share of white and Asian Americans (94 and 96 percent, respectively) agree that education after high school offers pathways for upward mobility than Black and Latinx Americans (86 and 87 percent, respectively). Significantly more white and Asian Americans (86 and 89 percent) think that people with education after high school have more job opportunities, compared with only 69 percent of Black and 74 percent of Latinx Americans.
Americans’ Support for Institutions of Higher Education
Most Americans pursue their undergraduate credentials at a public institution. In 2016, nearly two in three American undergraduates enrolled in either a public two-year or four-year university.5 This number is actually down from the year 2000, when nearly three in four Americans studied at a public institution.6 The expansion of for-profit colleges and universities in the past 20 years is responsible for at least some of the decrease in public higher education enrollment. But, as Varying Degrees has shown since 2017, Americans strongly support public colleges and universities over private nonprofit and for-profit ones (Figure 4).
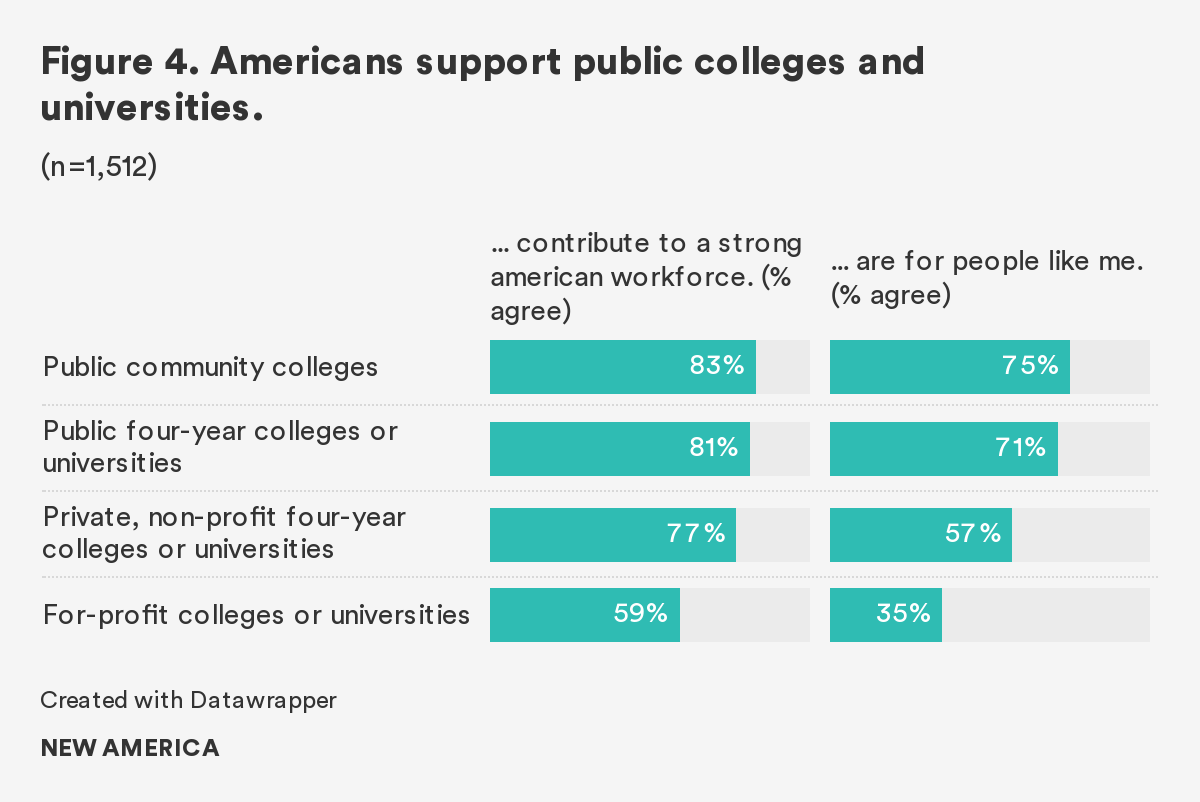
More than four in five Americans agree that community colleges (83 percent) and public four-year colleges and universities (81 percent) contribute to a strong workforce. More than 70 percent think that these institutions are for people like them (75 percent for community colleges and 71 percent for public four-year colleges and universities).
Support for these institutions is widespread across political parties. Eighty-seven percent of Democrats and 84 percent of Republicans think community colleges contribute to a strong workforce, and 78 percent of Democrats and 74 percent of Republicans think community colleges are for people like them. Members of both parties also support public four-year colleges and universities, although a greater share of Democrats (86 percent) than Republicans (79 percent) think public four-year institutions contribute to a strong workforce, and 82 percent of Democrats compared with only 65 percent of Republicans think that public four-year institutions are for them.
The support wavers when it comes to private institutions.
Although more than three in four Americans still believe that private, non-profit colleges and universities contribute to a strong workforce, only 57 percent think that these institutions are for them. These views are similar across the political divide. Eighty percent of Democrats and Republicans think that private, non-profit colleges and universities contribute to a strong workforce, but only around 60 percent think these institutions are for them.
When it comes to for-profit colleges and universities, 59 percent of Americans think that they contribute to a strong workforce, and only 35 percent of Americans think these institutions are for them. While a majority of members of both political parties think that for-profit institutions contribute to a strong workforce (59 percent for Democrats and 61 percent for Republicans). The parties are fairly similar when it comes to believing for-profit institutions are for them: 41 percent of Republicans agree with that statement, compared with 36 percent of Democrats.
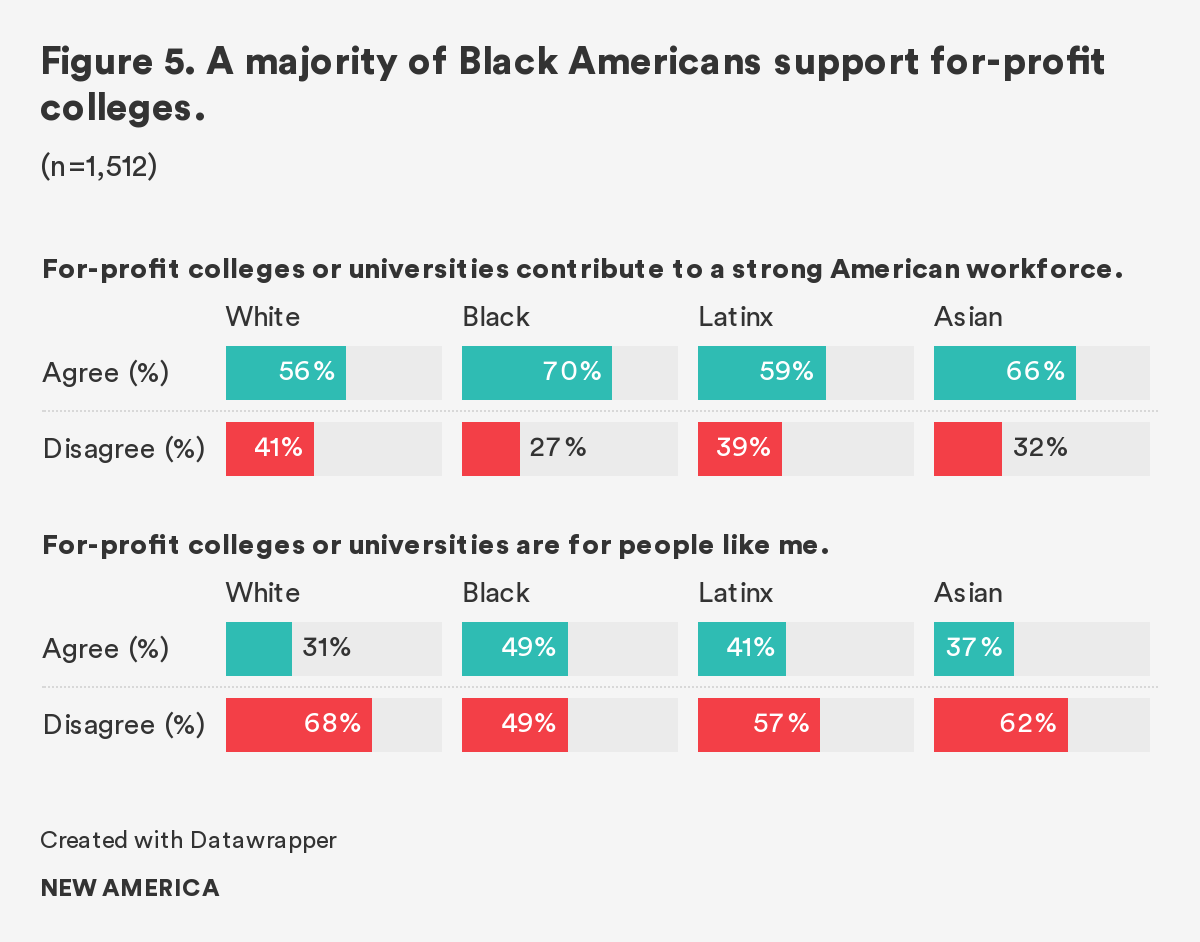
While most Americans do not favor for-profit colleges and universities, a majority of Black Americans think otherwise. Seventy percent of Black Americans believe that for-profit colleges and universities contribute to a strong workforce, significantly more than the share of white (56 percent) and Latinx (59 percent) Americans who think so (Figure 5). Nearly half of Black Americans (49 percent) think that for-profit institutions are for people like them, significantly more than the share of white Americans (31 percent) who do so. This is deeply concerning, given the notoriously poor outcomes of for-profit colleges.7
Despite any differences Americans have over college sectors, a majority of them still think positively of colleges and universities near them and across the country. Four in five Americans (78 percent) have a positive view of the colleges and universities near them, and 71 percent have a positive view of these institutions across the U.S.
Although a greater share of Democrats than Republicans have a positive view of institutions of higher education locally (84 versus 75 percent) and nationally (79 versus 68 percent), the response shows that Republican support for colleges and universities remains solid.
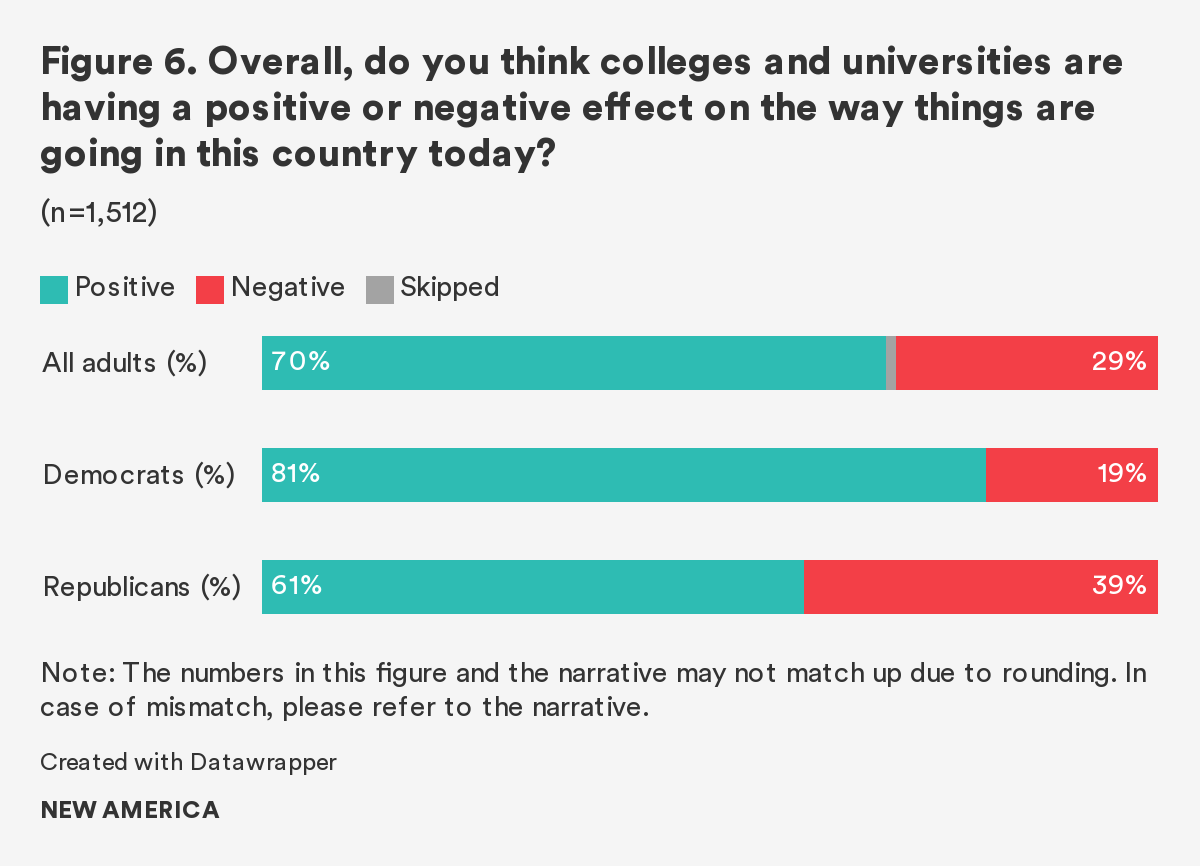
To further explore how the two parties differ in their views of higher education, we adopted a question from the Pew Research Center’s survey on what Americans think of institutions in the U.S. In a Pew survey conducted in 2019, only half of Americans thought colleges and universities have a positive effect on the ways things were going in the country, and 38 percent said the effect was negative.8 In the survey, the partisan divide on colleges and universities runs deep: 67 percent of Democrats think these institutions have a positive effect, while a significant share of Republicans (59 percent) think they have a negative one.9
But Varying Degrees shows different responses to this same question (Figure 6). In our survey, 69 percent of Americans think colleges and universities have a positive effect on the way things are going in the country today, and a majority of both Democrats (80 percent) and Republicans (60 percent) believe so. The widely different responses between the two surveys could be due to differences in survey design, but they also suggest that Republicans’ perceptions of higher education is more nuanced than can be captured in the two surveys.
As Varying Degrees has shown over past years, both Republicans and Democrats recognize the value of education beyond high school, believe that different types of colleges and universities contribute to a strong American workforce, and have positive views of colleges and universities located near them.
Funding
While Americans value education after high school and want their children to enroll in college, many are deeply concerned about how much it costs and how it should be funded to ensure there is broad access.
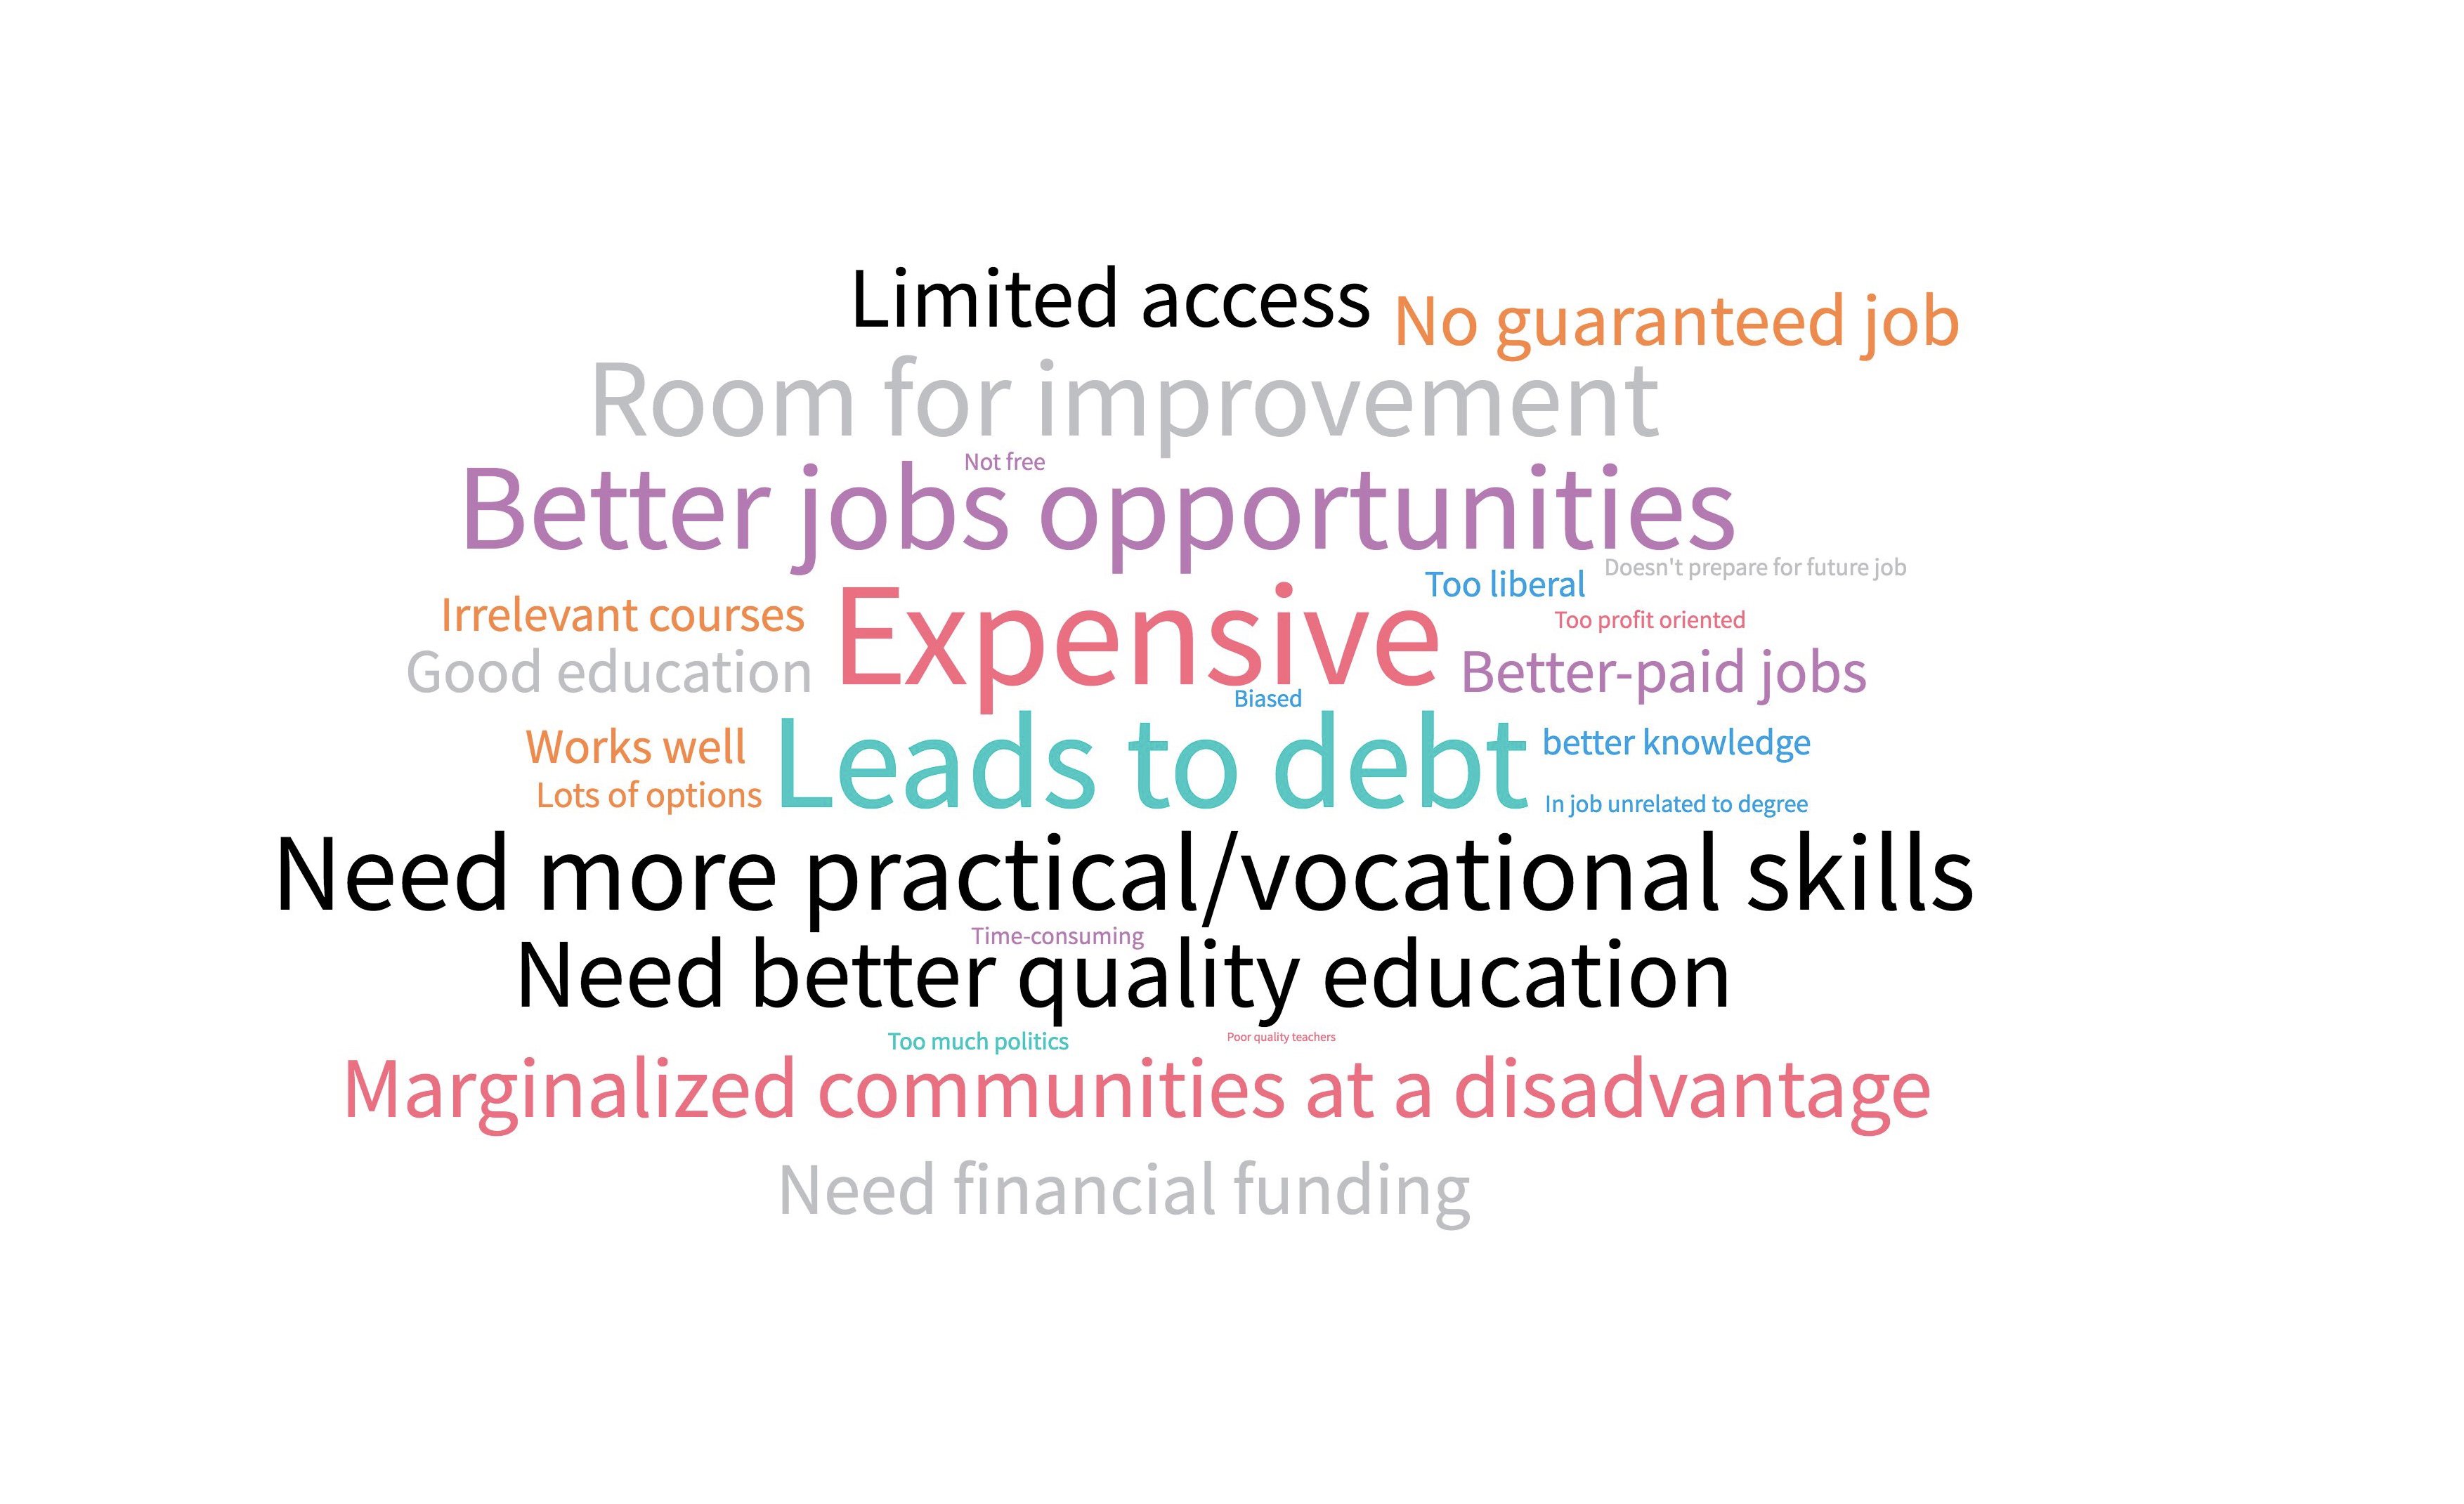
Only about one in three (35 percent) Americans believe higher education is fine how it is (Figure 7). While this is an improvement from when we first asked this question in 2017—when only about a quarter of Americans agreed higher education was fine the way it is—people still strongly indicate that higher education needs to change. The major reason: concern over price (Figure 8).
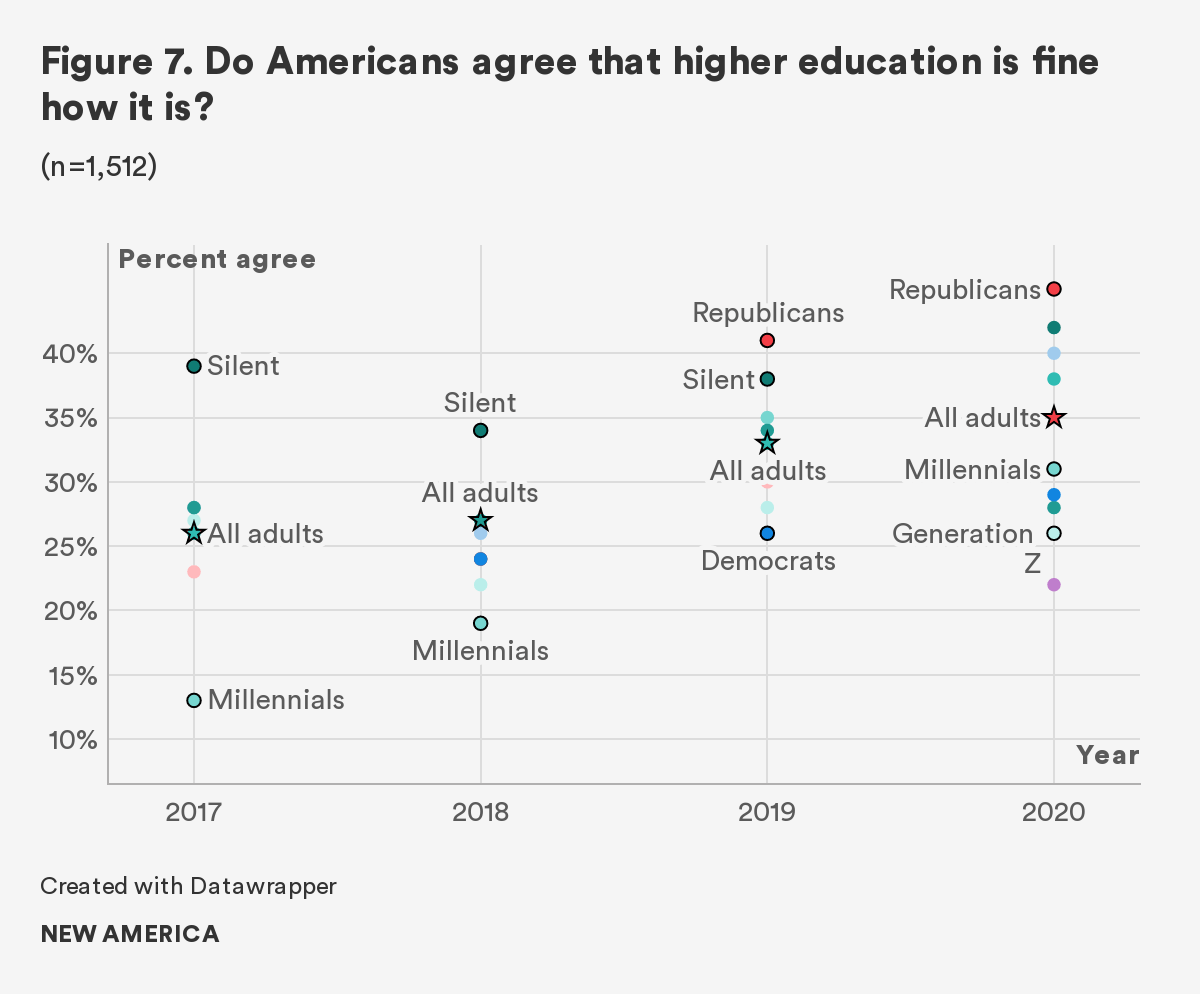
This concern—that higher education needs to change—holds true among all demographics, though at varying levels of intensity. For example, Republicans are more likely to agree (45 percent) that higher education is fine the way it is, compared with Democrats (29 percent). The younger you are, the less agreement that higher education is fine (Generation Z, 26 percent; Millennials, 31 percent; Generation X, 38 percent; Baby Boomers, 38 percent, and the Silent Generation, 42 percent). Men (40 percent) are more likely to agree higher education is fine compared with women (31 percent). And only about one in five (22 percent) student loan borrowers agree higher education is fine. Everyone’s top concern, over and over, is price.
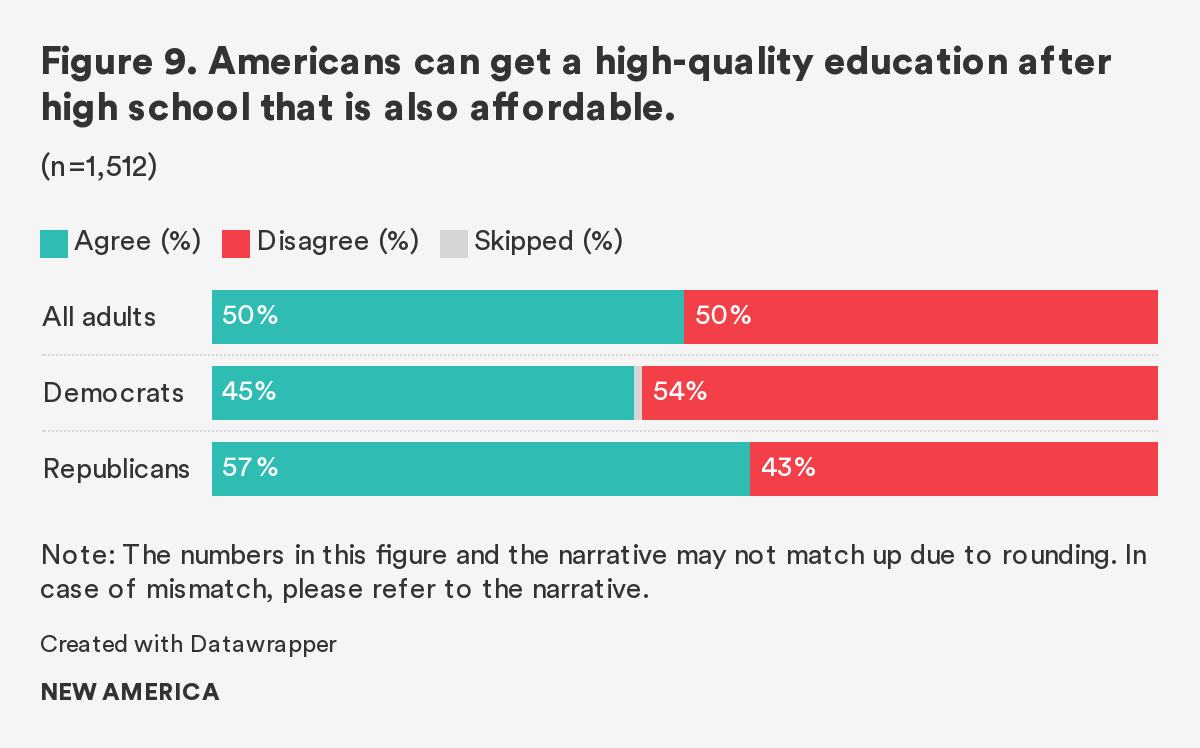
Similar to last year, those polled are equally divided (50 percent agree, and 50 percent disagree) about whether Americans can get a high-quality education after high school that is also affordable (Figure 9). There is a significant difference along party lines on the matter, with over half (57 percent) of Republicans and under half (45 percent) of Democrats agreeing that Americans can get a high-quality and affordable education after high school.
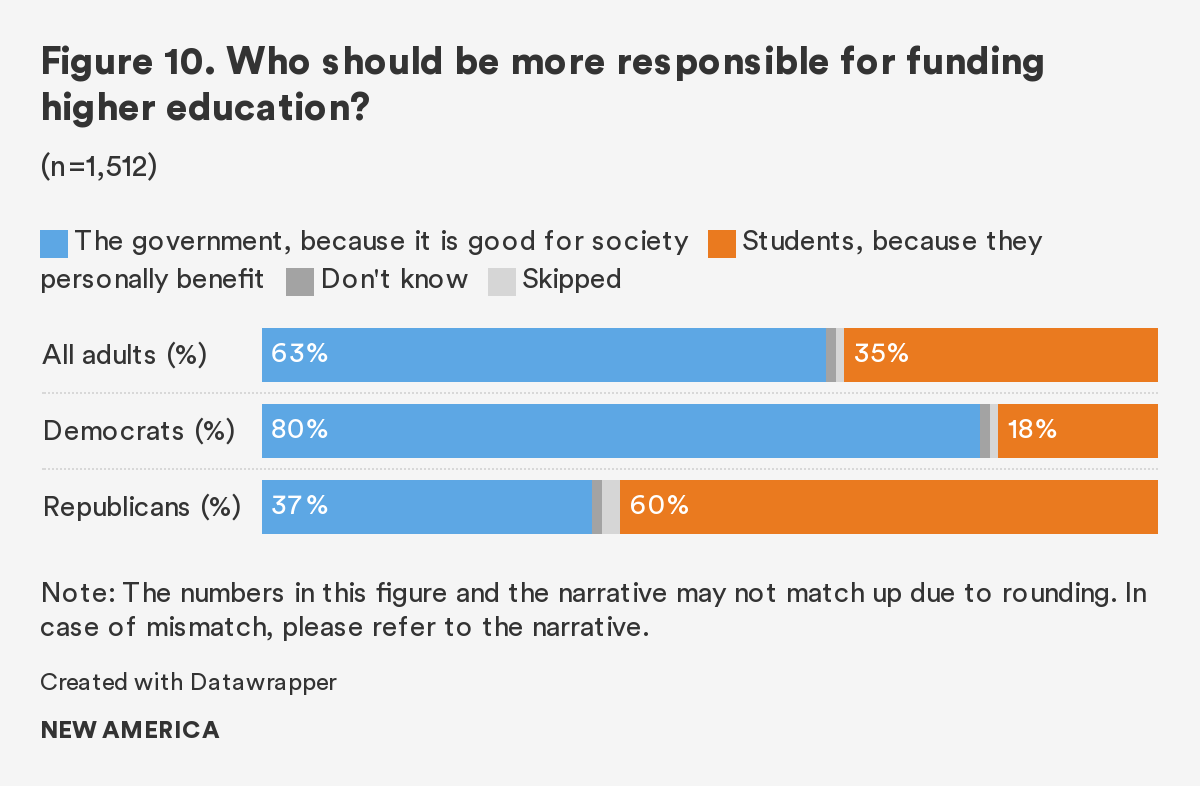
This divergence in opinions over access to an affordable education after high school could partly be explained by opposing views about who should be more responsible for funding higher education: government or individuals. Similar to last year, 63 percent of Americans overall believe that higher education should be funded by the government because it is good for society, compared with 35 percent who believe it should be funded by individuals because they personally benefit (Figure 10).10 But when looking at party identification, a stark ideological difference emerges. For Democrats, a large majority (81 percent) believe it is government who should fund higher education, whereas 60 percent of Republicans believe just the opposite, that individuals should fund it because it is a personal benefit.
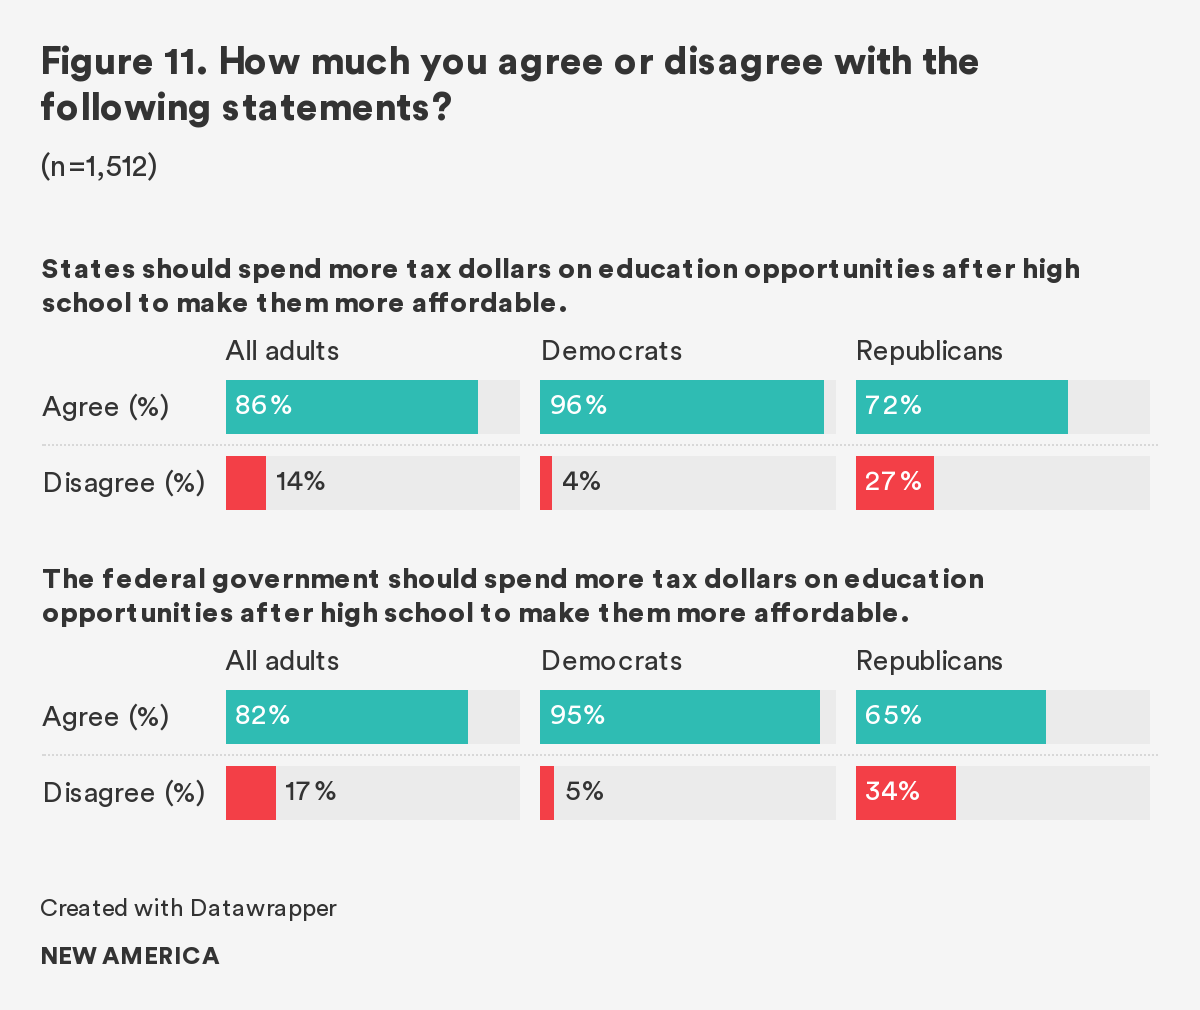
Yet despite the divergent views over who should fund higher education, Democrats and Republicans agree that more state and federal tax dollars should be spent on educational opportunities after high school to make them more affordable, though at varying levels of intensity (Figure 11). Overall, and similar to previous years’ surveys, a sizable majority of Americans believe that states (86 percent) and the federal government (82 percent) should spend more tax dollars on post-high school educational opportunities to make them more affordable. But Democrats are much more likely to agree that states (96 percent) and the federal government (95 percent) should make higher education more affordable compared to Republicans (72 percent agree states should spend more; 65 percent agree the federal government should spend more).
While Americans are clear in their agreement that state and federal governments should spend more to make education after high school affordable, they have different thoughts about which types of institutions that money should be targeted at, and to which kinds of students.
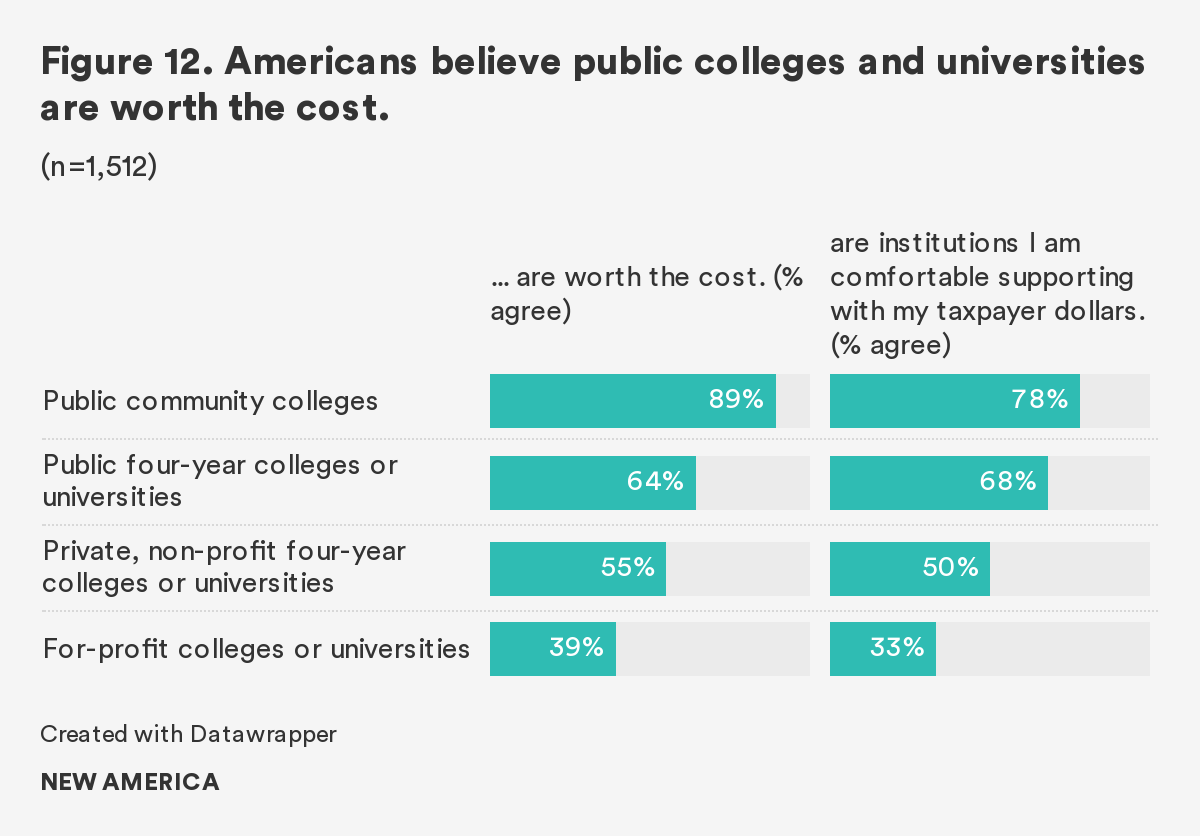
Overall, most Americans believe that colleges and universities in the public and private nonprofit sector are worth the cost, although they believe this most strongly for public two-year institutions (Figure 12). Approximately 89 percent of Americans believe public two-year colleges are worth the cost compared with 64 percent of American who believe this to be true for public four-year colleges, and 55 percent who do so for private nonprofit institutions. However, the majority of Americans do not believe that for-profit colleges are worth the cost. Only 39 percent said they were. This is a drop from last year’s survey, in which 46 percent of Americans agreed that they were worth the cost.
Republicans and Democrats agree that public and private nonprofit institutions are worth the cost. However, a larger share of Democrats believe this to be the case for public community colleges (86 percent of Democrats versus 78 percent of Republicans) and public four-year colleges and universities (72 percent versus 63 percent, respectively). A larger share of Republicans (46 percent) believe that for-profit institutions are worth the cost compared with Democrats (38 percent).
In terms of where tax dollars should be spent, a greater percentage of those polled believe that their tax dollars should go to support our nation’s public colleges and universities than private nonprofit and for-profit institutions. Approximately 78 percent of Americans are comfortable supporting public community colleges and 68 percent of Americans are comfortable supporting public four-year colleges and universities with their tax dollars. Support is much lower for spending tax dollars on private nonprofit and for-profit institutions. Approximately half of Americans are comfortable spending tax dollars on private non-profit colleges, and only one-third are comfortable supporting for-profit institutions in this way.
A larger share of Democrats is comfortable supporting public community colleges (86 percent), public four-year institutions (84 percent), and private nonprofit institutions (59 percent) than Republicans. A majority of Republicans are comfortable with their tax dollars going to support public community colleges (69 percent) and public four-year colleges (54 percent). However, unlike Democrats, less than half of Republicans agree they feel comfortable using their taxpayer dollars to support private nonprofit colleges and universities (41 percent). When it comes to for-profit institutions, only about a third of both Democrats and Republicans agree that they feel comfortable supporting these institutions with their tax dollars even though the Trump administration and Republican congressional leadership often try to expand government funding to these institutions.
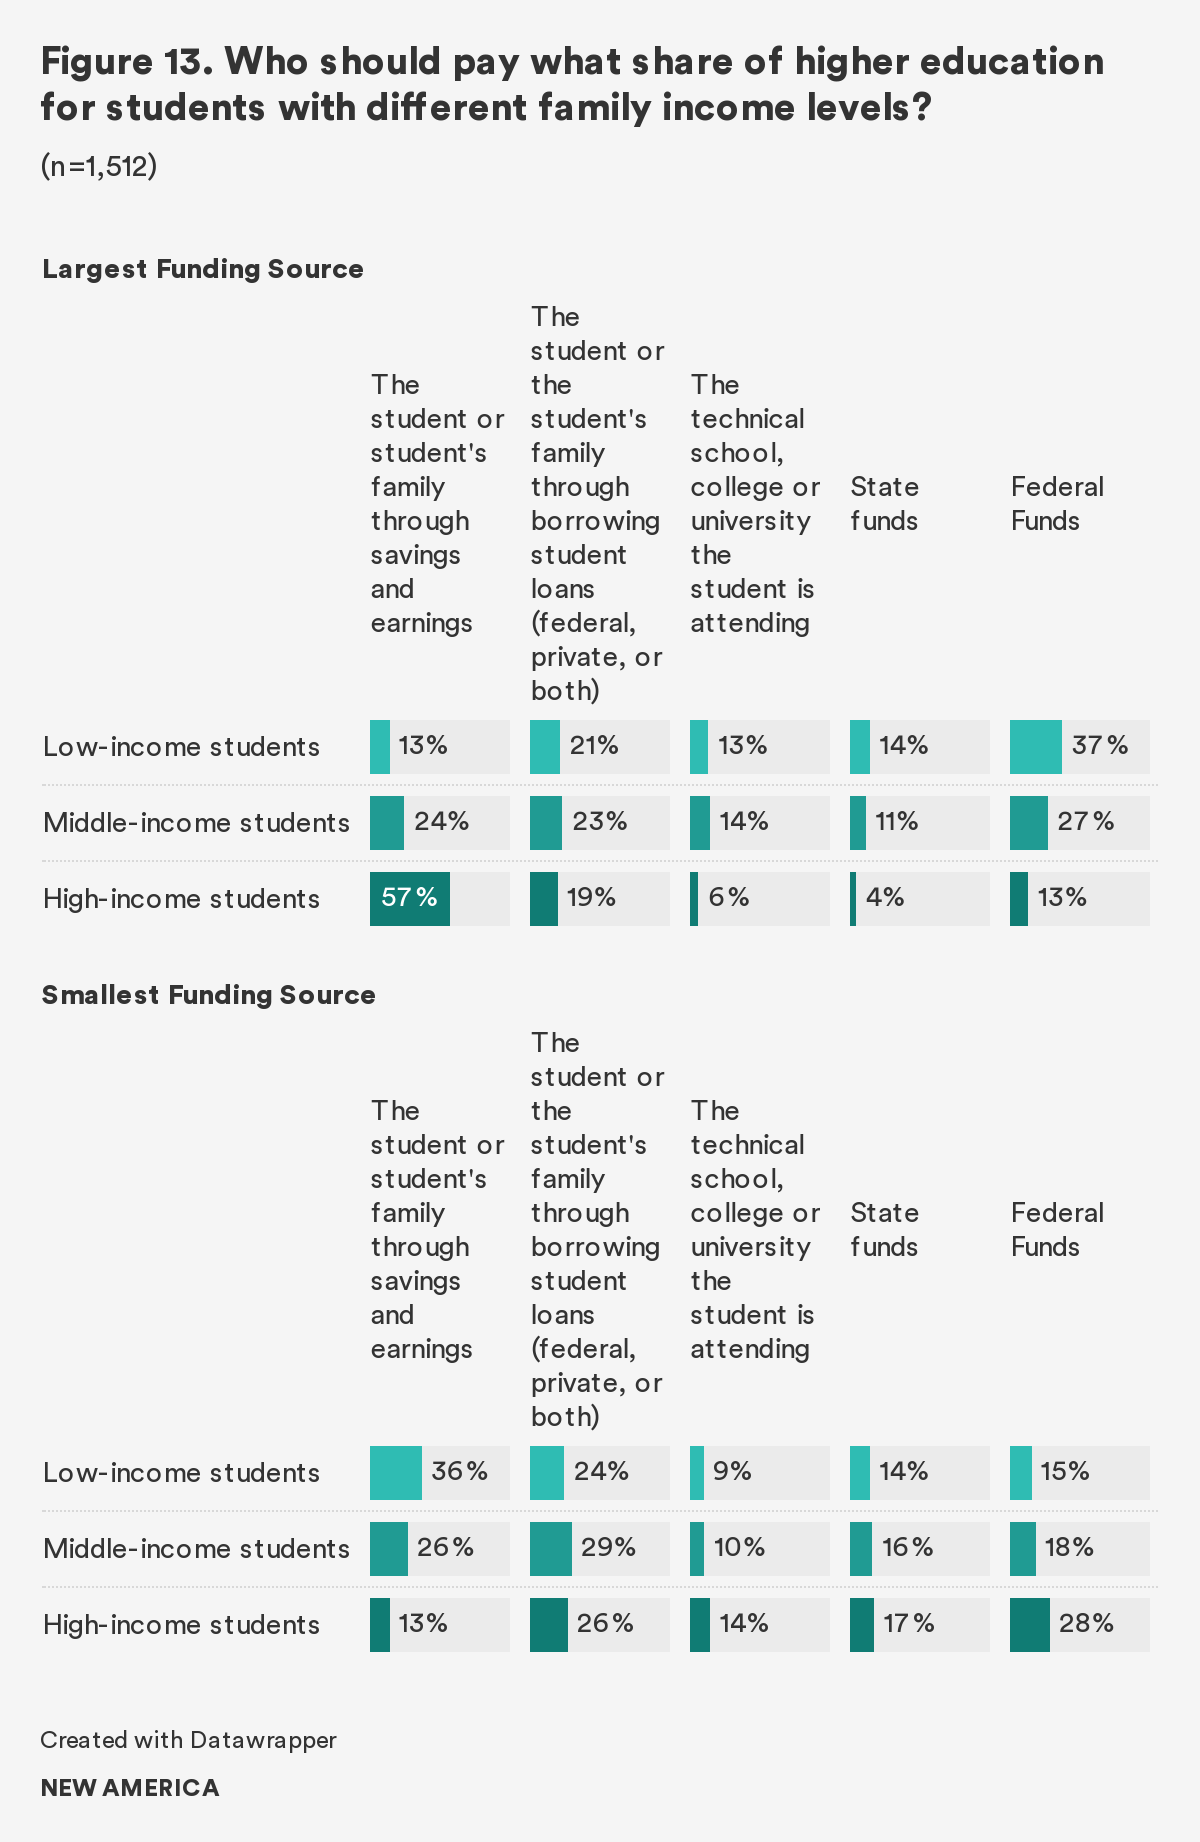
Americans are also divided about who should pay what share of college costs: the student or student’s family through savings and earnings, the student or the student’s family through borrowing loans, the school through institutional grants and scholarships, the state, or the federal government (Figure 13). A plurality of Americans (37 percent) believe the largest source of funding for low-income students—those with family incomes less than $45,000—should be federal funds, and the smallest should be the student or the student’s family through savings (36 percent) or loans (24 percent).
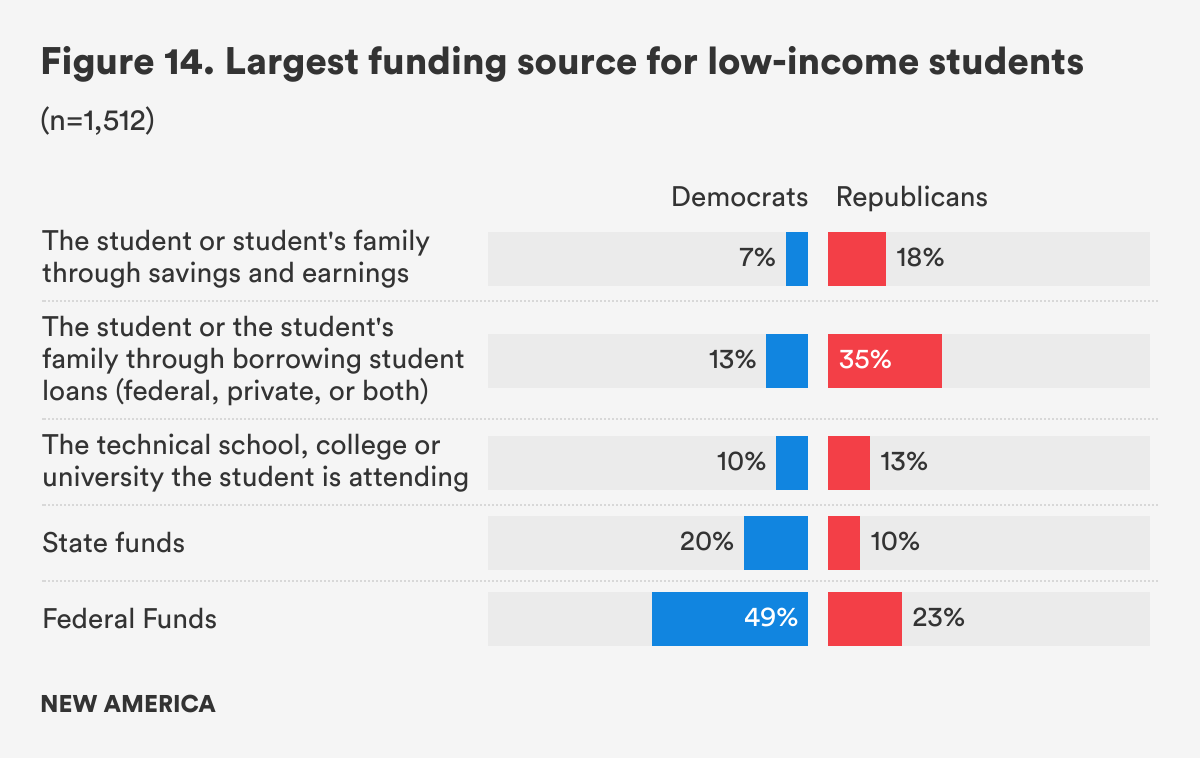
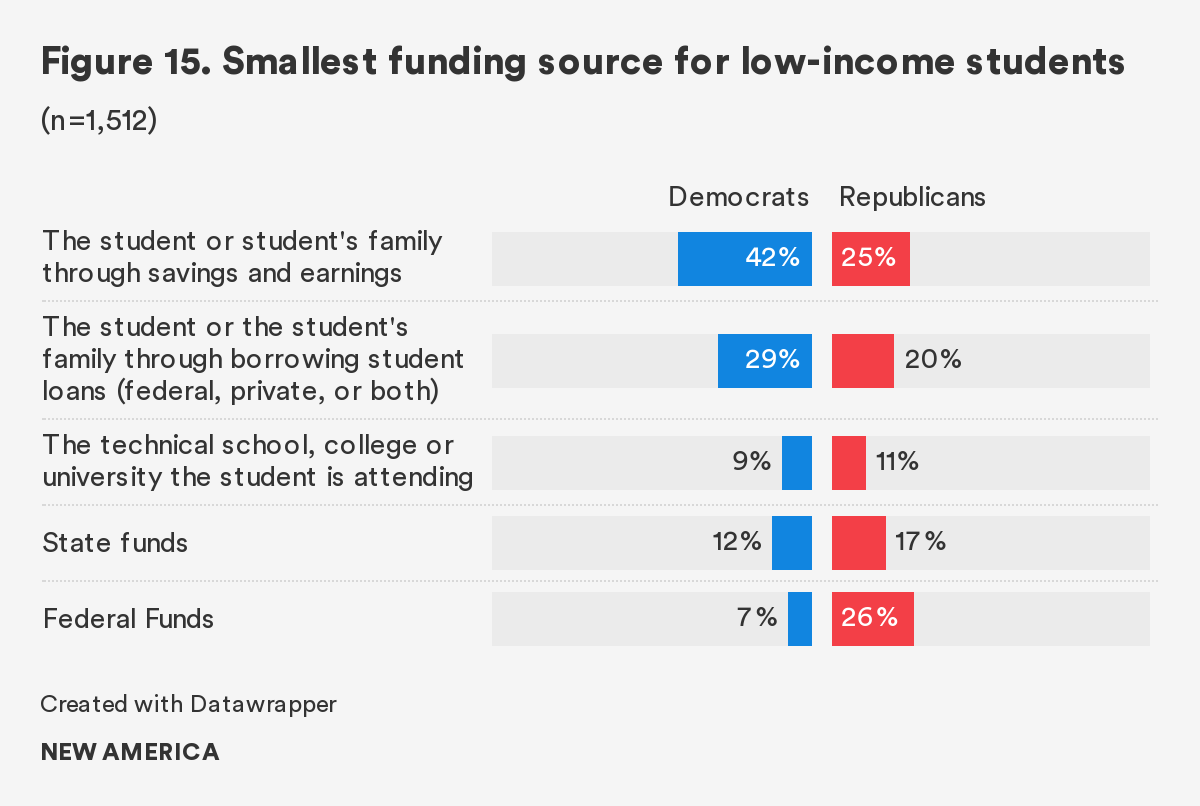
For Democrats, nearly half (49 percent) believe the largest source for low-income students should be from federal funds, whereas a plurality of Republicans (35 percent) believe the largest source should be students and families through borrowing loans (Figure 14). A plurality of Democrats (42 percent) believe the smallest source of funding should be the family through savings and earnings, whereas Republicans are split believing the smallest source should be federal funds (26 percent) and the students family through savings and earnings (25 percent) (Figure 15).
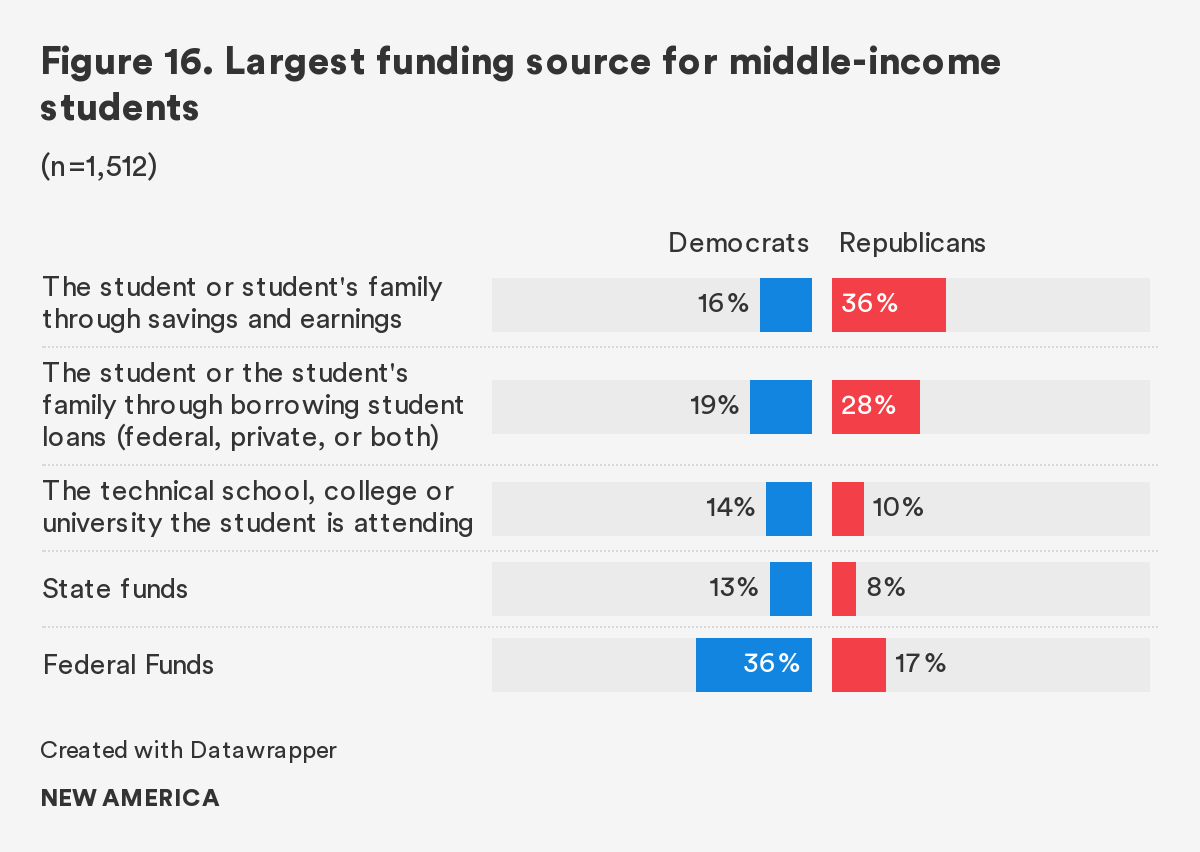
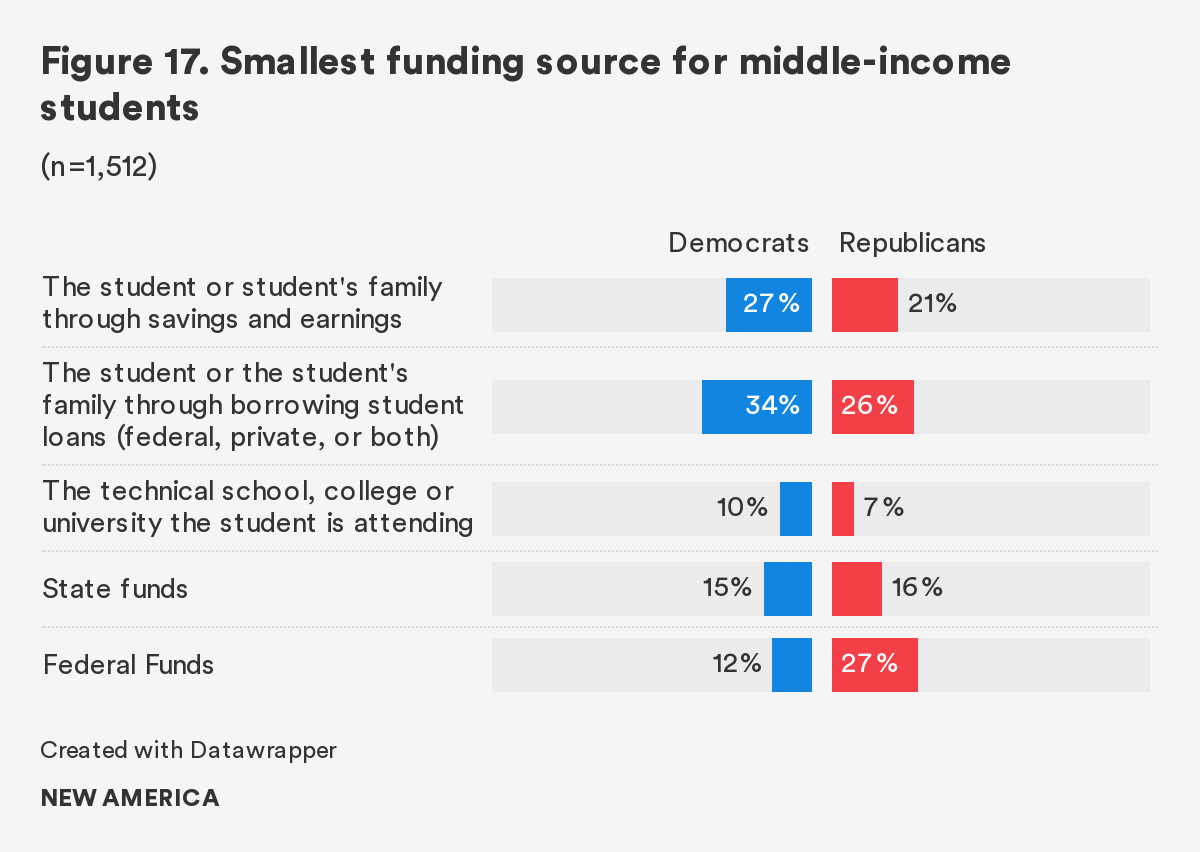
Americans are less certain about who should fund middle-income students—those with family incomes of $45,000 to $135,000—splitting their responses evenly among many of the options. A small plurality of Americans (27 percent) believe the largest source of funding for middle-income students should be federal funds, followed by the student and the student’s family through savings (24 percent) and loans (23 percent). A small plurality (29 percent) believe the smallest source should be student loans, followed by the student and his or her family through earnings (26 percent).
The partisan divide among Americans is particularly strong over the question of who should fund middle-income students, with 36 percent of Democrats thinking the government should be the primary funder, and Republicans believing it should be the student and his or her family through earnings and savings (36 percent) (Figure 16). Democrats believe that loans should be the smallest source of funding for middle-income families (34 percent). For Republicans, a plurality believes that both federal funds (27 percent) and loans (26 percent) should be the smallest source (Figure 17).
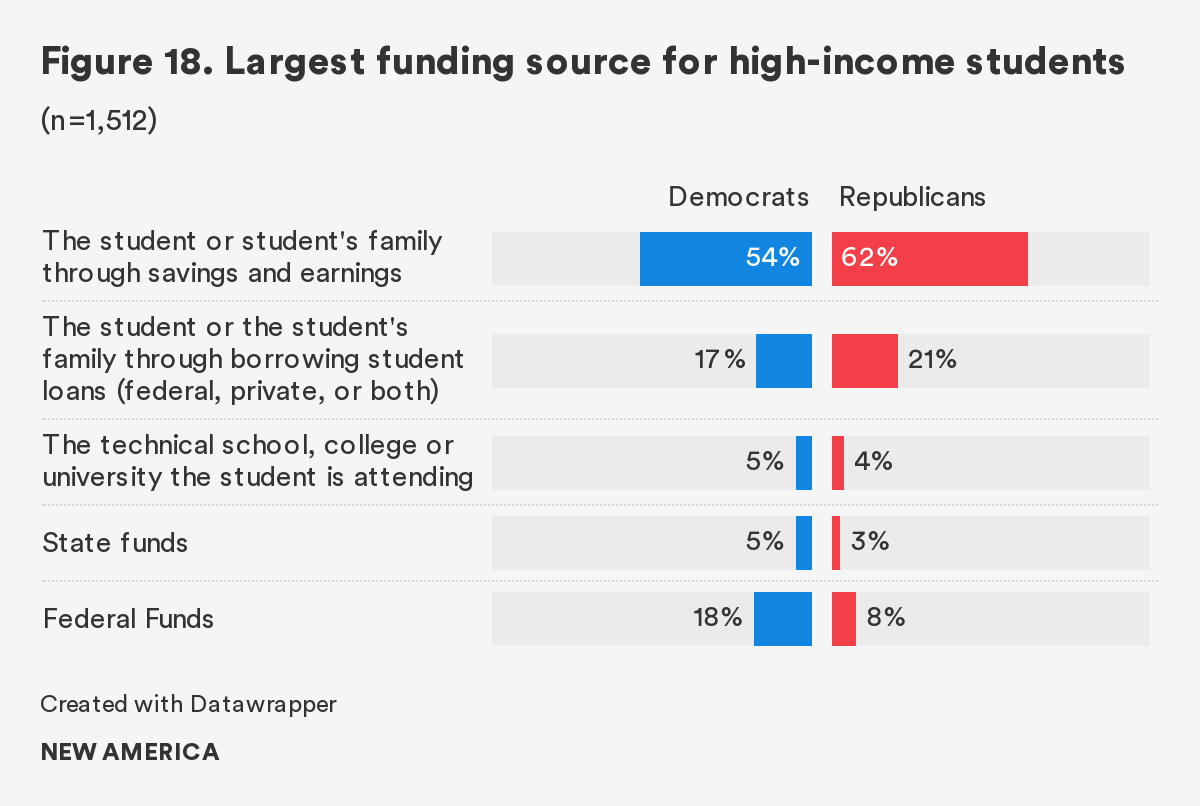
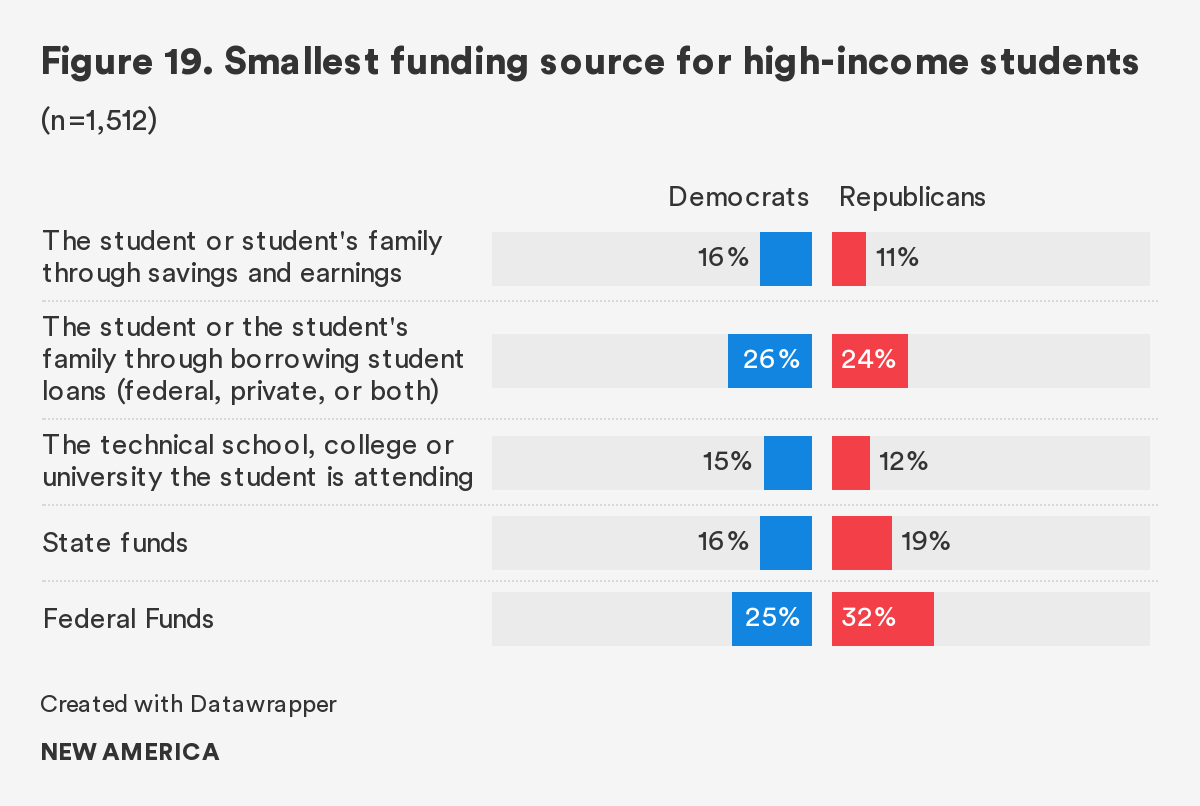
A majority of Americans (57 percent) believe that high-income students—those with family incomes over $135,000—should use savings and earnings to pay for college. They are split, however, as to whether the smallest source of funding should come from federal funds (28 percent) or loans (26 percent).
Both Democrats (54 percent) and Republicans (62 percent) agree that the primary source of funding for high-income students should be the student or the student’s family through savings and earnings (Figure 18). They are similarly split over whether the smallest source of funding should be federal funds (25 percent for Democrats and 32 percent for Republicans) or loans (26 percent and 24 percent, respectively) (Figure 19).
When it comes to borrowing, Varying Degrees added a question this year that asked about which types of programs merit taking out loans (Figure 20). In general, a majority of Americans believe that it is acceptable to take out a loans for just about any type of academic credential, whether a technical certificate, associate degree, bachelor’s degree, advanced degree, or professional degree. The percentage who agree that it is acceptable to borrow rises with each increasing level of education: 56 percent agree that it is acceptable to take out loans for a technical certificate, 61 percent for an associate degree, 79 percent for a bachelor’s degree, 81 percent for an advanced degree, and 85 percent for a professional degree.
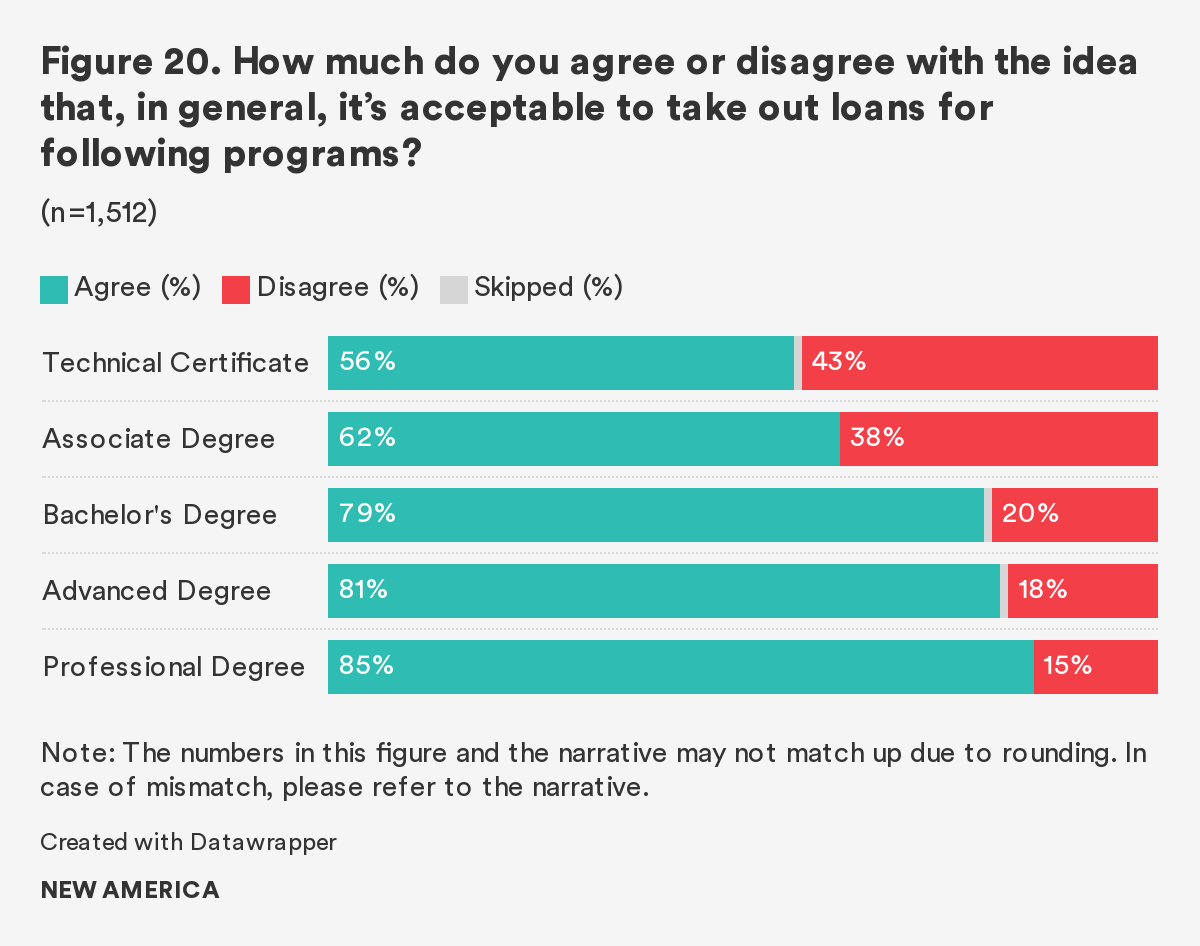
Republicans and Democrats generally agree that it is acceptable to borrow loans for various credentials. For Democrats, 55 percent agree it is acceptable to borrow loans for a technical certificate, 62 percent for an associate degree, 78 percent for a bachelor’s degree, 80 percent for an advanced degree, and 84 percent for a professional degree. For Republicans, 63 percent agree it is acceptable to borrow loans for a technical certificate, 67 percent agree for an associate degree, 84 percent agree for a bachelor’s degree, 85 percent for an advanced degree, and 88 percent for a professional degree.
Accountability
Low graduation rates, high dropout rates, low earnings, high student loan default rates: these are among the signs of a school that is not delivering value. Policymakers and students can use these indicators to measure the quality of higher education institutions; this rationale guides the Department of Education’s College Scorecard,11 which compiles key indicators into a tool for students to help them compare schools. College and university data can inform the decisions of prospective students and serve as a warning for when schools begin to take a turn for the worse.
The vast majority of Americans (90 percent) believe that publicly available data on key indicators of quality are important. While there is general bipartisan support for this belief last year, there is a slight shift from last year’s findings. This year, Varying Degrees finds that 84 percent of Republicans and 93 percent of Democrats agree that these data are important. In 2019, 90 percent of Republicans believed so, compared with 94 percent of Democrats.
Many of those polled also believe that federal and state financial support for colleges and universities should be tied to some of these outcomes (Figure 21). Americans agree that a school should lose taxpayers’ money if it has low graduation rates (78 percent); low rates of graduates earning a living wage (74 percent); or high rates of graduates earning less than the average high school graduate (72 percent).
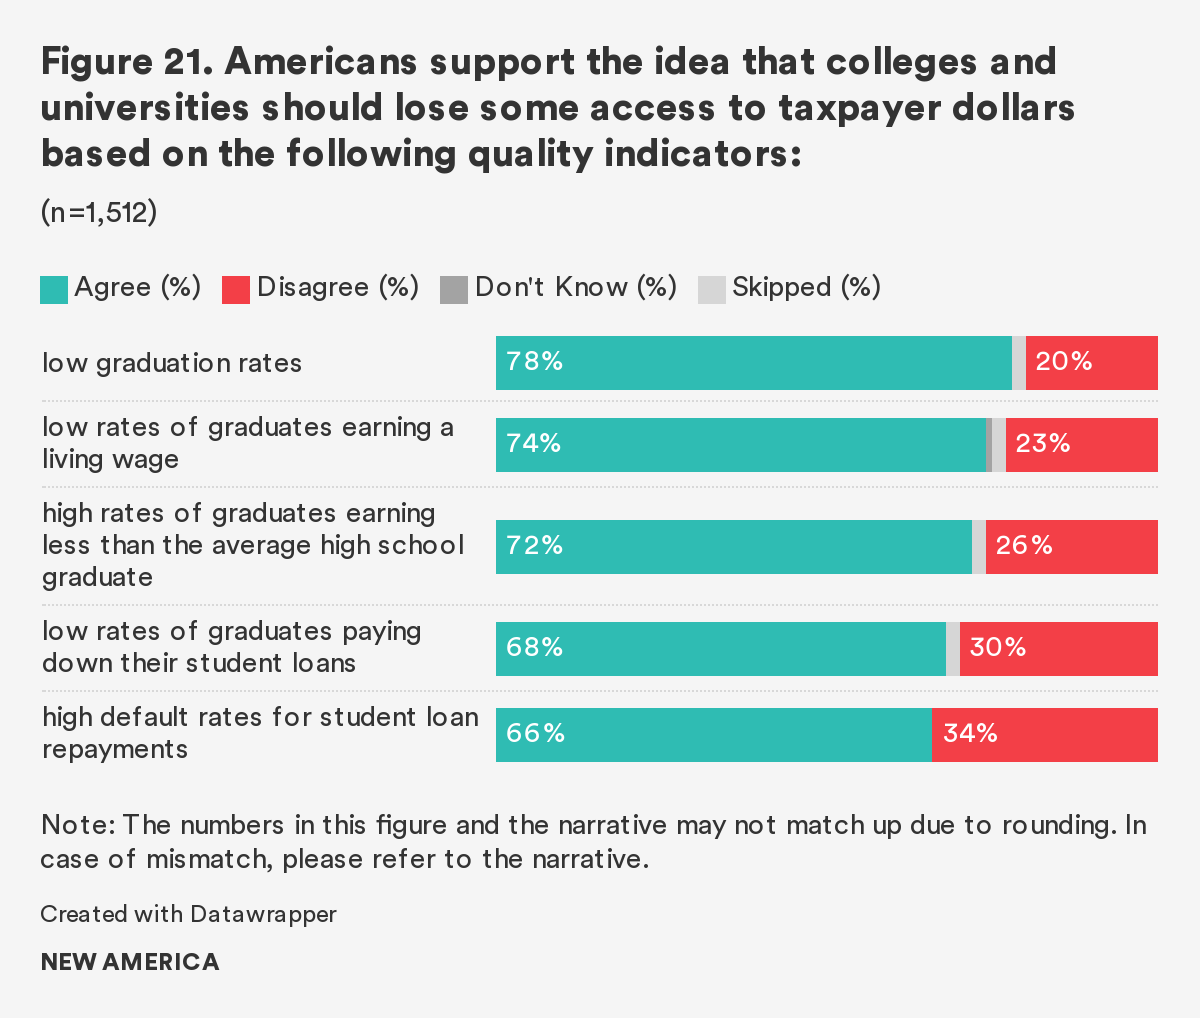
Slightly fewer (but still a majority of) Americans also agree that low rates of graduates paying down their student loans (68 percent) and high default rates on student loans (64 percent) also justify restricting access to taxpayers’ money.
These results could indicate that Americans are less concerned about student loan repayment outcomes as an indicator of quality and more focused on the value of the degree or certificate after graduating. These findings are generally consistent across political parties. When it comes to student loan default rates: 71 percent of Republicans support cutting off access to taxpayer dollars if a college or university has high default rates, while a smaller percentage (63 percent) of Democrats agree.
Accreditation
This year Varying Degrees posed a new set of questions concerning accreditation. These questions give insight into public perception of accreditation and its value as a tool to hold schools accountable.
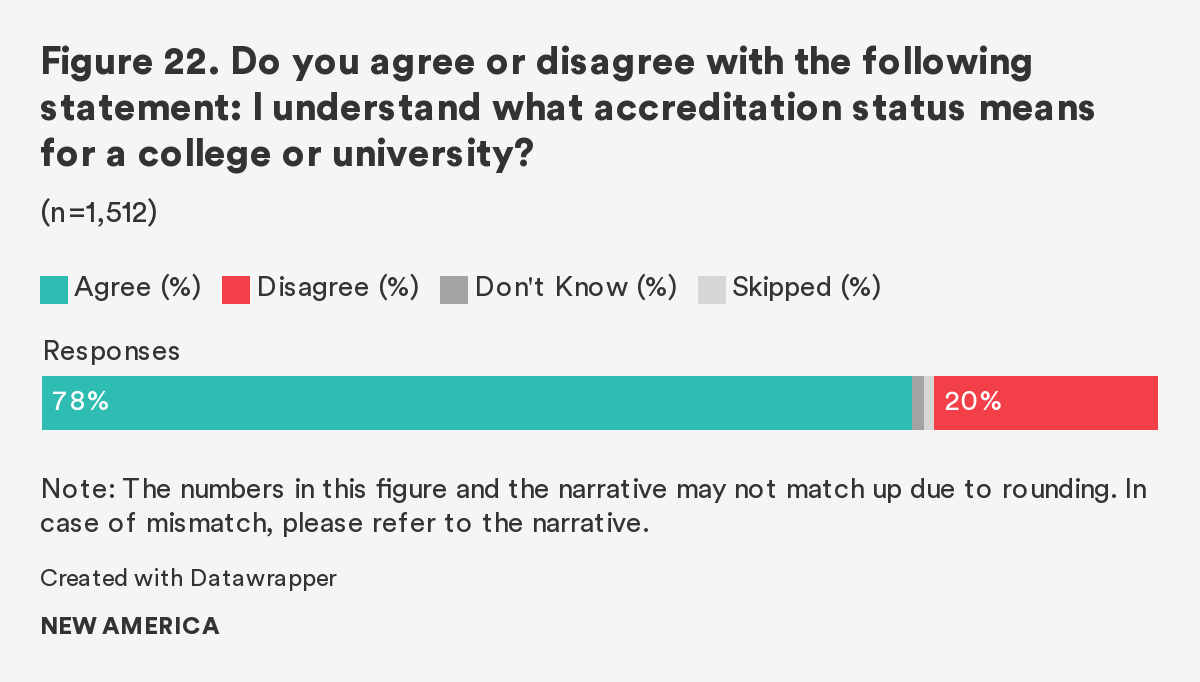
However, it is clear that Americans do not fully understand how accreditation works in practice: nearly four out of five (78 percent) respondents believe that they understand what accreditation status means for a college or university (Figure 22), but more than 70 percent of Americans misidentified the statement from Varying Degrees about accreditation below as true (Figure 23).
One of the aspects of accreditation is that if a school is accredited, the accreditor verifies the school provides good student outcomes. Examples of good student outcomes include: high graduation rates, low default rates for student loan repayments, high rates of graduates paying down their debt, and high rates of graduates earning a living wage.
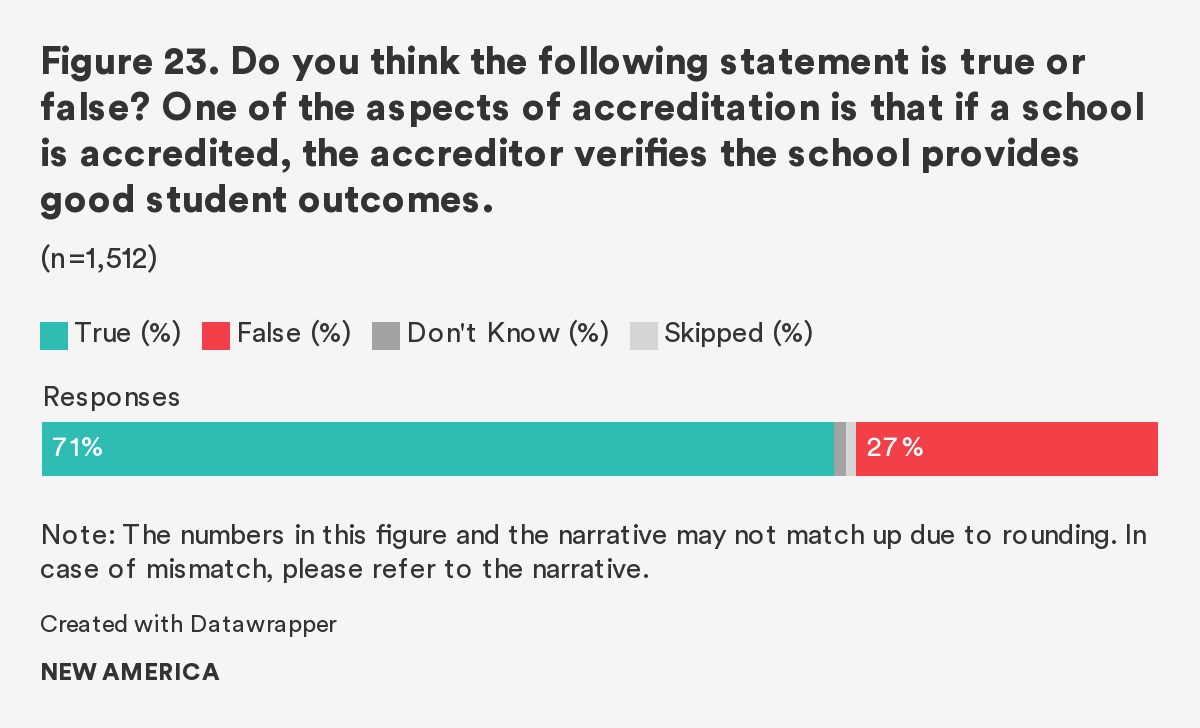
While it is true that all accrediting agencies are required to establish standards for accreditation based on student achievement,12 many of the regional accreditors that mostly approve public and nonprofit colleges do not have a standard definition of student achievement; they do not assess or hold institutions accountable for student outcomes like graduates’ wages or default rates for student loan repayments. While they may consider institutions’ graduation rates, regional accreditors almost never condition their approval of colleges on meeting a graduation rate benchmark.
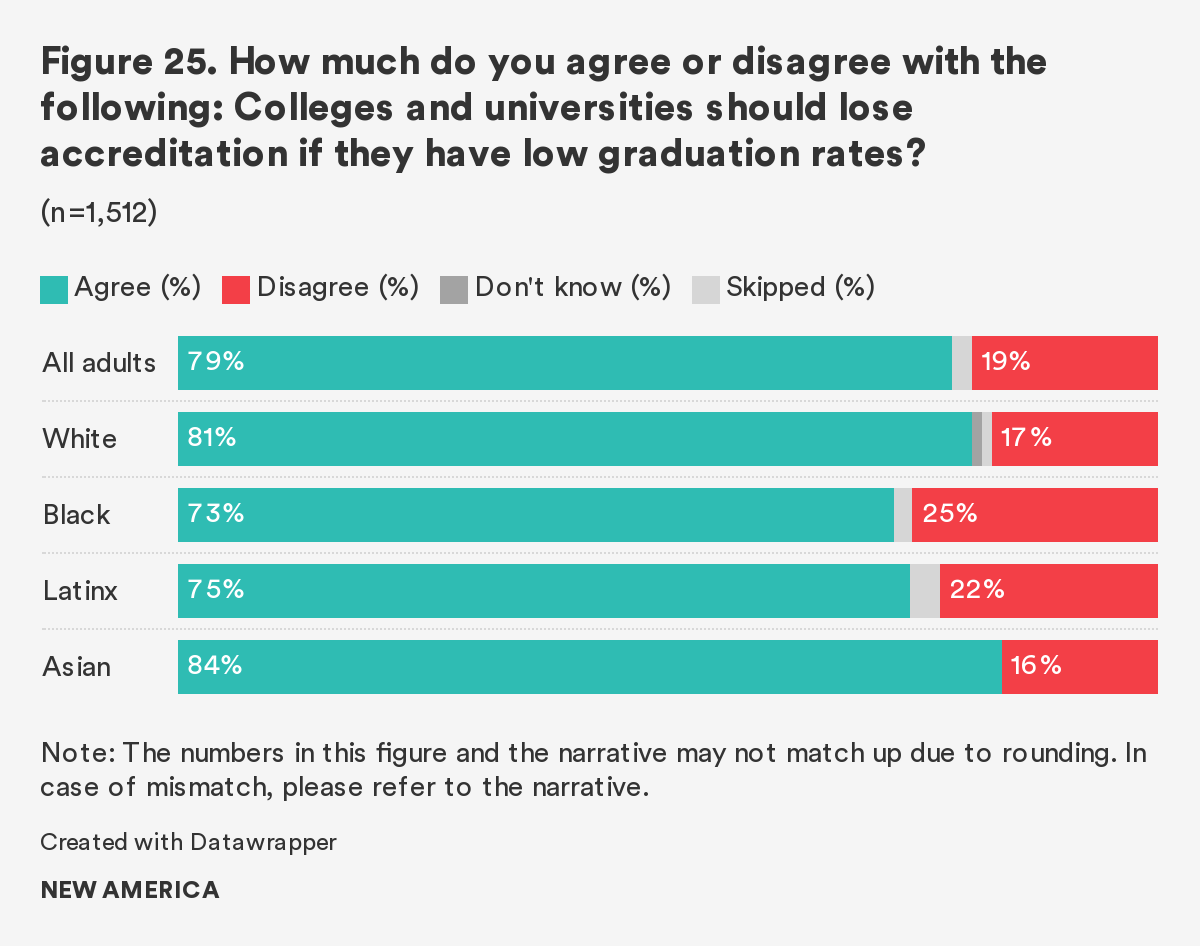
In general, most Americans support tying accreditation status to key indicators of quality (Figure 24). The highest number of respondents (79 percent) agree that colleges and universities should lose accreditation if they have low graduation rates. However, agreement with this statement varies somewhat among racial groups: 81 percent of white respondents agree that low graduation rates merit a loss of accreditation, compared with 73 percent of Black and 74 percent of Latinx respondents (Figure 25).
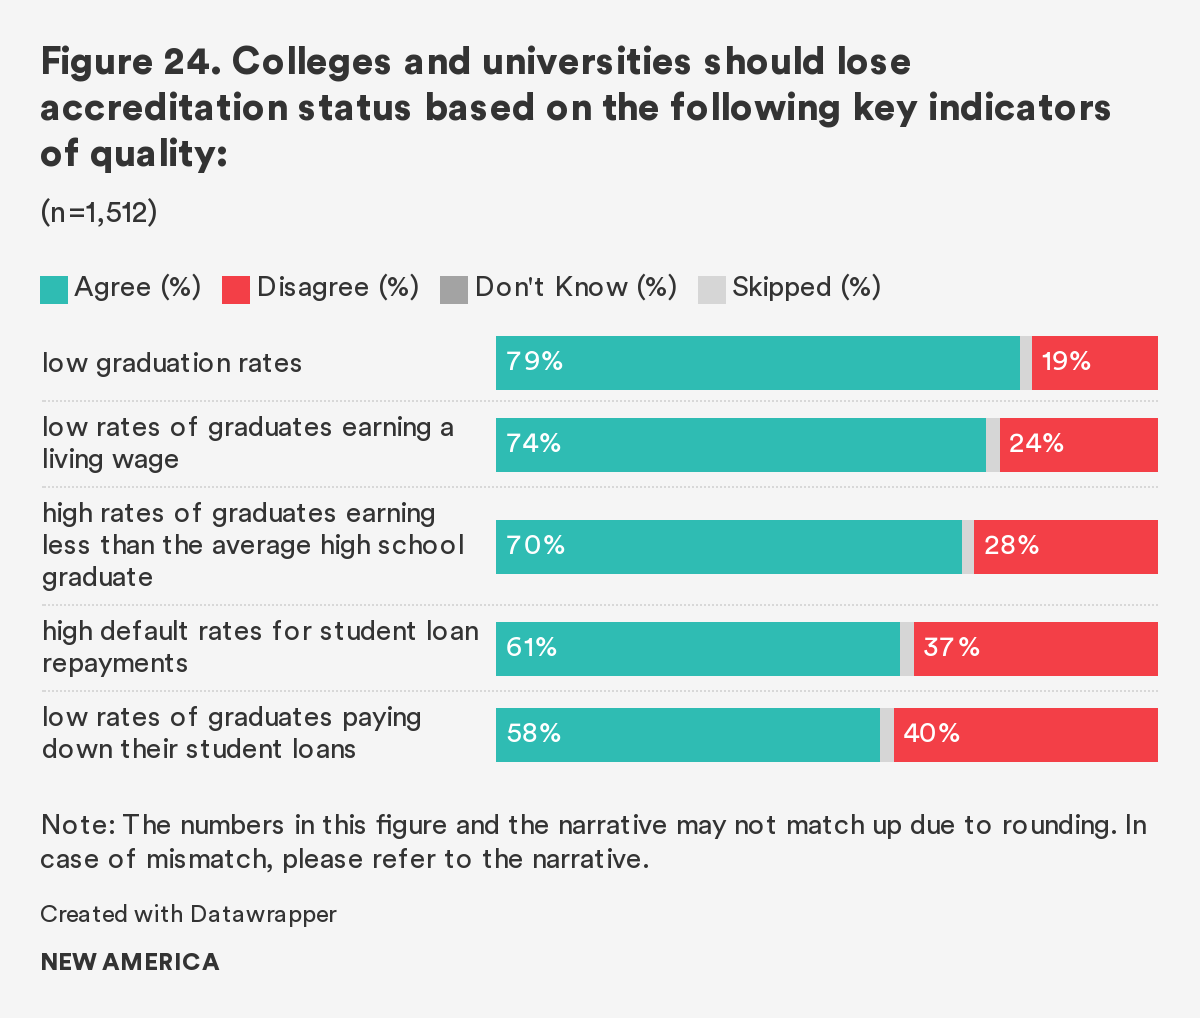
Nearly three-quarters (74 percent) of Americans think that colleges should lose accreditation if an insufficient share of their graduates earn a living wage. This is a belief that crosses the political aisle: 77 percent of Democrats and 72 percent of Republicans agree,
While a majority still agreed, there is less support for stripping colleges of their accreditation based on the struggles their former students have repaying loans. Only 61 percent of Americans think that high default rates on student loans are a reason for colleges and universities to lose accreditation. Similarly, only 58 percent of respondents agree that colleges and universities should lose their accreditation if they have low rates of graduates paying down their student debt. Responses to this question varied among age groups: 63 percent of Baby Boomers agreed that this was a sign that schools should lose accreditation, compared with 52 percent of Millennials.
While it is important to hold higher education institutions to account through metrics like key indicators of quality and accreditation status, Americans are also deeply concerned about college costs, and therefore the efficiency and fiscal responsibility of an institution. How well are schools spending money and how efficient are they? Headlines in the media scrutinize college and university management, placing institutions and their practices in the public eye; Varying Degrees posed questions to gauge respondents’ feelings about money management and efficiency in different types of institutions.
Public community colleges found the most favor (Figure 26). About three in five Americans (62 percent) say that public community colleges run efficiently. While this figure is the same as last year, responses vary among racial groups. When asked if they believe public community colleges run efficiently, 71 percent of Black respondents say that these institutions are efficient, while only 59 percent of white respondents agree.
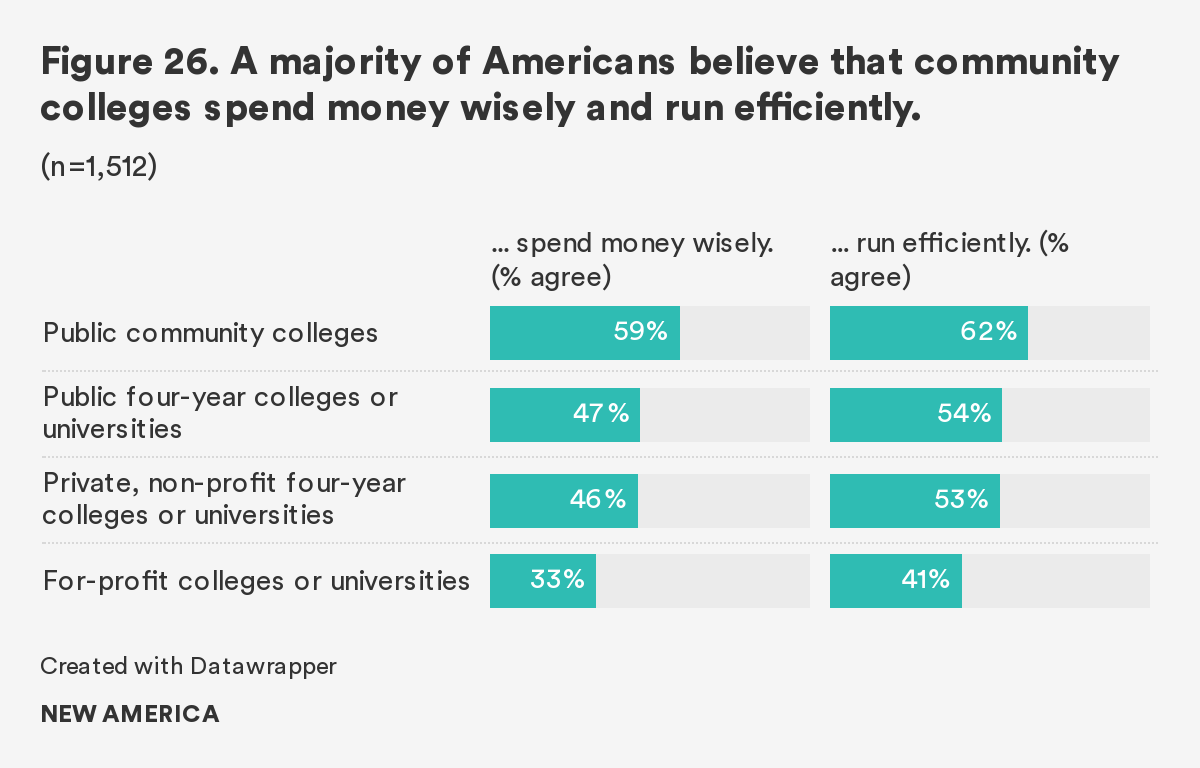
In general, 59 percent of Americans agree that public community colleges spend money wisely; this is slightly lower than the 62 percent of respondents who agreed last year. Democrats and Republicans are divided on this matter: 65 percent of Democrats believe that public community colleges spend money wisely, compared to 56 percent of Republicans.
Slightly less than half of Americans (47 percent) agree that public four-year colleges and universities spend their money wisely. There is a difference among party identification; 57 percent of Democrats agree that these institutions spend money wisely, while 47 percent of Republicans say the same. Racial groups are also divided on the matter: 56 percent of Black respondents agree that public four-year colleges and universities are wise with money, compared with 43 percent of white respondents.
A similar share of people believes private, nonprofit four-year colleges and universities spend money wisely as believed that of public four-year schools. Slightly less than half of Americans (46 percent) agree that private, nonprofit four-year colleges and universities spend money wisely. Half of both Republicans and Democrats agree that these institutions spend money wisely.
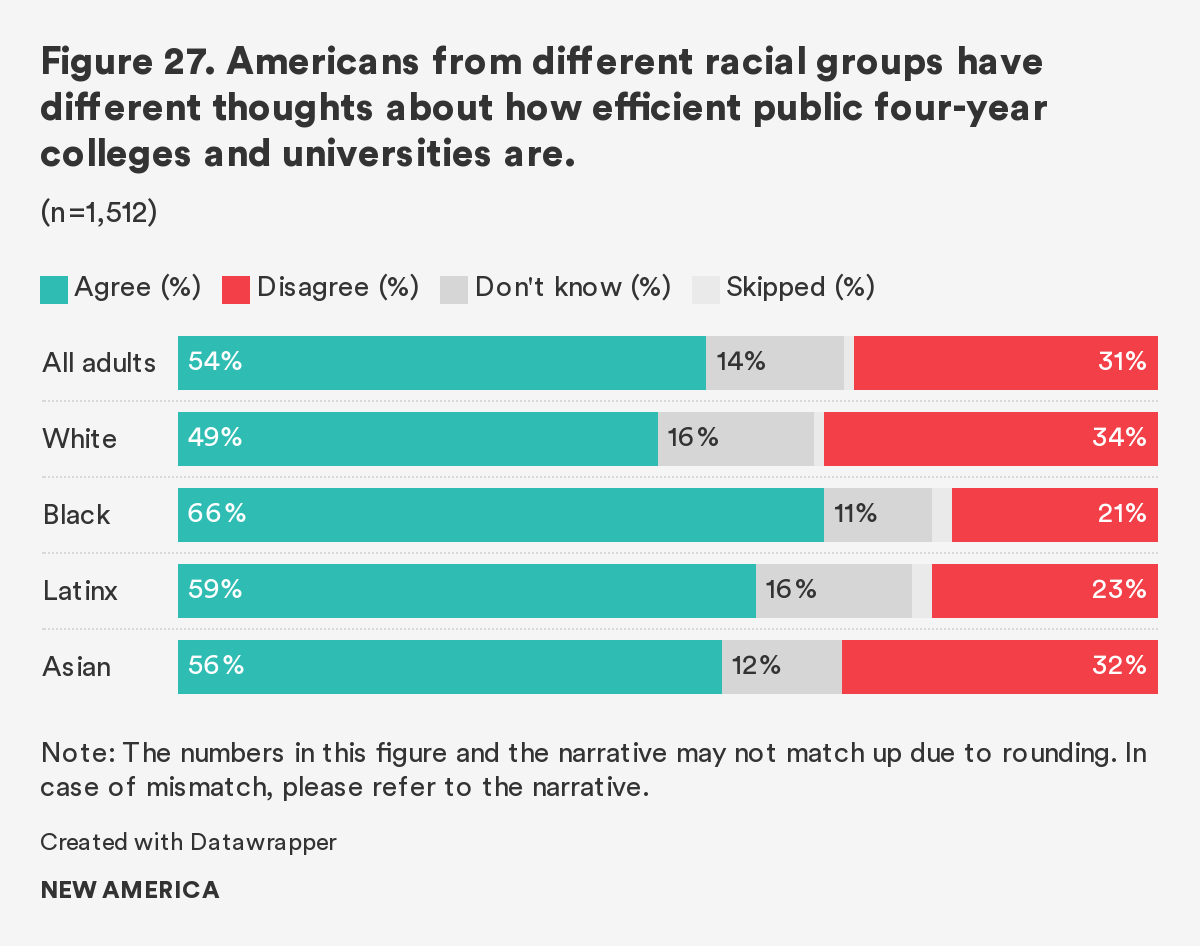
The public has a more positive outlook on public four-year colleges’ and universities’ efficiency, as 54 percent of Americans believe that these institutions run efficiently. The data reveal a significant partisan divide: 66 percent of Democrats agree that public four-year colleges and universities run efficiently, compared with 51 percent of Republicans. There was also a significant difference among racial groups: 66 percent of Black and 59 percent of Latinx respondents agreed that these institutions run efficiently, compared with 49 percent of white respondents (Figure 27).
Slightly more than half (53 percent) of Americans say that private, nonprofit four-year colleges and universities run efficiently. Racial groups agree with this belief to different degrees: 59 percent of Black, 59 percent of Latinx, and 58 percent of Asian respondents believe that these institutions run efficiently, compared to 49 percent of white respondents who say the same.
The general public holds less esteem towards for-profit colleges and universities. Unlike the other types of colleges and universities, a majority of Americans do not view for-profit colleges and universities’ as efficient; only 41 percent of respondents agree that these institutions run efficiently, a figure which is six points lower than that for last year. These sentiments about for-profit colleges and universities are bipartisan: roughly the same percentage of Democrats (41 percent) and Republicans (44 percent) agree that these institutions run efficiently. There is some disagreement with this statement among racial groups: 57 percent of Black respondents and 49 percent of Latinx respondents agreed that for-profit colleges run efficiently, which are both significantly higher than the 36 percent of white respondents who say the same (Figure 28).
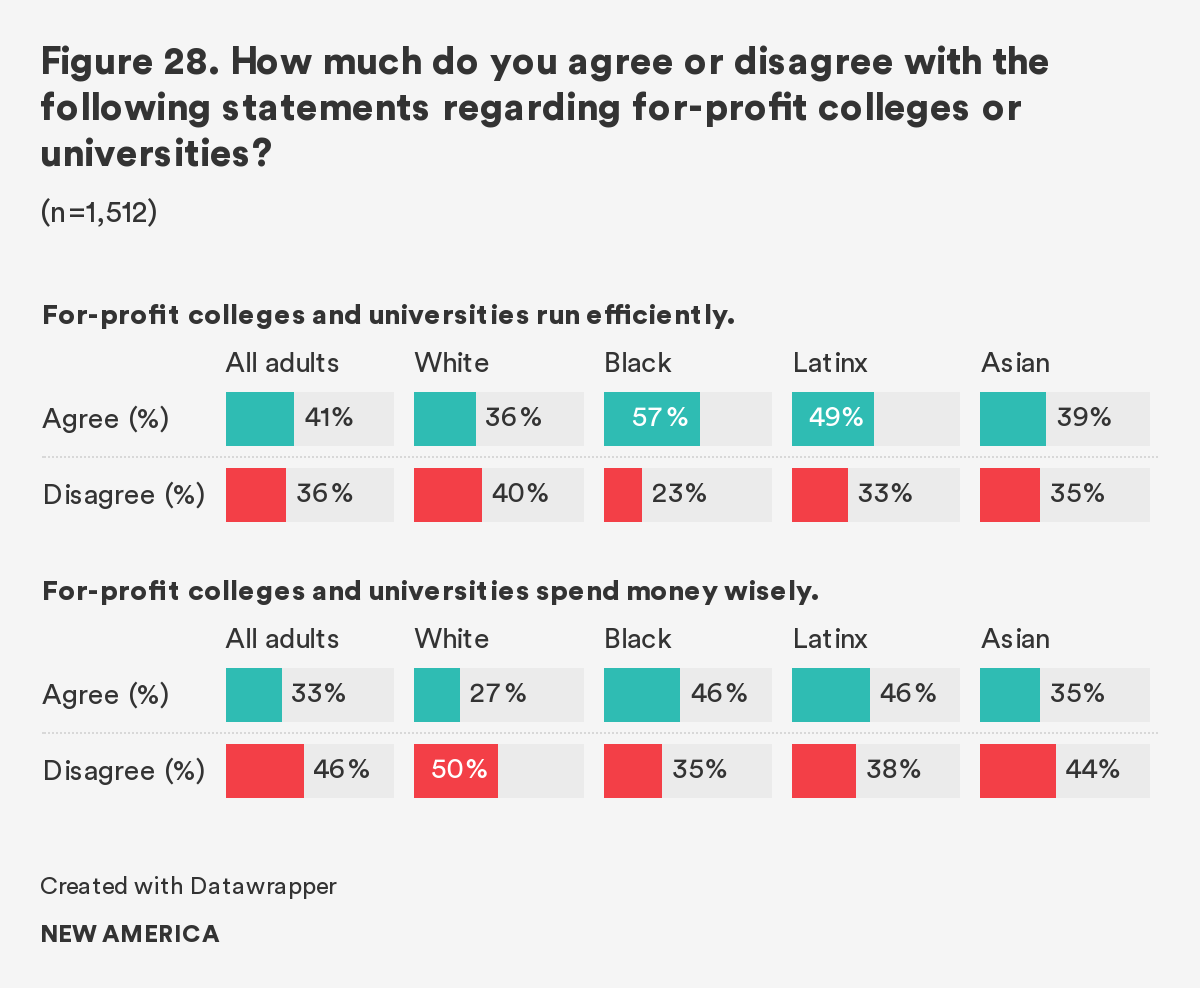
Even fewer Americans believe that for-profit colleges and universities spend their money wisely. Only one-third (33 percent) of respondents said that these institutions are wise with money. This figure is also six points lower than last year’s findings and similar among political parties; 36 percent of Democrats and 34 percent of Republicans agree that these institutions spend their money wisely. Given that Republican lawmakers routinely support13 for-profit colleges and their practices, this is somewhat surprising. Racial groups are divided on the issue; 27 percent of white respondents believe that for-profit colleges and universities are wise with money, compared with 46 percent of Black respondents and 46 percent of Latinx respondents.
It is clear that a larger portion of Americans believe that public community colleges run more efficiently and are wiser with money than both public and private nonprofit four-year colleges and universities, and especially than for-profit colleges and universities.
Citations
- In Varying Degrees, education beyond high school includes any formal education and/or training, including apprenticeships, technical education, vocational education, and coursework applicable to an associate, bachelor’s, or advanced degree.
- Anthony P. Carnevale, Stephen J. Rose, and Ban Cheah, The College Payoff: Education, Occupations and Lifetime Earnings (Washington, DC: Georgetown University Center on Education and the Workforce, 2011), source
- Philip Trostel, It’s Not Just the Money: The Benefits of College Education to Individuals and to Society (Indianapolis, IN: Lumina Foundation, 2015), source
- In Varying Degrees, Generation Z includes those who were born in and before 1995, Millennials include people who were born between 1980 and 1994, Generation X includes people who were born between 1965 and 1979, Baby Boomers include people who were born between 1946 and 1964, and the Silent Generation includes those who were born in and before 1945.
- National Center for Education Statistics (website), The National Postsecondary Student Aid Study 2016 (NPSAS:2016), source
- National Center for Education Statistics (website), The National Postsecondary Student Aid Study 1996-2016 (NPSAS:1996-2016), source
- Robert Shireman, “The For-Profit College Story: Scandal, Regulate, Forget, Repeat,” The Century Foundation (website), January 24, 2017, source
- “Pew Research Center, July 2019 Political Survey, Final Topline,” Pew Research Center, source
- Kim Parker, “The Growing Partisan Divide in Views of Higher Education,” Pew Research Center, August 19, 2019, source
- This was a forced-choice question: it only offered these two response options, forcing respondents to choose which one most aligned with them.
- College Scorecard (website), source
- Antoinette Flores, “How College Accreditors Miss the Mark on Student Outcomes”, Center for American Progress, source
- Stephen Burd, “How the G.O.P. Became For-Profit College Abuse Deniers,” EdCentral (blog), New America, January 16, 2017, source
Conclusion
Discussions and perceptions of value, funding, and accountability are more relevant than ever as we venture into uncharted territory with a pandemic-caused global economic crisis. COVID-19 has presented an unprecedented challenge to colleges and universities, shifting the way that students learn and how institutions of higher education function. But it is more important than ever to ensure that there are viable, quality educational pathways for everyone, since even after the pandemic ends, the economic wounds are likely to remain for a long time. Understanding the value Americans place on education opportunities after high school and where funding should be prioritized so that students have broad access will be important moving forward. The Varying Degrees data will provide an important baseline with which to measure how attitudes change as we enter a changed world. Holding colleges and universities accountable for their practices and outcomes will be crucial for protecting students and their investments.
Perceptions vs. Reality
Since the inaugural Varying Degrees in 2017, we have looked at how Americans’ perceptions of higher education—about students, student debt, and institutions of higher education—compare to the reality. Understanding Americans' views tells us where we need to debunk myths about education after high school. This year’s questions are mostly similar to last year, focusing on three important topics: current undergraduates, student outcomes, and student loans. The results this year highlight the fact that Americans have reservations about graduation rates for those in undergraduate programs, and they overestimate the rate at which graduates are burdened by and struggling to repay student loan debt.
It is interesting to see that, even within the same survey, Americans can be optimistic about the value of higher education, and at the same time are not as cheerful when it comes to the outcomes for graduates. Only half of Americans think more than 50 percent of students in a bachelor’s degree program will graduate in four years. And even though most Americans still believe that those with only a bachelor’s degree earn more money than those without, a majority think that the median earning of these individuals is only within the $45,000 to $65,000 range. Cautious as their responses are, as it turns out, their perceptions are not too far from reality.
Meanwhile, media stories focused on students who are overburdened with loan debt have raised tremendous concern among Americans. Nearly half of Americans think that 50 to 80 percent of adults are carrying student loan debt, while according to the Federal Reserve Board’s 2018 Survey of Household Economics and Decisionmaking, only 16 percent of American adults have taken on debt for their own education.1 A majority of Americans mistakenly think that student loans are the largest source of consumer debt. At $1.5 trillion in total, the volume of student debt is considerably less than the $10 trillion sum that Americans owe on their mortgages and home equity loans.2 Unlike their perceptions on earnings and outcomes, Americans' estimates of student indebtedness are divorced from reality. Having said that, their responses underline their ongoing concerns about the ever-rising price of a college education and the increasing amount of debt that students are taking on to pay for it.
Americans’ perceptions mirror how higher education is affecting their lives. The section below will provide their responses in more detail. Showing the alignment or the gap between perceptions and reality is not to congratulate respondents on their knowledge of higher education issues, or to downplay their concerns, but to help us do better work communicating about higher education and developing policy solutions.
Perception
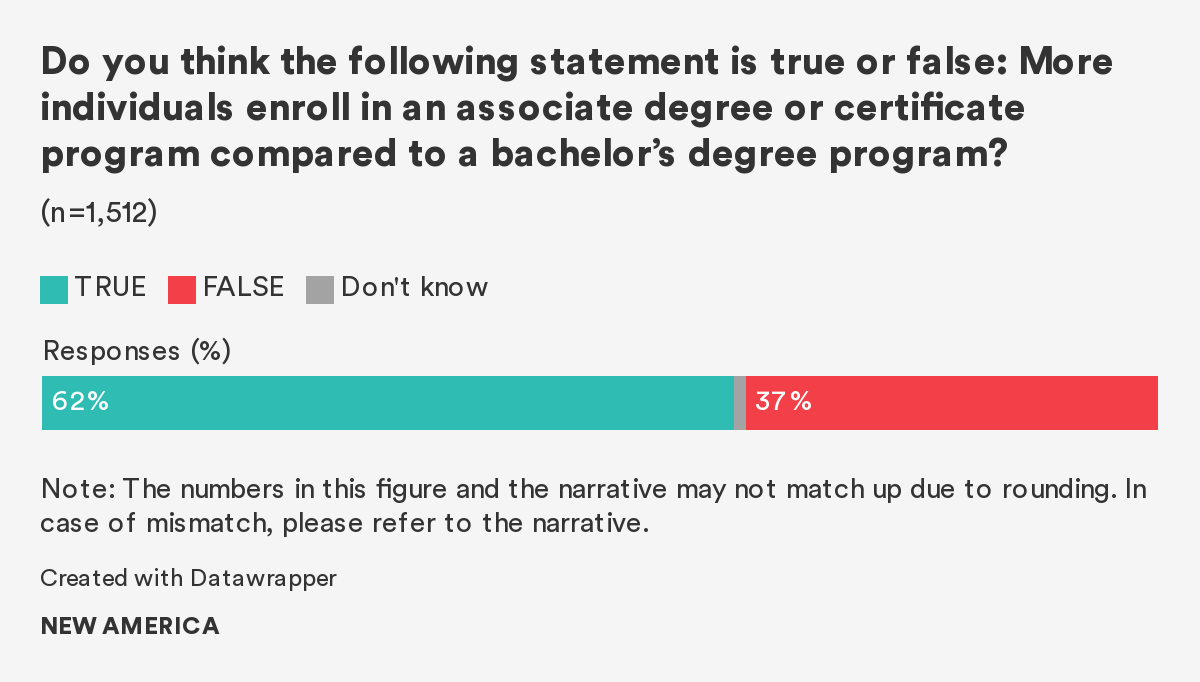
Sixty-two percent say that it is true that more individuals enroll in an associate or certificate program compared to a bachelor’s degree program.
Reality
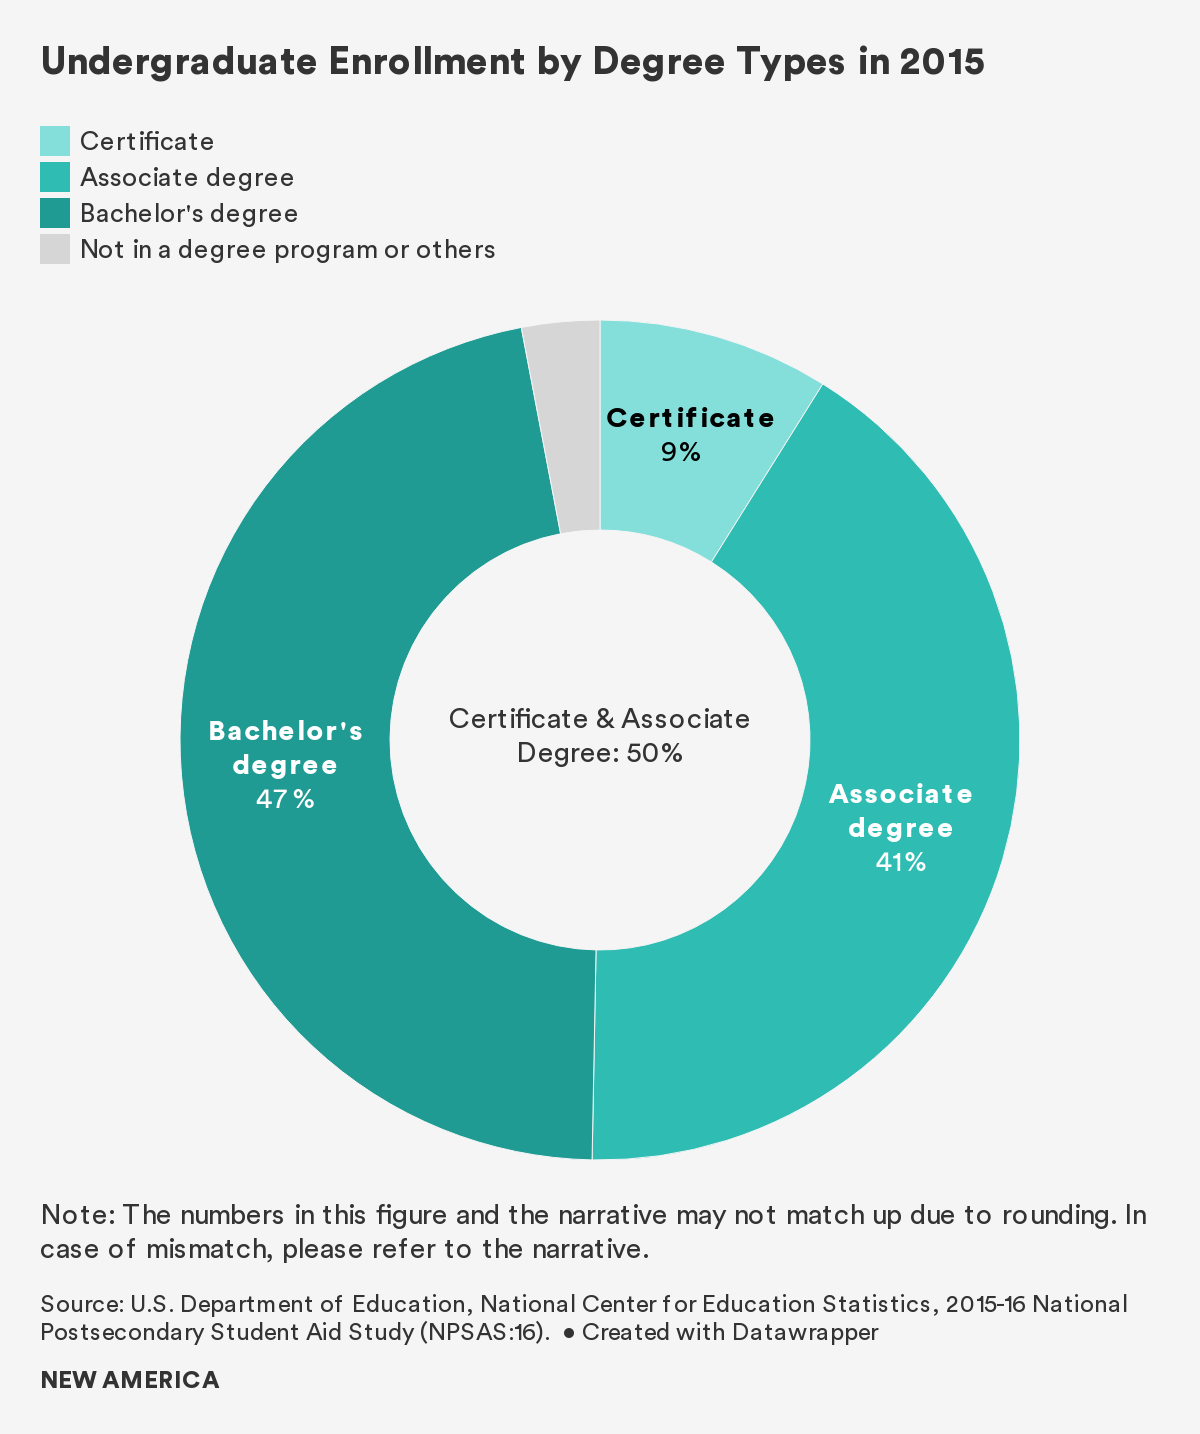
Americans are right. According to data from the National Postsecondary Student Aid Study, 50 percent of undergraduates were enrolled in either an associate or certificate program, while 47 percent were enrolled in a bachelor’s degree program in 2015.3
Perception
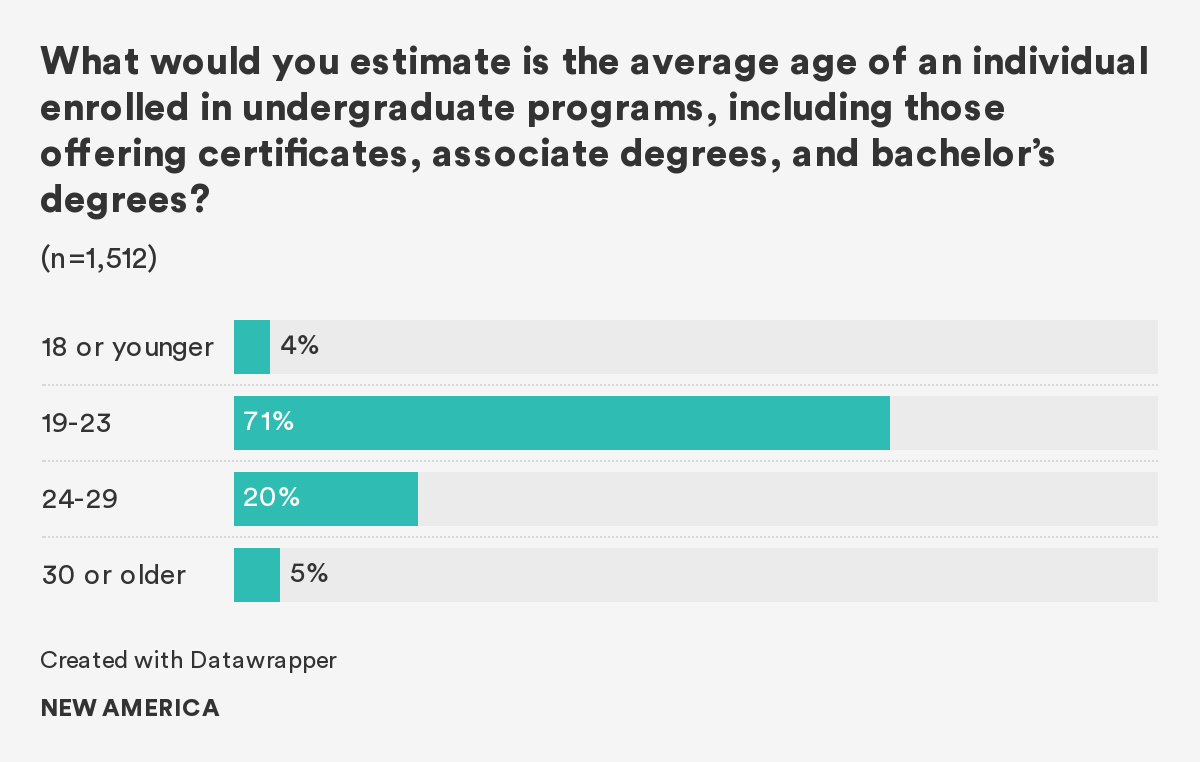
Most Americans think that an undergraduate student is 29 or younger; 71 percent think that the average age is between 19 and 23.
Reality
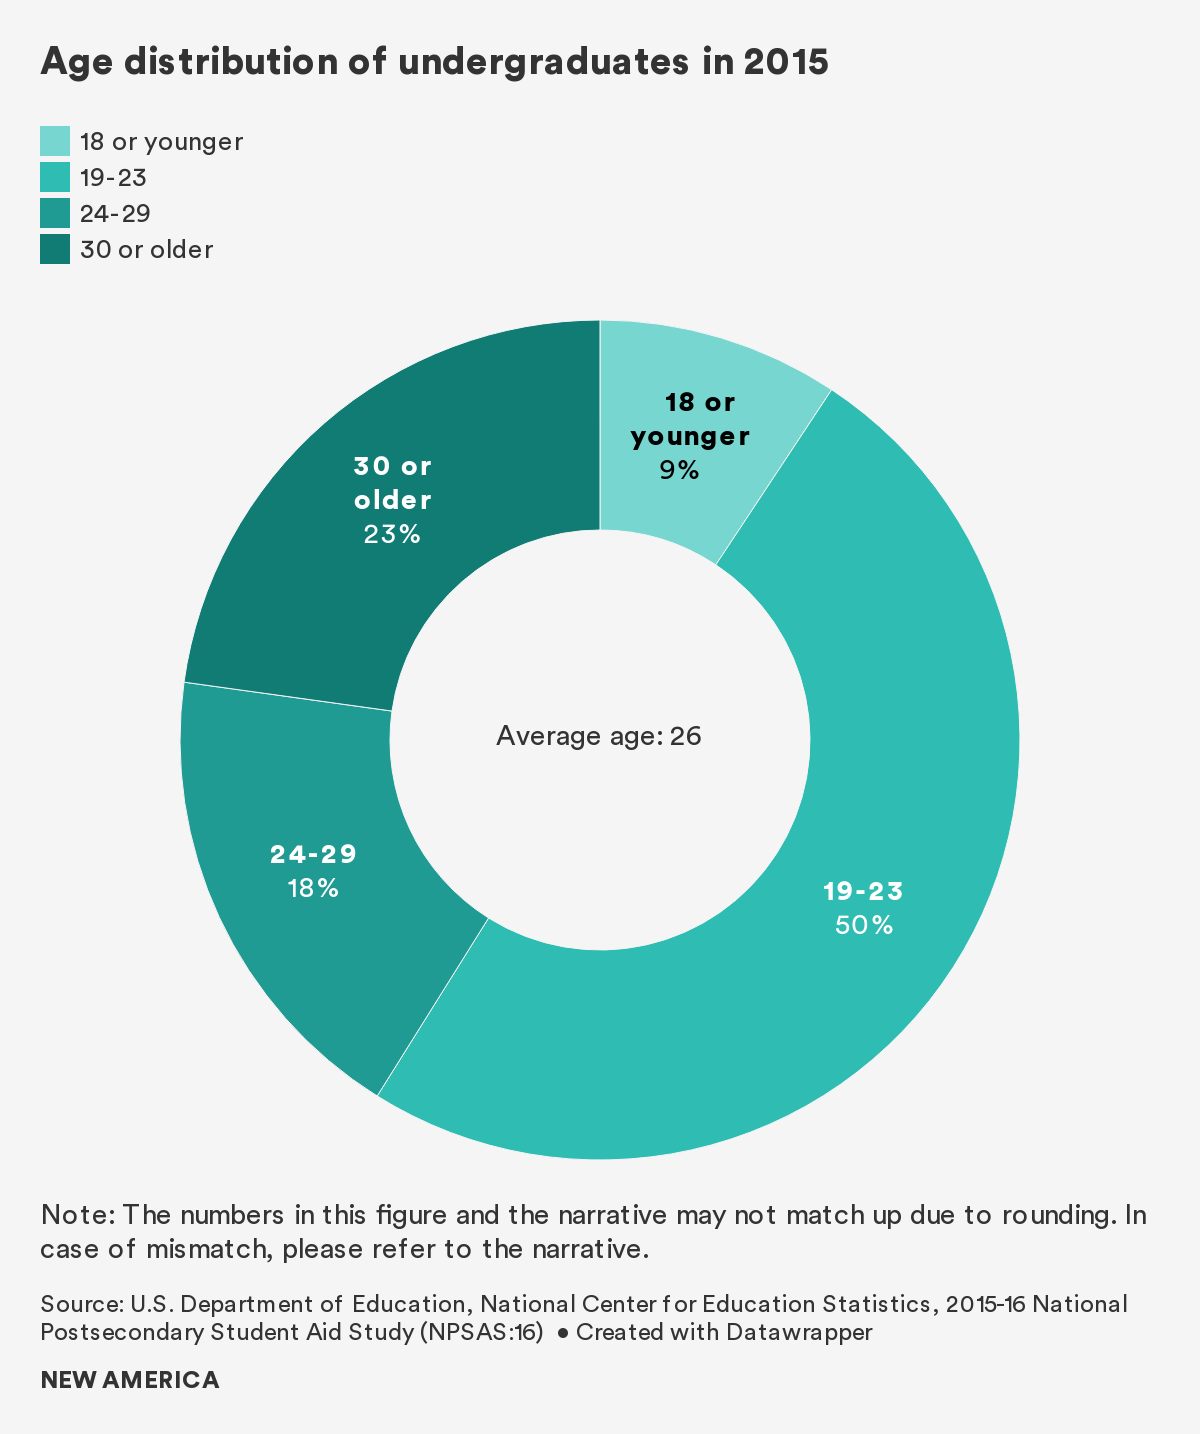
While most Americans picture a young student who directly enrolled in college after high school, the actual average age of an undergraduate in 2015 was 26. While a majority (59 percent) of undergraduates were still under the age of 24, a significant proportion of undergraduates—41 percent—were 24 or older.4
Student Outcomes
Perception
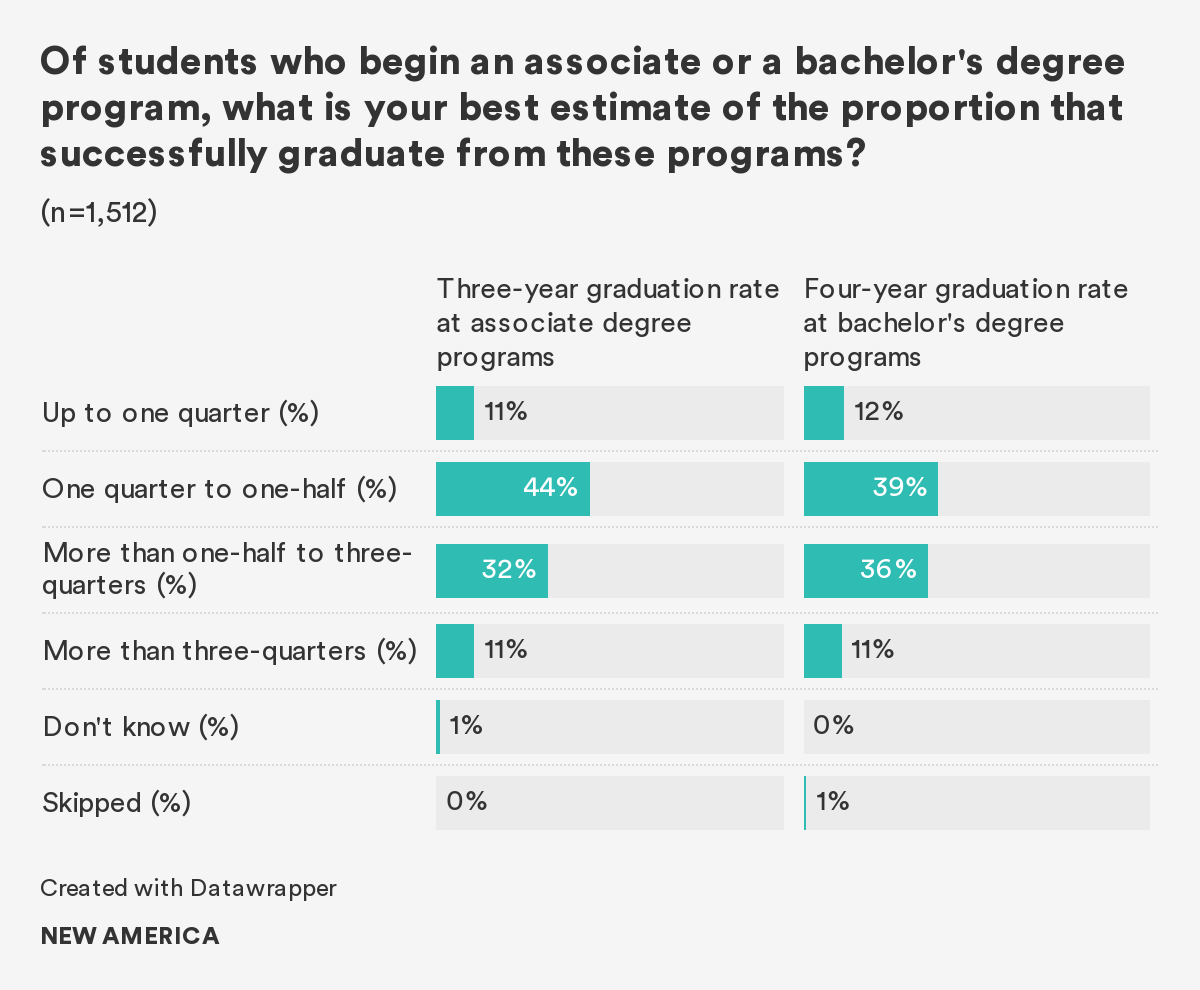
More than half of Americans (55 percent) think that half or fewer students who begin an associate degree program can finish within three years. Having said that, a significant 32 percent of Americans estimate that the graduation rate is between one-half and three-quarters.
Americans are split on the graduation rate of students who pursue bachelor’s degree programs. Half of Americans think less than 50 percent of these students would graduate in four years, but the other half think the graduation rate would exceed 50 percent. A significant 39 percent think that graduation rate is between a quarter and a half, and 36 percent think that the graduation rate is between a half and three-quarters
Reality
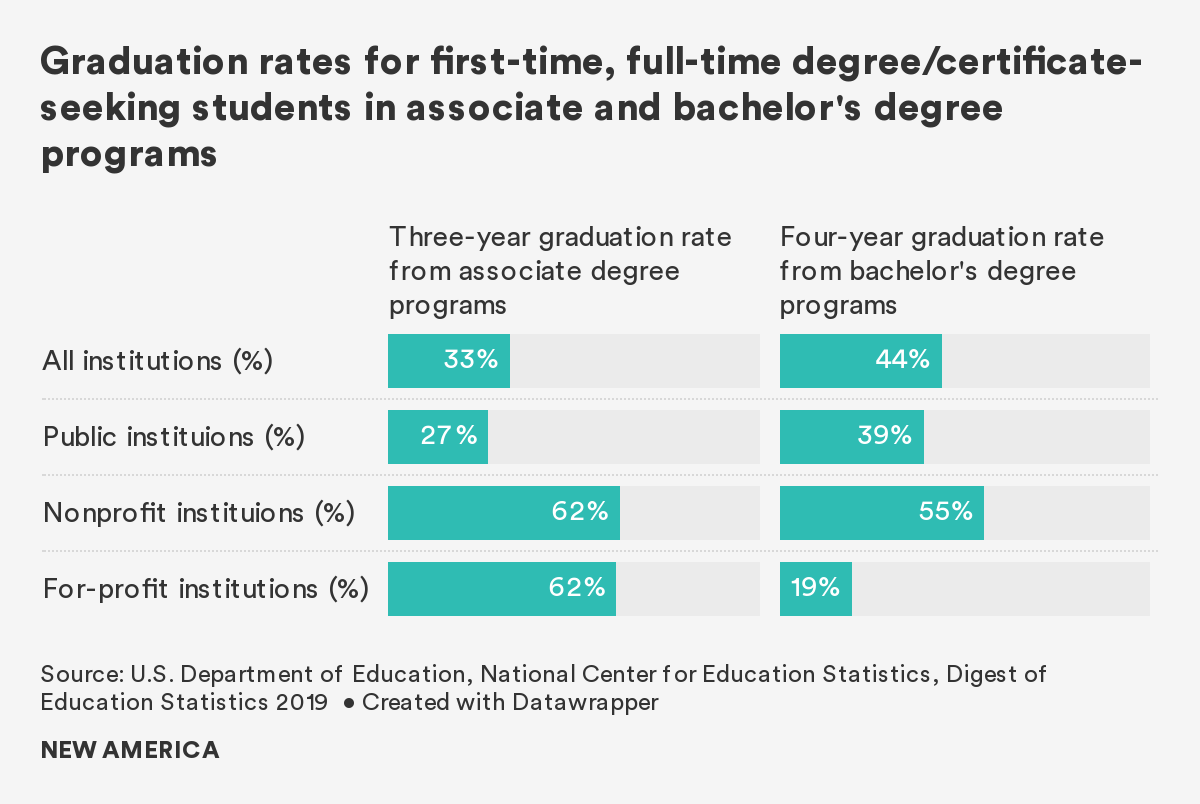
It is difficult to conclusively answer these questions. We do know that 33 percent of first-time, full-time students graduate with an associate’s degree or certificate within three years5 and 44 percent of first-time, full-time students graduate with a bachelor’s degree within four years.6 The data, however, do not include less than full-time students, who accounted for more than 55 percent of undergraduates in 2015,7 and transfer students, who represented 35 percent of undergraduates who started college in 2012.8
Perception
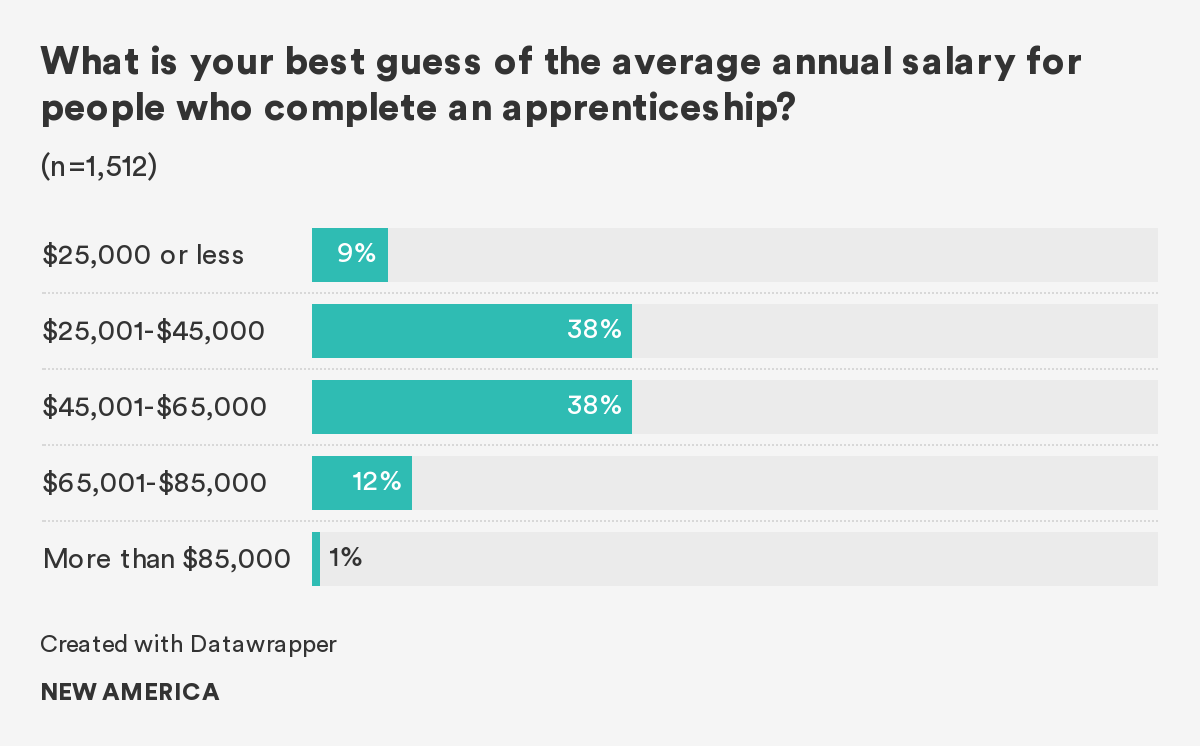
Americans are mixed about how much they think an individual who just completed an apprenticeship makes. Nearly 40 percent of Americans think the average earnings is somewhere between $25,000 and $45,000 a year, and a similar share (38 percent) think that the average annual salary for these individuals is between $45,000 and $65,000.
Reality
According to the U.S. Department of Labor, people who complete an apprenticeship on average earn $60,000 annually.9 Apprentices often graduate with jobs, credentials that can help them move up the career ladder, and little to no student loan debt.10
Perception
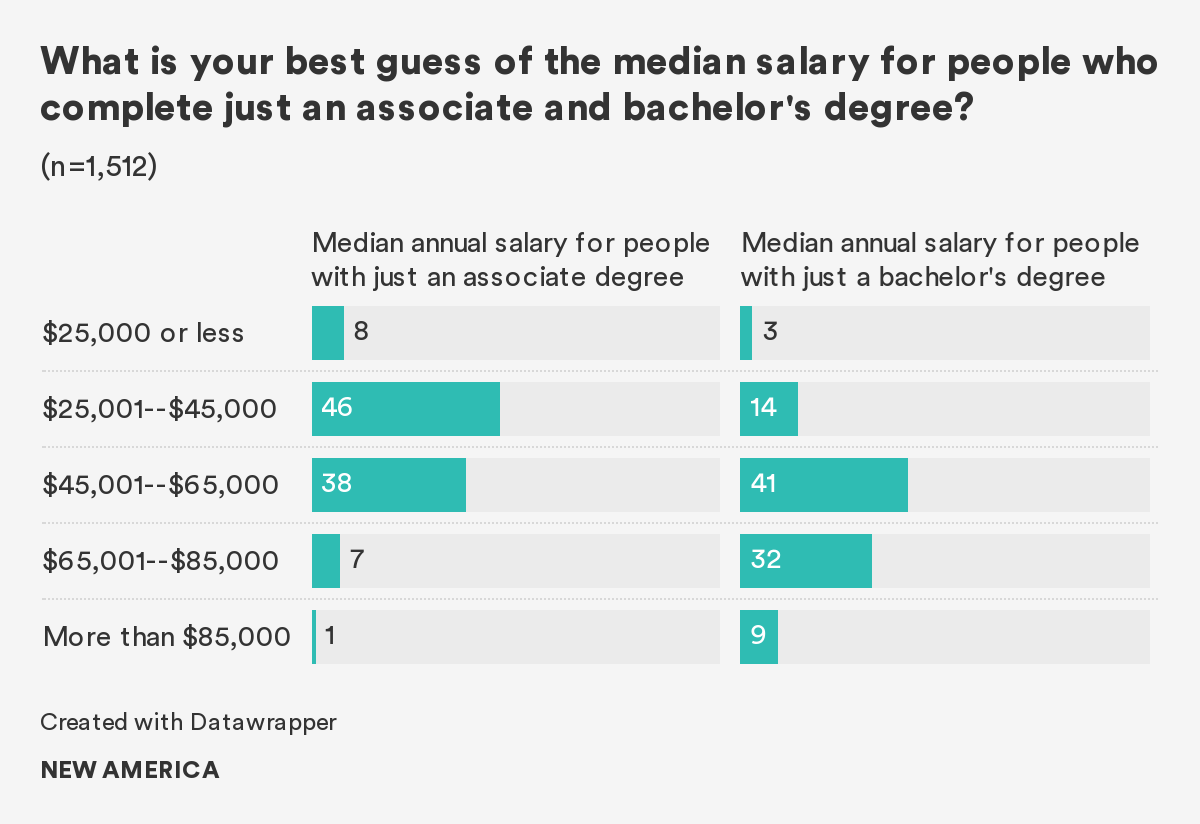
Nearly half of Americans (46 percent) think that the median annual salary for an individual who just completed an associate degree ranges between $25,000 and $45,000; 38 percent estimate that the number would be higher, from $45,000 to $65,000.
Four in five Americans (82 percent) think that the median annual salary for those with only a bachelor’s degree is $45,000 or higher: 41 percent think that the number is within the range of $45,000 to $65,000; 32 percent think that the salary is between $65,000 and $85,000.
Reality
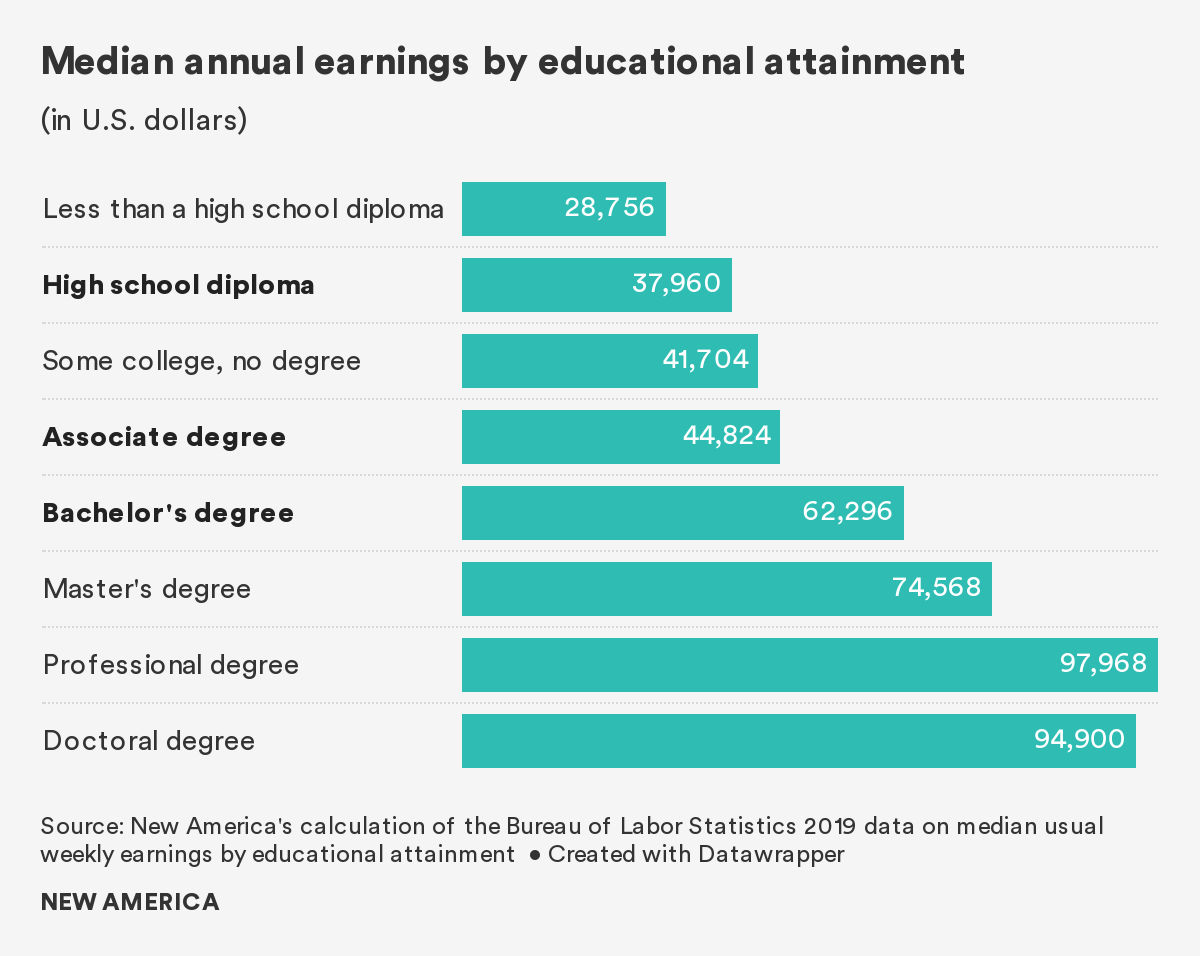
Bachelor’s degrees and higher continue to offer the largest payout. According to the Bureau of Labor Statistics, in 2019 the median annual earnings of individuals with associate degrees was nearly $45,000, and of those with bachelor’s degrees (and no postgraduate education) was approximately $62,000. These are nearly 20 and 65 percent more, respectively, than the annual earnings of someone who received a high school diploma or equivalency and did not pursue further education.11
Student loans
Perception
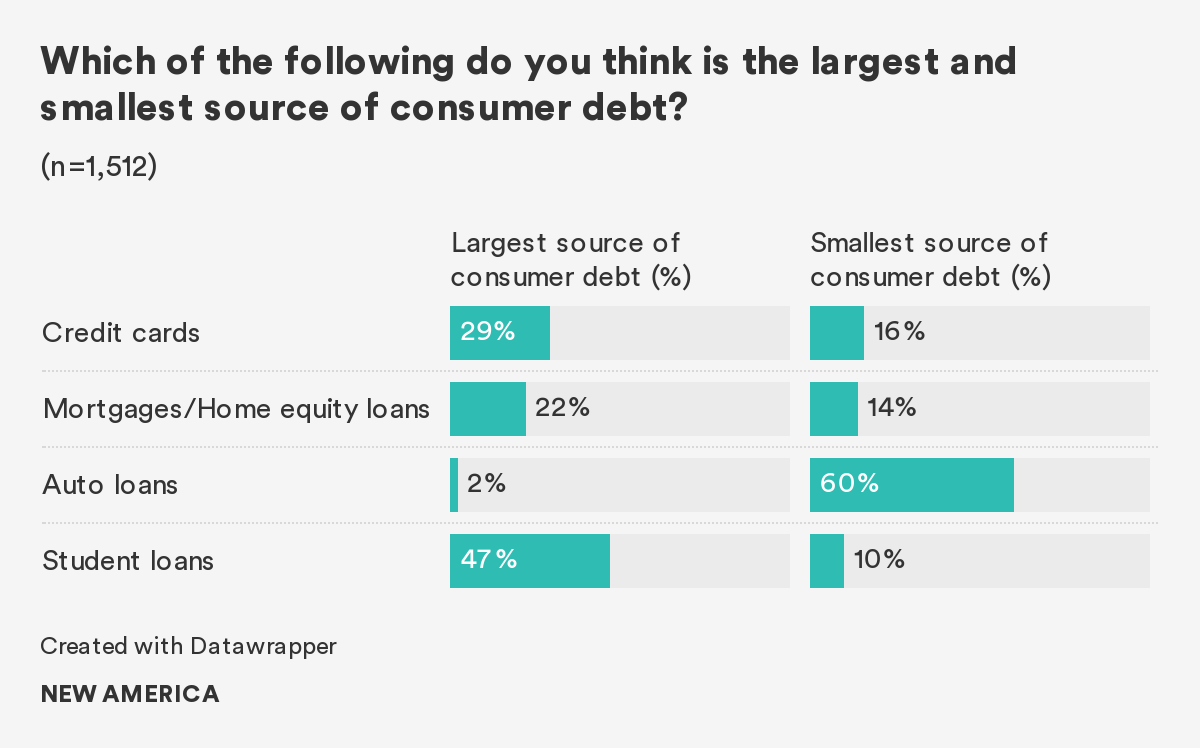
A majority of Americans think the largest source of consumer debt is student loan debt (47 percent), 29 percent think credit card debt, 22 percent say mortgages/home equity loans, and 2 percent say auto loans.
Asked in the opposite direction, 60 percent say auto loans are the smallest source of consumer debt, followed by credit cards at 16 percent, mortgages/home equity loans at 14 percent, and student loans at 10 percent.
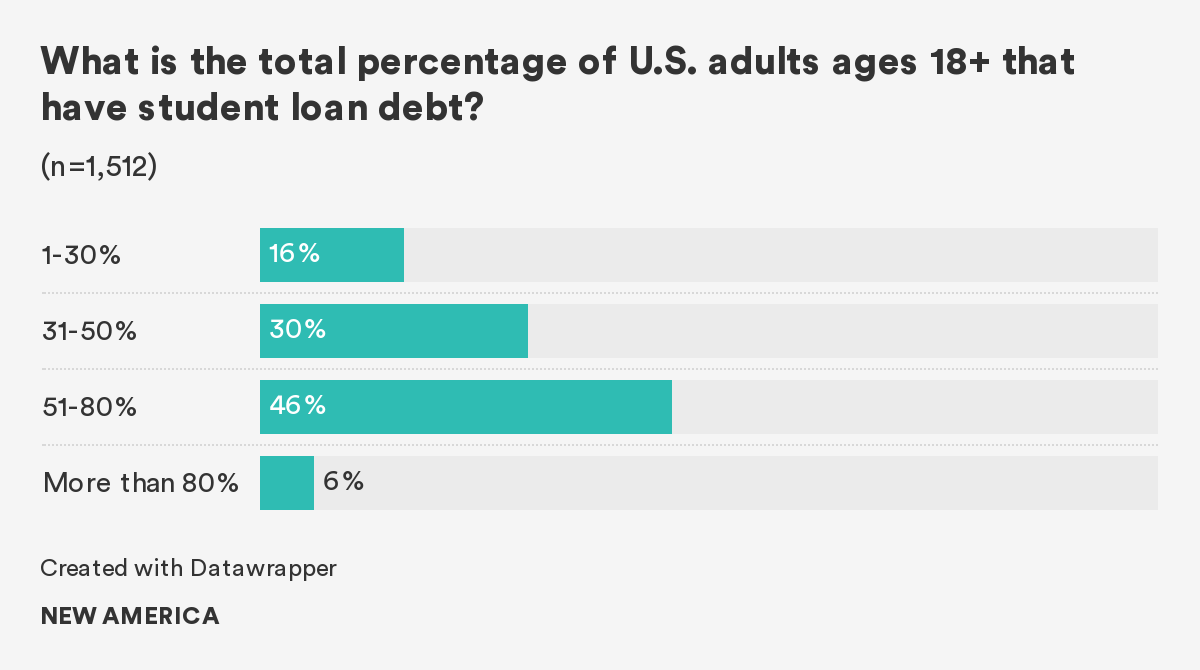
Four in five Americans (82 percent) think that more than 31 percent of American adults are carrying student loan debts. Nearly half think that the real percentage of Americans with student loan debt is somewhere between 50 to 80 percent.
Reality
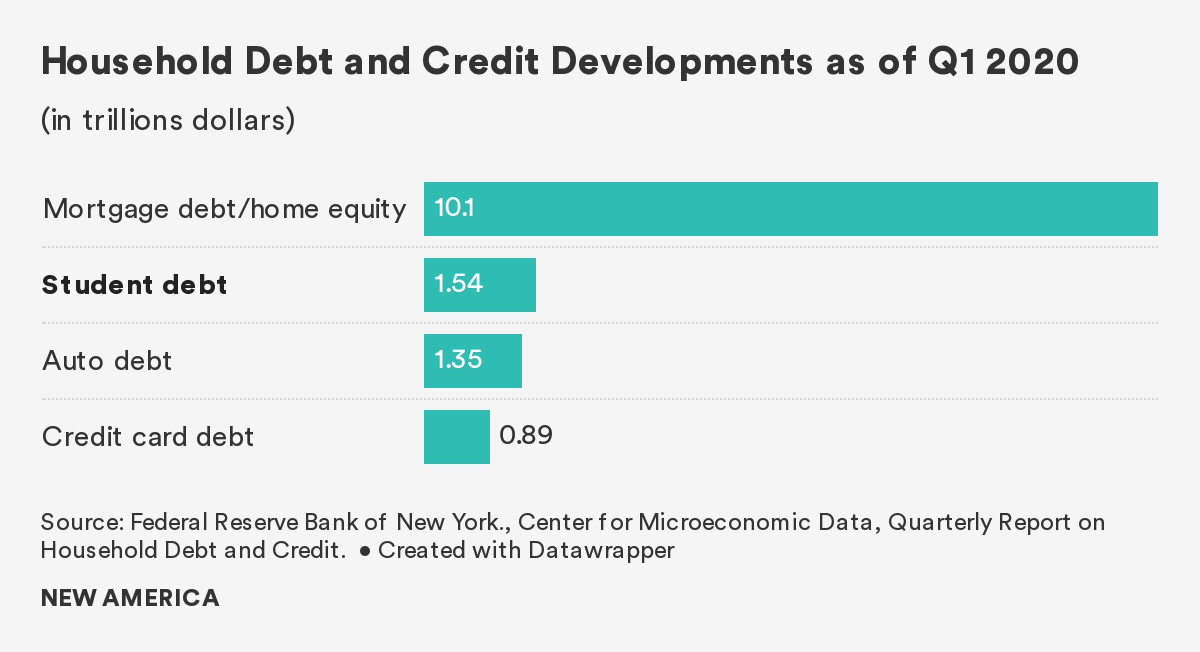
The largest source of consumer debt, in fact, are mortgages/home equity loans which account for approximately $10.1 trillion, distantly followed by student loans ($1.5 trillion), auto loans ($1.4 trillion), and credit cards ($898 billion).12 And, according to the Federal Reserve Board’s 2018 Survey of Household Economics and Decisionmaking, 16 percent of American adults currently hold student loan debt for their own education.13 If we also take into account people with student loan debt for their spouses, children, and grandchildren’s education, the percentage is 21 percent.14
Perception
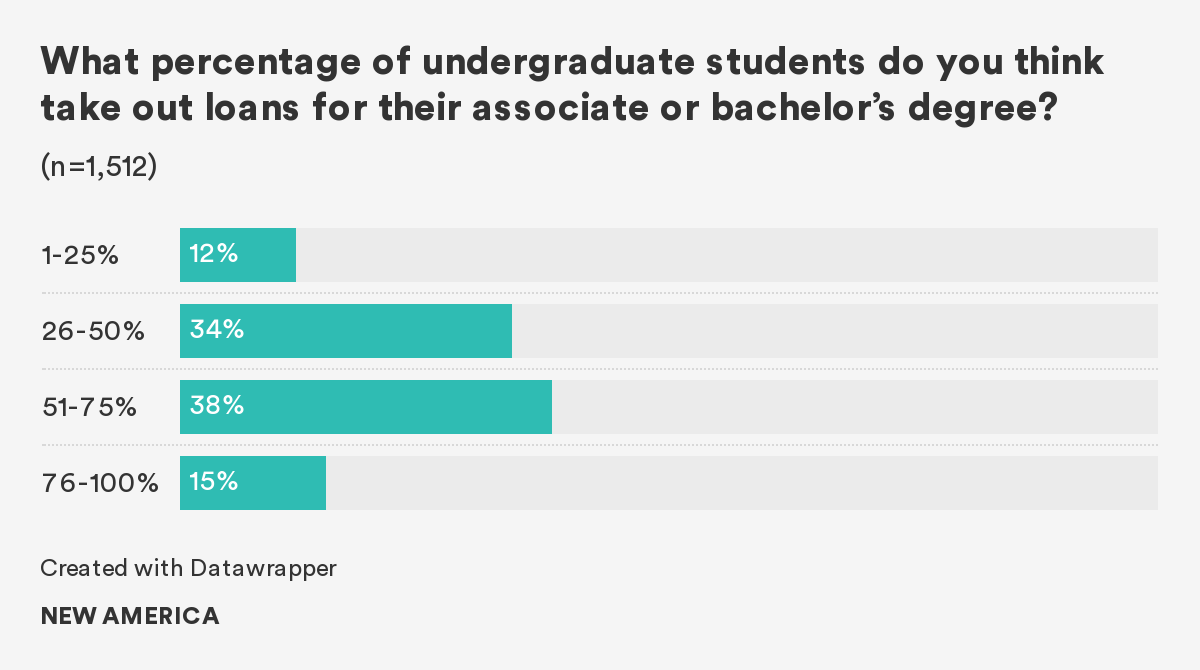
Nearly 40 percent of Americans think that between 51 and 75 percent of undergraduates borrow for their associate or bachelor’s degree. Fifteen percent of Americans think that borrowing rate is more than 75 percent.
Reality
Most Americans’ guesses are not too far from the truth: 60 percent of students who started their higher education in 2012 took out loans for their undergraduate programs.15 Specifically, 58 percent of students who held an associate degree by 2017, and 66 percent of students who held a bachelor’s degree took out loans.16 Additionally, a concerning 50 percent of students who dropped out before completing their degree or credentials also had student loan debt.17 These students are more likely to default on their student loans in the future.18
Perception
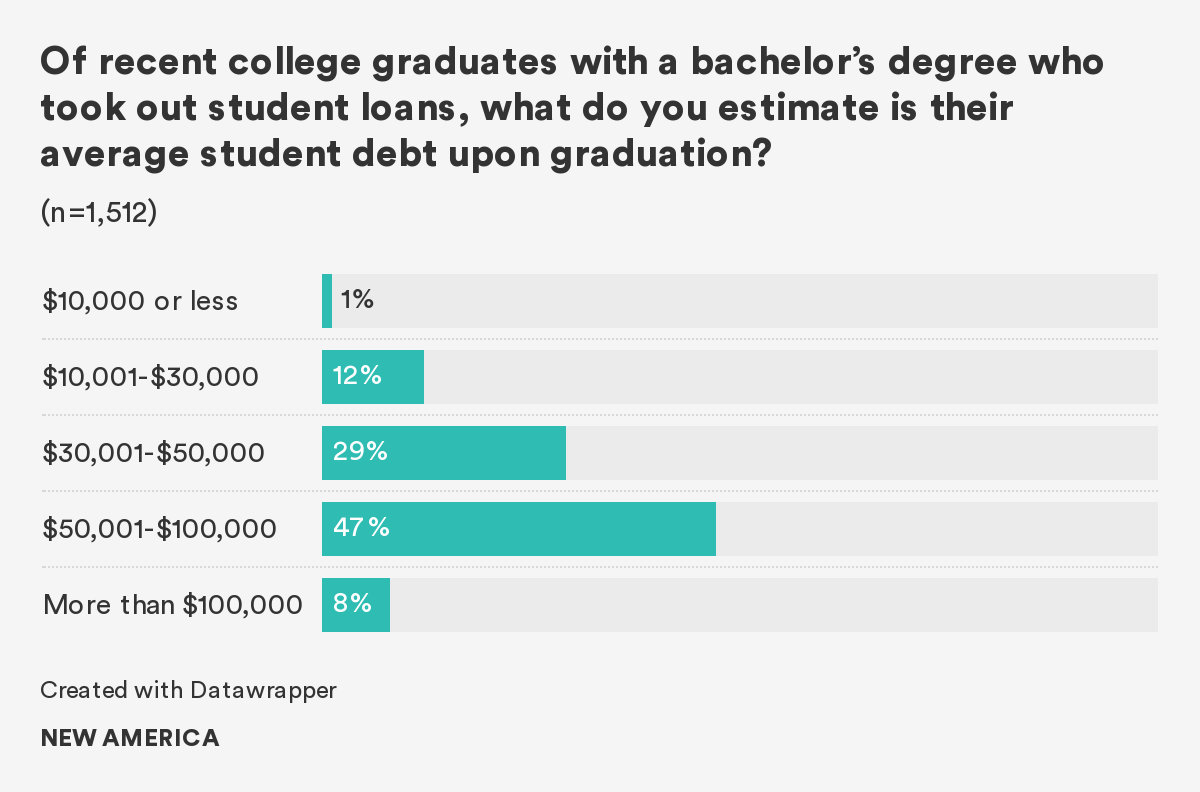
Nearly half of Americans think that the average student debt of a recent college graduate with a bachelor’s degree is between $50,000 and $100,000. Nearly a third think that the average is within $30,000 and $50,000. Eight percent think the average loan is more than $100,000 and only 1 percent think that the average loan is less than $10,000.
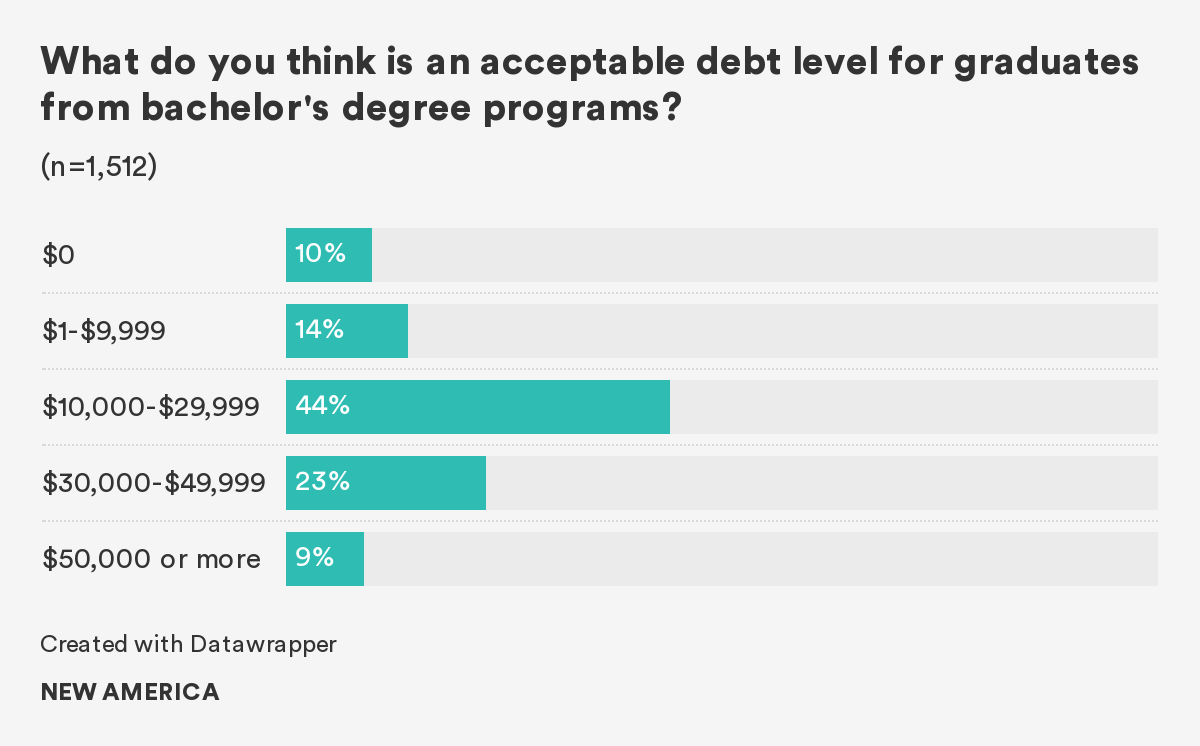
When asked what amount they think is acceptable, just under half say the amount should fall between $10,000 and $30,000. Nearly one in four Americans accept an amount between $30,000 and $50,000. One in ten Americans think that students should not borrow at all for their bachelor’s degree.
What Americans think of as reality turns out to be very different from what they find acceptable.
Reality
The average student debt, which includes both federal and private debt, at graduation for the class of 2018 at public and private nonprofit institutions was $29,200, compared to $39,900 for graduates of for-profit institutions.19 An average loan amount of less than $30,000 still aligns with what a majority of Americans thought to be acceptable.
Perception
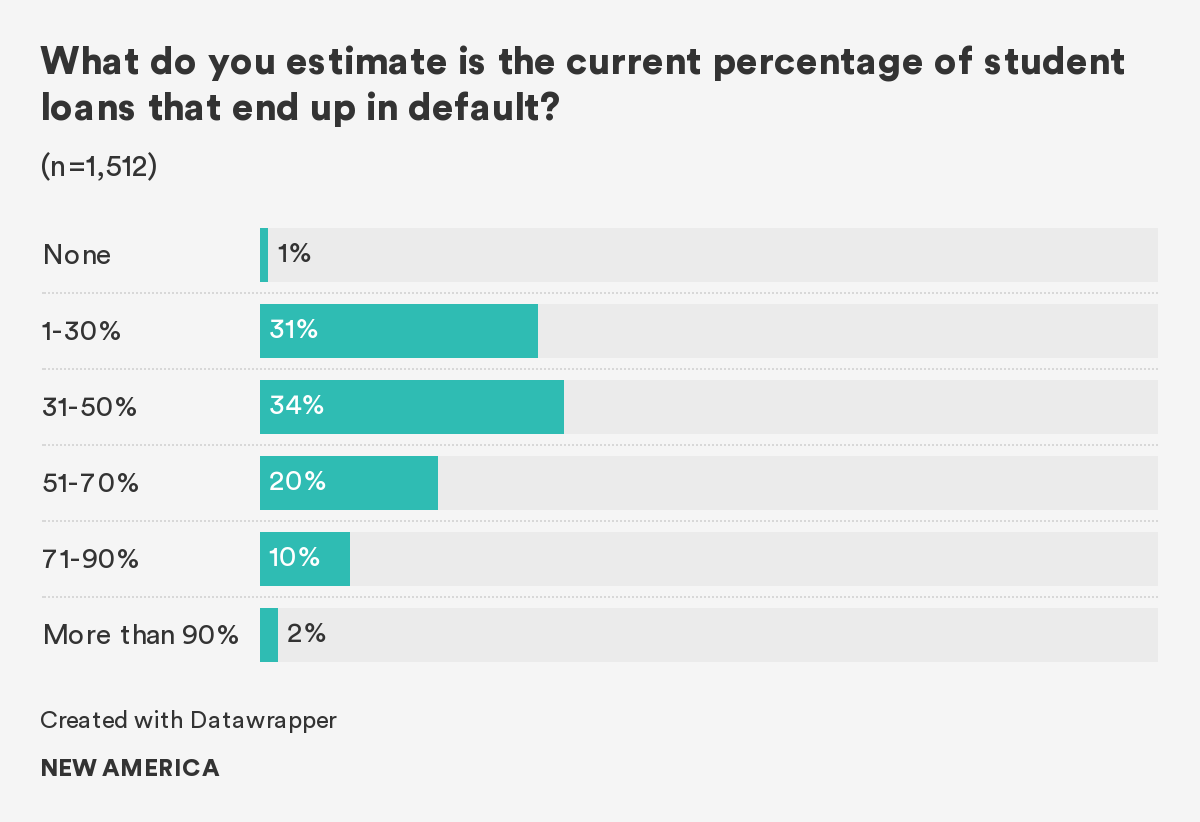
A third of Americans think that between 31 and 50 percent of student loans will end up in default. A similar share thinks that the default rate will be less than 30 percent, while more than 10 percent think that the default rate is more than 70 percent.
Reality
Over one million students every year default on their loans.20 More than 16 percent of borrowers who started higher education in 2012 defaulted on their student loans five years later.21 Student loans are classified as “in default” when a student fails to make a minimum payment for 270 days. Default rates vary significantly across students and institutions: nearly 30 percent of Black borrowers defaulted on their student loans, compared to 12 percent of white borrowers.22 Forty-one percent of those who dropped out without a credential defaulted compared to only 6 percent of those with a degree.23 A third of students who started in private for-profit institutions defaulted within the same period.24
Citations
- Author’s calculation of data from the Survey of Household Economics and Decisionmaking 2018 (Washington, DC: Federal Reserve Board, 2019), source
- Federal Reserve Bank of New York, “Pre-COVID-19 Data Shows Total Household Debt Increased in Q1 2020, Though Growth in Non-Housing Debt Slows,” press release, May 05, 2020, source
- National Center for Education Statistics (website), The National Postsecondary Student Aid Study 2016 (NPSAS:2016), source
- NPSAS:2016, source
- National Center for Education Statistics (website), Digest of Education Statistics, Table 326.20, source
- National Center for Education Statistics (website), Digest of Education Statistics, Table 326.10, source
- NPSAS:2016, source
- National Center for Education Statistics (website). Beginning Postsecondary Students 2012/2017 (BPS:2012/2017), source
- Department of Labor, “Workforce System and Apprenticeship Partnerships,” source
- Team CESNA, “Building Strong and Inclusive Economies through Apprenticeship,” New America, source
- Author’s calculation of data from the U.S. Bureau of Labor Statistics (website), “Unemployment Rates and Earnings by Educational Attainment,” last modified September 4, 2019, source
- Federal Reserve Bank of New York, “Pre-COVID-19 Data Shows Total Household Debt Increased in Q1 2020, Though Growth in Non-Housing Debt Slows,” press release, May 05, 2020, source
- Author’s calculation from data from the Federal Reserve Board, “Survey of Household Economics and Decisionmaking 2018,” source
- Author’s calculation from data from Survey of Household Economics and Decisionmaking 2018
- BPS:2012/2017, source
- BPS:2012/2017
- BPS:2012/2017
- “Student at Greatest Risk of Loan Default,” Institute for Student Access & Success, April 2018, source
- Veronica Gonzalez, Lindsay Ahlman, and Ana Fung, Student Debt and the Class of 2018 (Oakland, CA: Institute for Student Access & Success, September 2019), source
- Author’s calculation of data from Office of Federal Student Aid (website), “Default Rates,” source
- BPS 2012/2017, source
- BPS 2012/2017
- BPS 2012/2017
- BPS 2012/2017
College Affordability in the 2020 Election
Over the past year, progressive Democrats who ran for their party’s nomination made free college and student debt cancellation the central tenets of their campaign platforms. In April, presumptive Democratic nominee Joe Biden outlined his own plans to cancel1 student debt for a portion of borrowers and to make public colleges and universities tuition-free for families making less than $125,000.2
It is clear that Biden announced these plans in part to win backing from his former rivals for the nomination. But he may have also done so because making college free and providing widespread student loan debt forgiveness are politically popular. Varying Degrees shows that a majority of likely voters back such proposals. However, our survey also reveals stark partisan and generational divisions over these ideas.
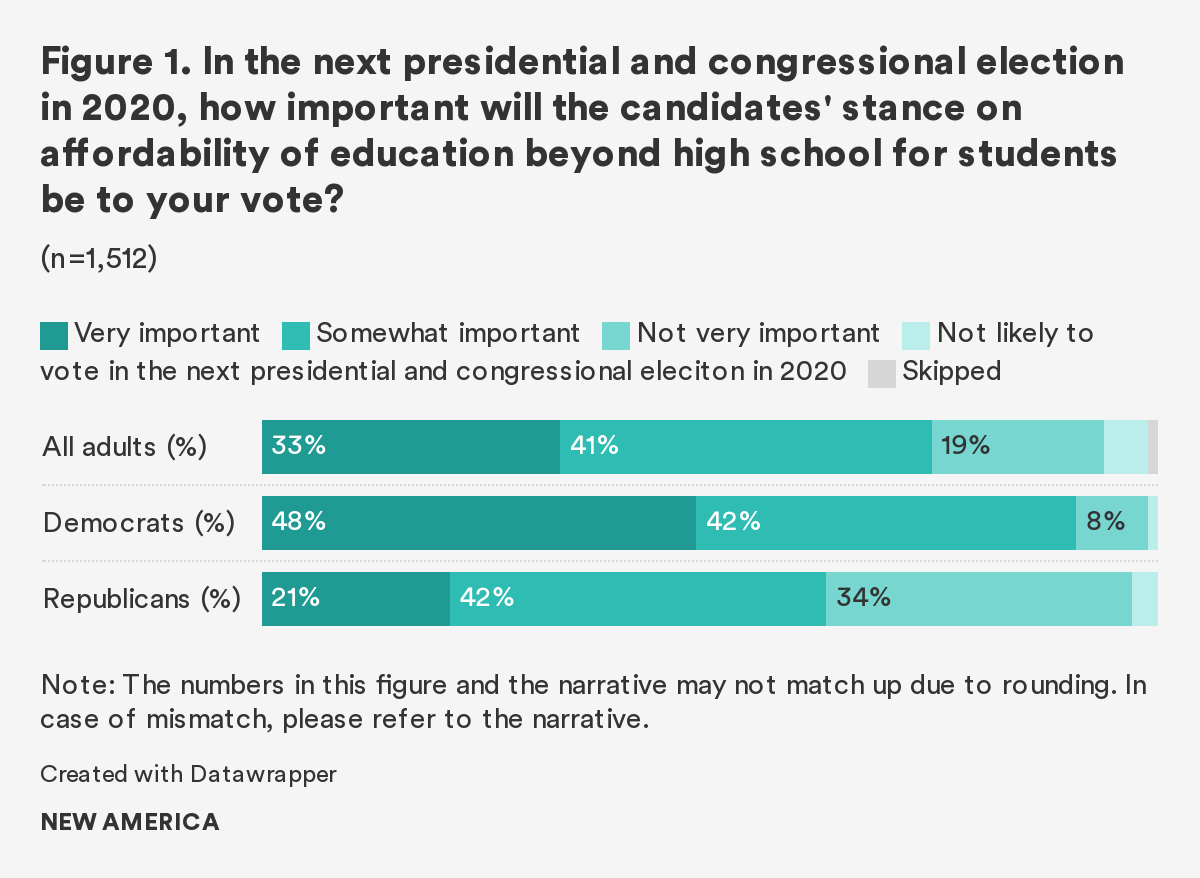
In general, Americans want policymakers to work towards ensuring affordable education opportunities beyond high school. One third (33 percent) of Americans agree that making postsecondary education affordable for students is a “very important” stance to have in order to receive their vote. A larger share of Americans(41 percent) believe that it is “somewhat important.” Nearly half of Democrats agree that such a stance is “very important” (48 percent), compared to less than one-quarter of Republicans (21 percent) who do so (Figure 1).
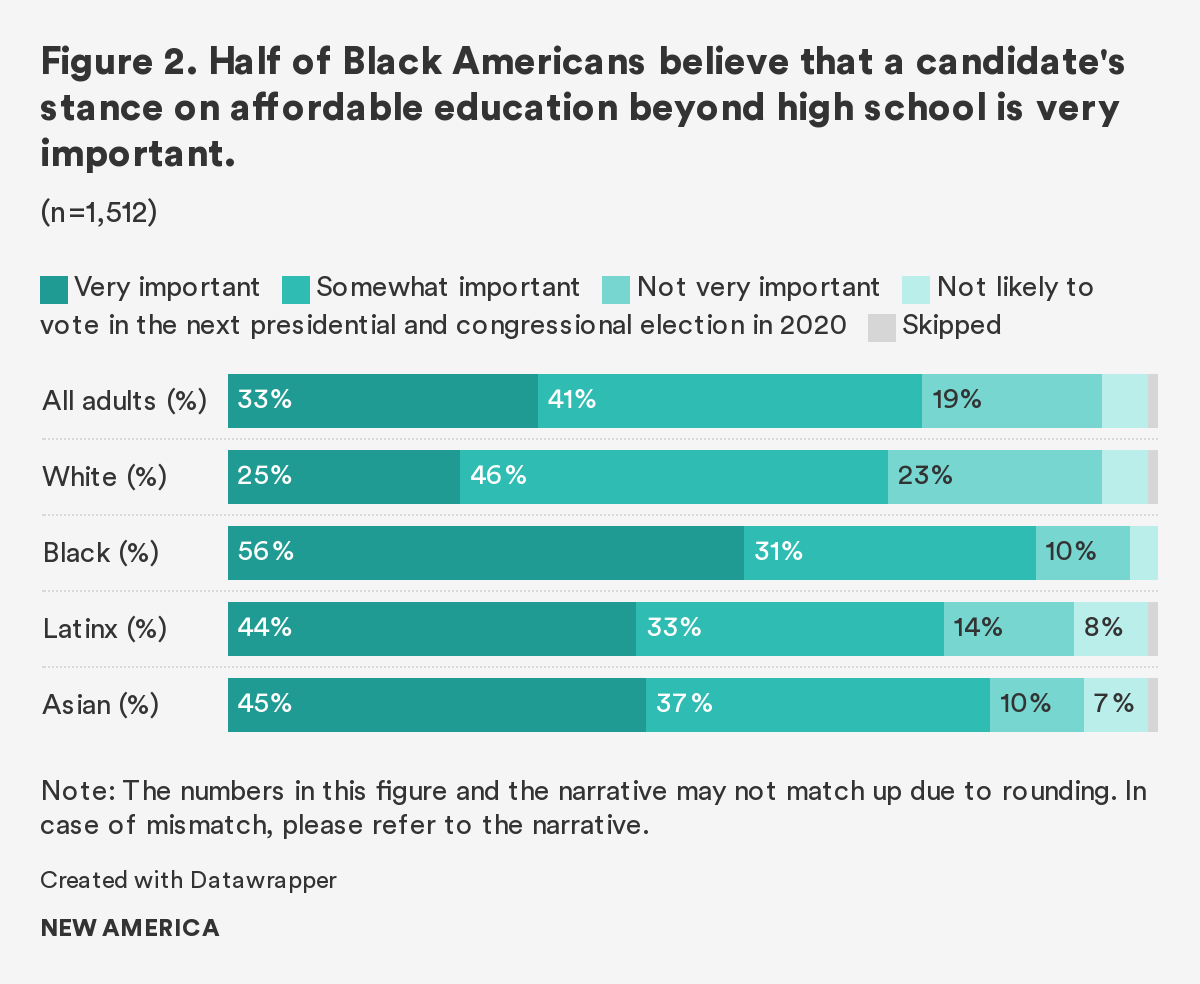
Responses vary among racial groups: 55 percent of Black respondents consider college affordability a “very important” issue for political candidates, as do 44 percent of Latinx respondents . In comparison, only 25 percent of white respondents agree (Figure 2).
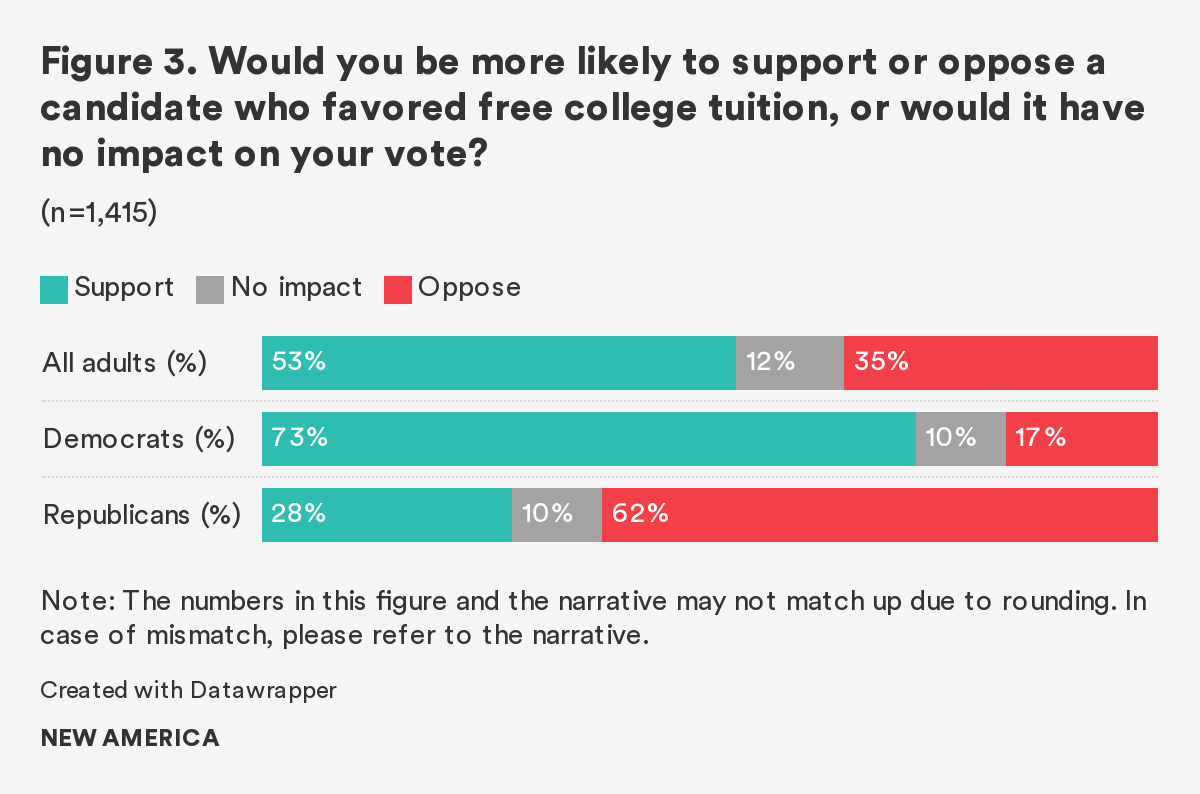
When asked if they would support a candidate who favored tuition-free college, 53 percent of likely voters said yes. This figure is roughly the same as last year. Democratic and Republican likely voters are significantly divided on this statement: 73 percent of Democratic voters would support a candidate who backs tuition-free college, while only 28 percent of Republican voters would support such a candidate (Figure 3).
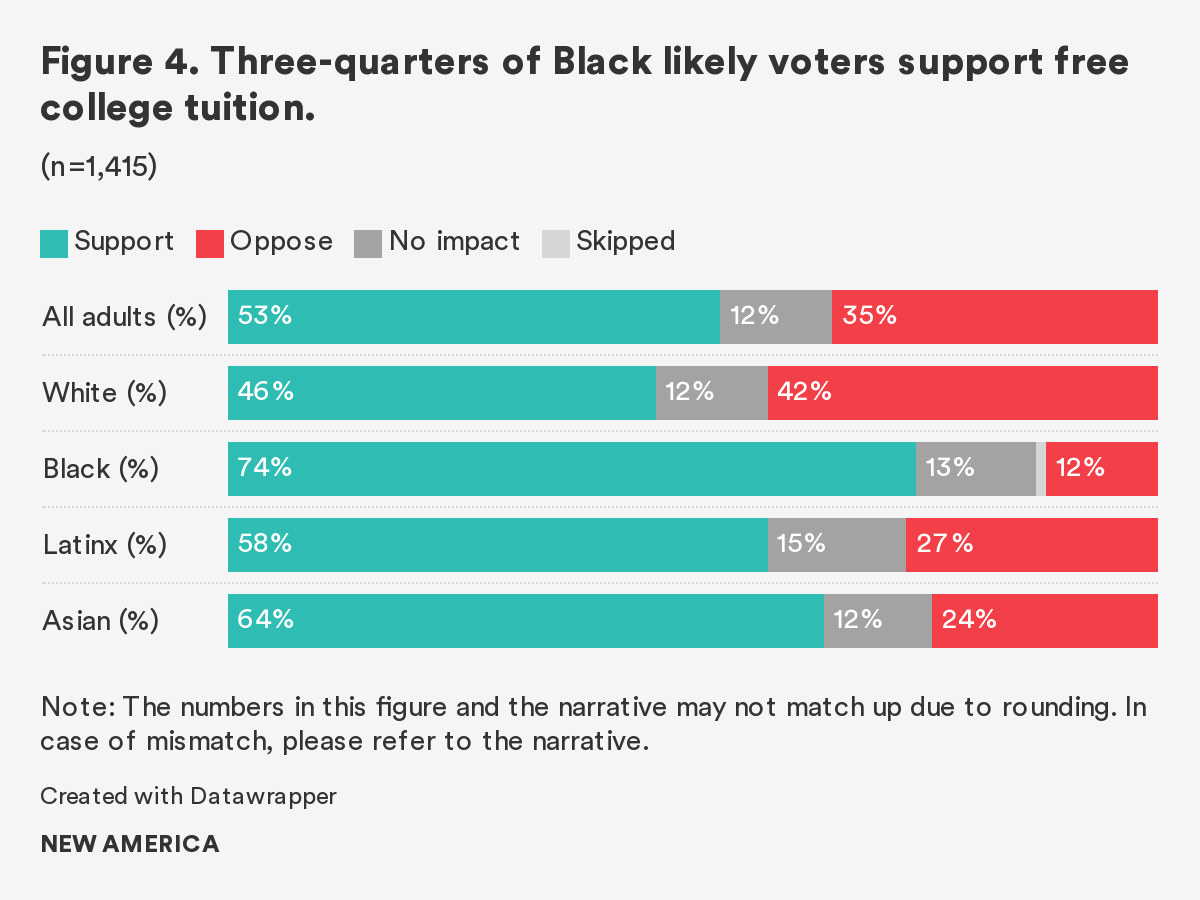
Likely voters from different racial groups think differently about free college (Figure 4). When asked if they would support a candidate who believes in free college, 74 percent of Black likely voters and 58 percent of Latinx likely voters said they would support such a candidate. A significantly less share of white likely voters (46 percent) said the same. There was also a significant difference between those with student loans and those without: 72 percent of likely voters with student loans say they would be more likely to support a candidate who favored free college tuition, compared to 48 percent of those without student loans.
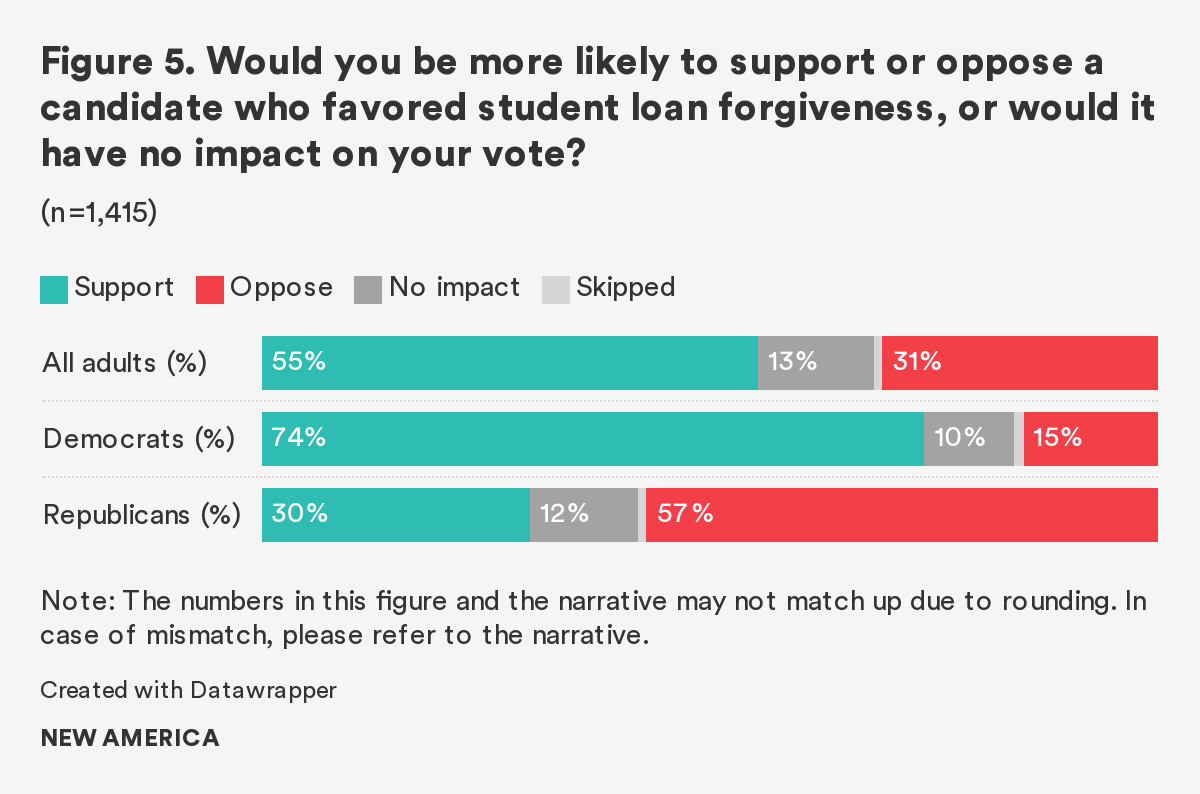
The staggering amount of student loan debt often makes headlines, and the possibility of widespread student loan forgiveness, which has been proposed by former presidential candidates Elizabeth Warren and Bernie Sanders, resonates with a majority of likely voters. In general, 56 percent of them would support a candidate who favored broad student loan forgiveness. As with free college, the partisan difference runs deep. While nearly three-quarters of Democratic likely voters (74 percent) would support a candidate in favor of widespread debt forgiveness, about one-third of Republican likely voters (30 percent) said they would do so (Figure 5).
There are not only sharp partisan divisions over these proposals, but generational ones as well. Unsurprisingly, the younger a likely voter is, the more likely that individual is to support them. When asked if they would support a candidate in favor of broad student loan forgiveness, 66 percent of Generation Z, 66 percent of Millennials, and 58 percent of Generation X said they would support such a candidate, but only 46 percent of Baby Boomers and 34 percent of the Silent Generation agreed.
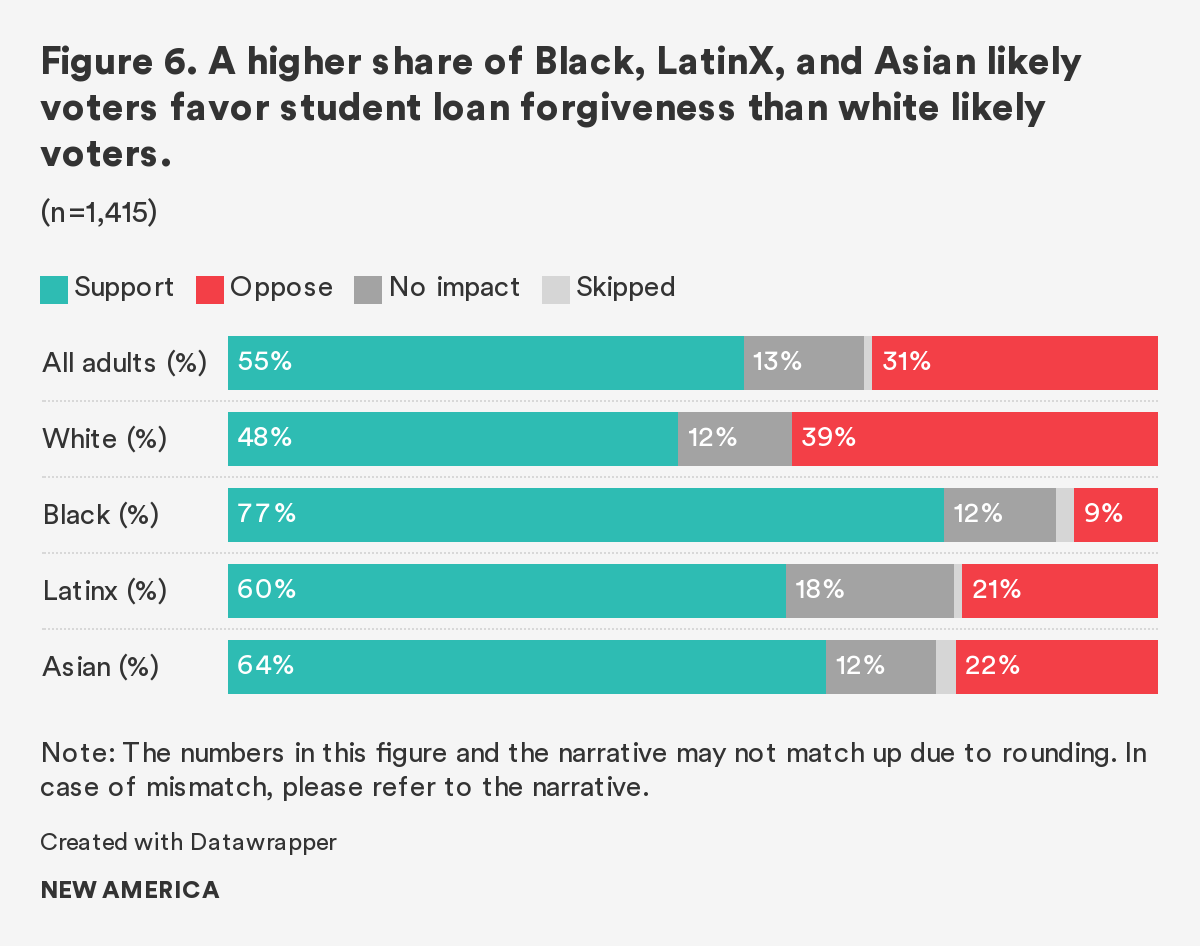
Some racial groups were more supportive of broad student loan forgiveness than others (Figure 6). Seventy-seven percent of Black likely voters said they would support a candidate who backed widespread loan forgiveness, while 60 percent of Latinx likely voters and 48 percent of white likely voters said they would support such a candidate.
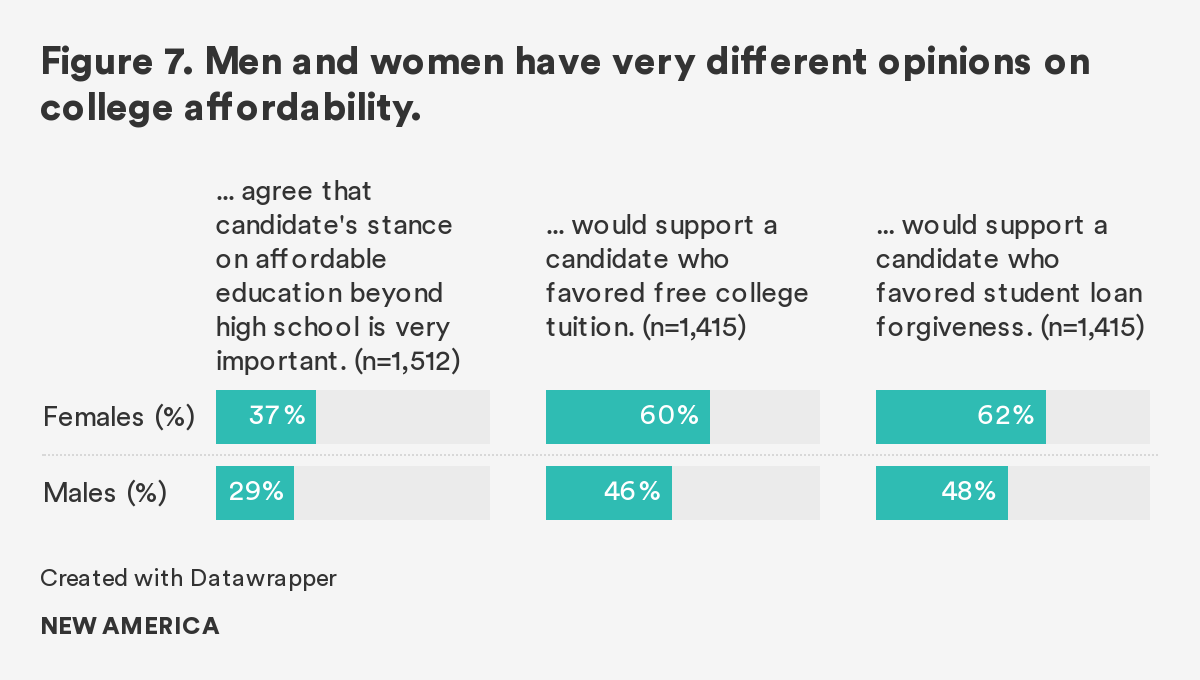
Gender also played a significant role in how one viewed these issues (Figure 7). A larger share of women (37 percent) said that a candidate’s stance on affordability is “very important” to their vote, compared to 29 percent of men who agreed. When asked how much they favored candidates who supported free college tuition, 60 percent of female likely voters said they favored such candidates, and 62 percent of them supported ones who supported broad student loan forgiveness. In comparison, less than half of likely male voters said they would vote for candidates who supported either position (46 percent for free tuition, 48 percent for widespread loan forgiveness).
APPENDIX
Methodology
Survey Population
Varying Degrees was administered using NORC’s AmeriSpeak® Panel for the sample source. Funded and operated by NORC, AmeriSpeak is a probability-based panel designed to be representative of the US household population. A general population sample of U.S. adults 18 years of age and older was selected from NORC’s AmeriSpeak Panel for this study. Additional African-Americans, Hispanics/Latinos, and Asian Americans were also selected from NORC’s AmeriSpeak Panel for three specific race-ethnicity oversamples.
In total, NORC collected 1,512 interviews, 116 by phone mode and 1,396 by web mode.
Table of Sample Sizes, Margin of Error, and Design Effect
| Samples | Sample Size | Margin of Error | Design Effect |
|---|---|---|---|
| General Population | 1,512 | 3.59% | 2.02378 |
| African-American | 269 | 7.64% | 1.63509 |
| Asian-American | 225 | 8.63% | 1.7447 |
| Hispanic/Latino | 330 | 7.76% | 2.06809 |
Data Collection Procedures
To administer the phone-survey, NORC dialed the sampled phone-mode panelists throughout the field period. To encourage study cooperation among web-mode panelists, NORC sent email and SMS text message reminders after the initial contact between Sunday, February 15th and Monday, February 24th. These web panelists were allowed to complete the survey via phone if convenient. Panelists were offered the cash equivalent of $3.
About AmeriSpeak
Funded and operated by NORC at the University of Chicago, AmeriSpeak® is a probability-based panel designed to be representative of the US household population. Randomly selected US households are sampled using area probability and address-based sampling, with a known, non-zero probability of selection from the NORC National Sample Frame. These sampled households are then contacted by US mail, telephone, and field interviewers (face to face). The panel provides sample coverage of approximately 97 percent of the U.S. household population. Those excluded from the sample include people with P.O. Box only addresses, some addresses not listed in the USPS Delivery Sequence File, and some newly constructed dwellings. While most AmeriSpeak households participate in surveys by web, non-internet households can participate in AmeriSpeak surveys by telephone. Households without conventional internet access but having web access via smartphones are allowed to participate in AmeriSpeak surveys by web. AmeriSpeak panelists participate in NORC studies or studies conducted by NORC on behalf of governmental agencies, academic researchers, and media and commercial organizations. For more information, email AmeriSpeak-BD@norc.org or visit AmeriSpeak.norc.org.
Explore the Data
Error: Data visualization bundle URL missing.
More About the Authors
Myra Francisco
Higher Education Intern
Rachel Fishman
Director, Higher Education

Sophie Nguyen
Senior Policy Manager, Higher Education
Issues
Programs/Projects/Initiatives
Related