Key Findings
Costs of Care Are Misunderstood
Most Americans have little understanding of how much care costs, especially over time—often underestimating the costs while overestimating how much care workers are paid and how much the government spends on child care.
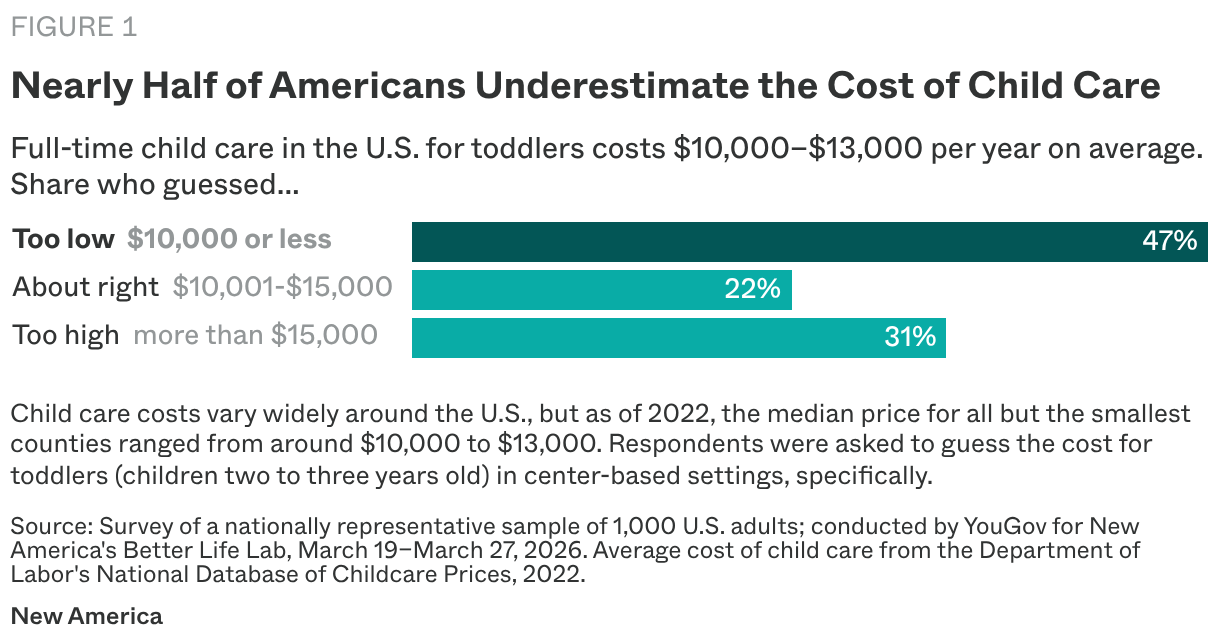
Respondents tend to underestimate how much child care costs families.
Perception: Nearly half (47 percent) of respondents think full-time child care for a toddler costs less than $10,000 a year, with 27 percent thinking it costs less than $5,000.
Reality: The cost varies widely by state, but as of 2022, the median price for all but the smallest counties ranged from around $10,000 to $13,000.
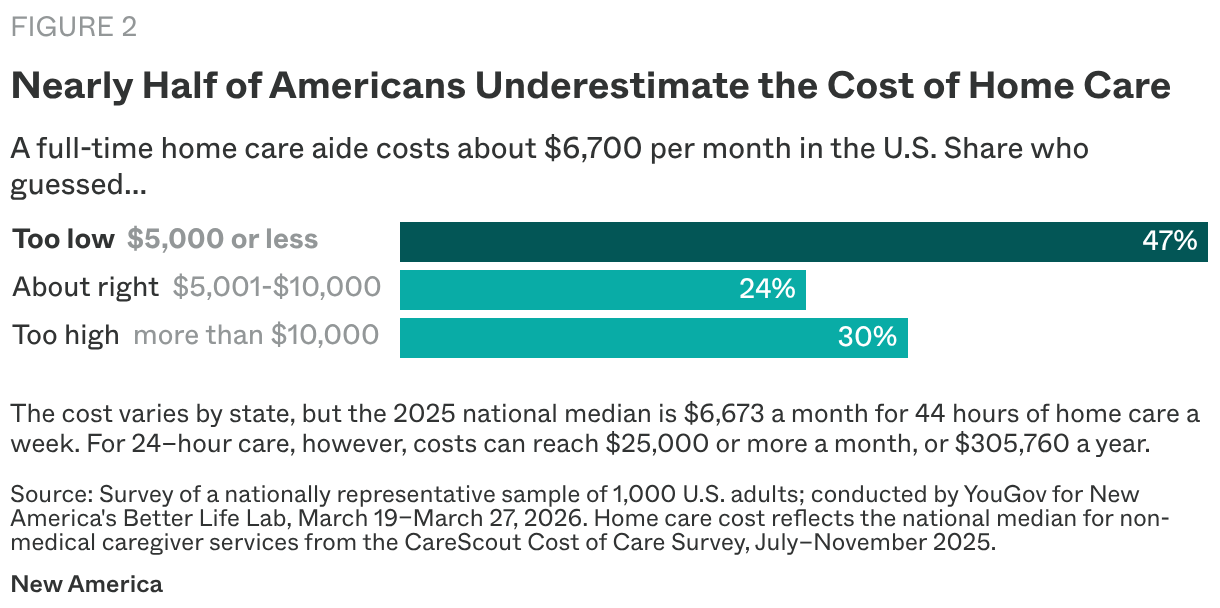
The true cost of full-time home care, and how it can quickly escalate, is invisible to most Americans.
Perception: Nearly three-quarters (71 percent) of respondents think home care for older and disabled adults costs less than $10,000 a month, and 47 percent think it costs less than $5,000 a month.
Reality:
- The cost varies by state, but based on the 2025 national average of $35 an hour, 44 hours of home care a week costs families about $6,673 a month, or about $80,000 a year. In six states, annual costs run more than $100,000, or $8,333 a month (Maine, Minnesota, South Dakota, Vermont, Washington, and Wyoming).
- For 24-hour care, costs can reach $25,000 or more a month, or $305,760 a year.
Respondents also underestimate how much it costs people to reduce hours or drop out of the workforce to care for adult family members.
Perception: Fully 76 percent think caregivers lost less than $300,000 over their lifetimes as a result of caring for an older adult, with 57 percent thinking family caregivers lost less than $200,000.
Reality: One 2011 MetLife study found that, over their lifetimes, women who care for adult family members lose $324,044 in wages, Social Security benefits, and retirement savings. In 2026, according to the American Institute for Economic Research calculator, that figure would total nearly $470,000. And that doesn’t include lost earnings from unpaid child care.
Respondents modestly overestimate how much care workers make, though a majority say that is still too little to live on.
Perception:
- Child care: Among all respondents, 58 percent think child care workers make more than $15 an hour, with 31 percent thinking they make at least $19 an hour. However, 63 percent say that isn’t enough to live on, 16 percent say it is, and 20 percent aren’t sure.
- Home care: Over half (61 percent) of respondents think home care workers make more than $15 an hour, with 39 percent thinking they make at least $19 an hour. A 58 percent–majority say that isn’t enough to live on. Just 18 percent think it is sufficient, and 23 percent aren’t sure.
Reality:
- Child care: Child care workers earn, as of 2024, a median wage of $15.41 per hour, less than 97 percent of all other occupations, and 43 percent of these workers rely on public assistance.
- Home care: Home care workers earn a median wage of $16.78 per hour, with 36 percent living in low-income households and 49 percent relying on public assistance, like Medicaid or food and nutrition support.
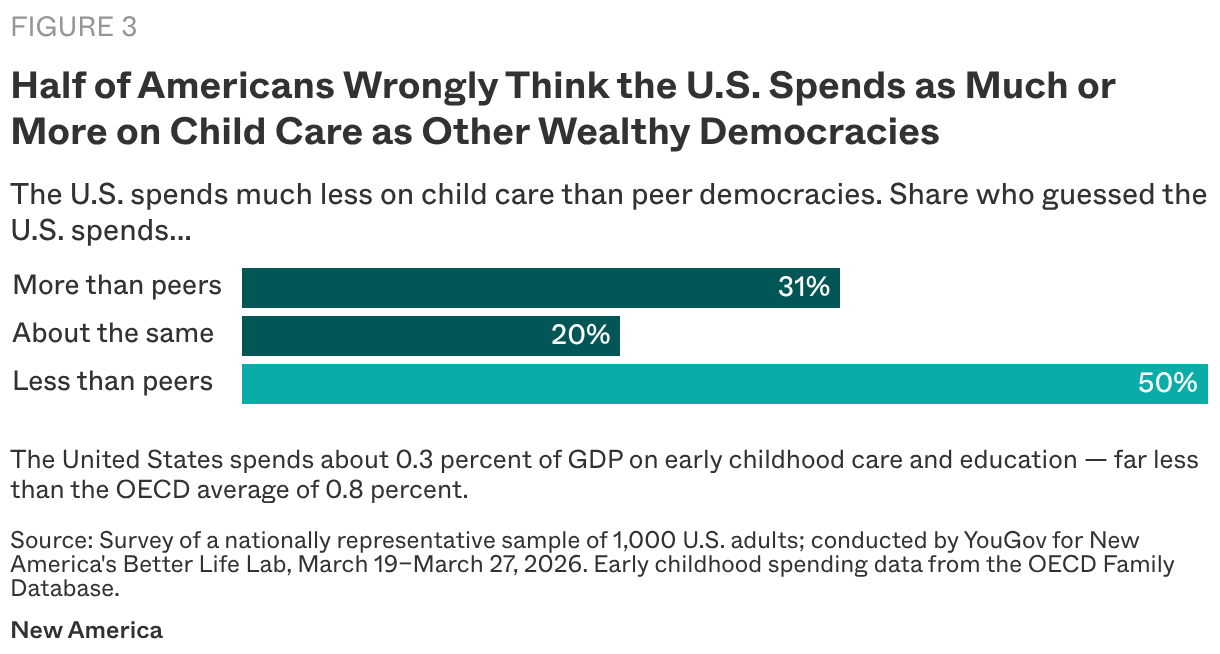
Half of Americans think the United States spends as much or more on child care as other wealthy democracies.
Perception: Half of respondents think the United States spends the same or more on child care: 31 percent think it spends more, and 20 percent think it spends about the same amount.
Reality: The United States spends far less on early care and education for 0 to 5 year olds than most peer countries, about 0.3 percent of GDP, with most of that going to kindergarten, compared to the OECD average of 0.8 percent. Norway spends nearly $30,000 per young child compared to the United States’ $500 per young child.
Most respondents acknowledge their knowledge gap, reporting little confidence in their cost-of-care estimates.
Child care: Most respondents (64 percent) say they are “not very confident” (45 percent) or “not at all confident” (20 percent) in their cost estimates.
Home care: Just over half (54 percent) of respondents say they are “not very confident” (37 percent) or “not at all confident” (17 percent). Only 9 percent say they are “very confident.”
Government Support Is Popular
A majority of Americans think the government should help families pay for care, but don’t understand what “universal child care” means.
-
81%
of Americans agree that government should help families in paying for child care
-
86%
of Americans agree that government should help families in paying for home care
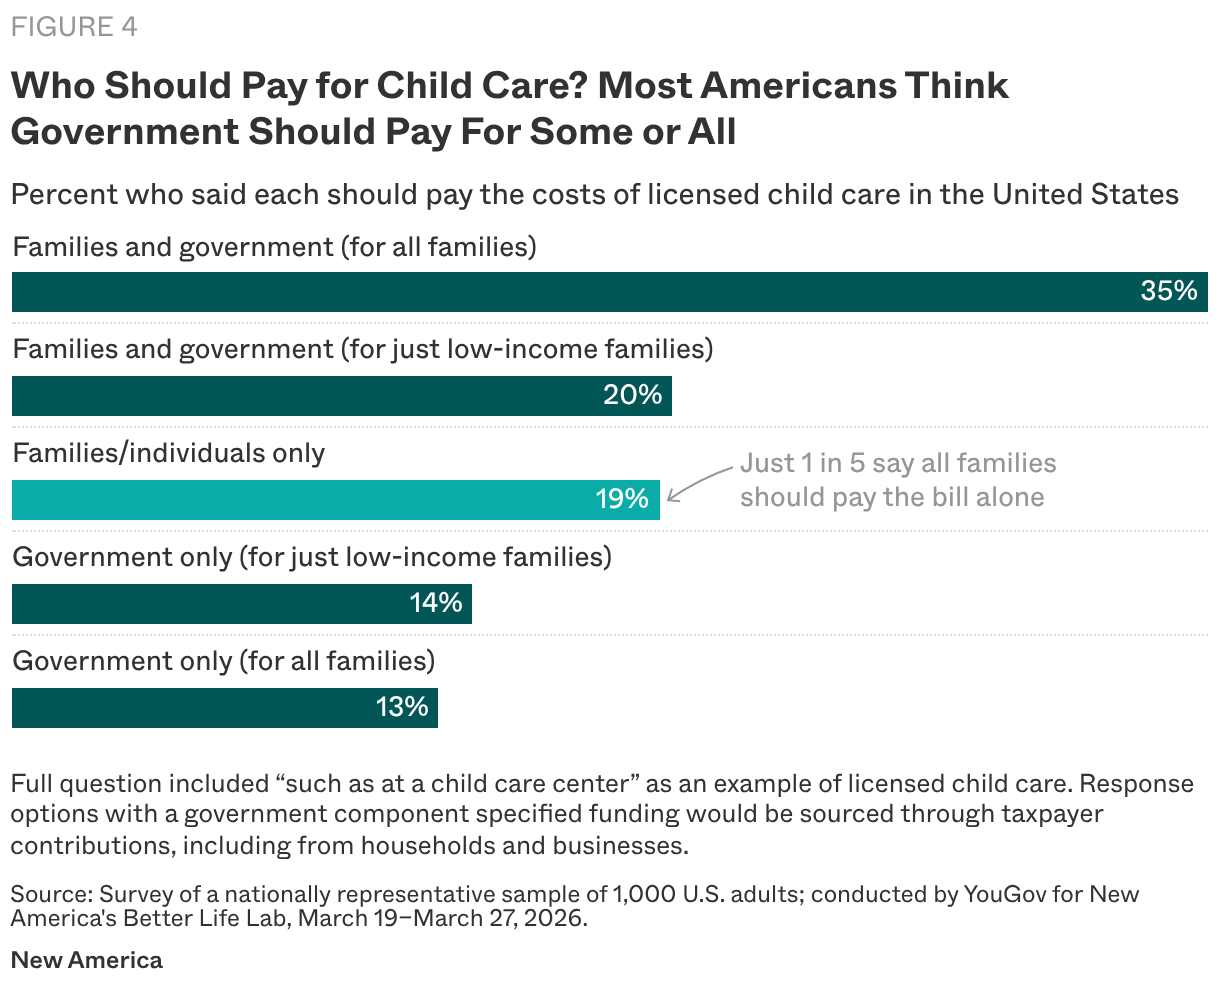
Most respondents don’t believe that families should foot the bill for care alone.
A plurality also says the government should help all families, not just those with low incomes as is currently the case.
Child care: Most respondents (81 percent) agree the government should play some role in helping families pay for child care, including 76 percent of conservative and 50 percent of very conservative respondents.
Home care: A large majority (86 percent) agree the government should play some role in helping families pay for home care, including 82 percent of conservative and 64 percent of very conservative respondents.
Most want some form of government responsibility to pay for care.
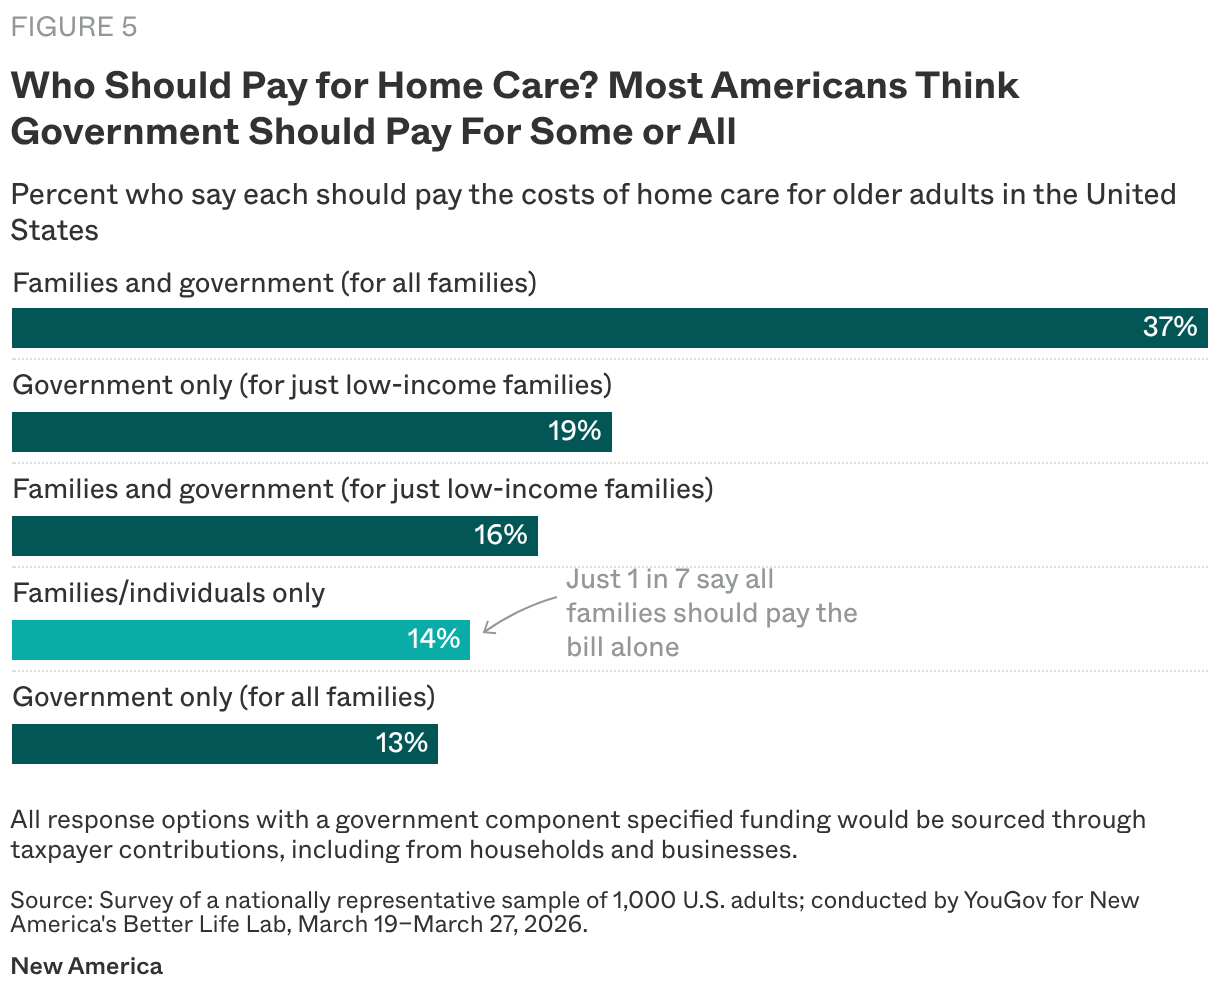
The most popular option among respondents was government support for all families, not just low-income families. Yet few support a government-only model to pay for care.
Child care: The plurality choice is a combination of family and government support for all families, with 35 percent choosing that option. Only 19 percent say the family alone should bear the burden. However, there is a stark divide on this issue based on political ideology. Only 4 percent of very liberal respondents prefer a family-only approach to paying for child care, compared to 24 percent of conservative respondents and 50 percent of very conservative respondents.
Home care: Among all ages, races, income and education levels, and political ideology, the most popular choice, supported by a plurality of respondents at 37 percent, is a combination of family and government support for all families. Just 16 percent support a combination of family and government support only for those with low incomes, as is the case currently with Medicaid. (Medicare generally does not cover home care, except in limited cases.) More than one-third of all conservative-leaning respondents—37 percent of conservative respondents and 34 percent of very conservative respondents—also choose the option of combined family and government support for all families. Older respondents over age 65 are more likely to choose this option, at 46 percent, as were women, at 42 percent compared to 33 percent of men. Of conservative respondents, 18 percent prefer a family-only approach to paying for the cost of home care, and this number rises to 36 percent for very conservative respondents.
Most Americans think the government should pay all family caregivers—not just those in low-income families who qualify for Medicaid.
However, with regards to child care, there is weaker support among respondents for paying parents, kin, or friends who provide care for children under the age of five.
Child care: The picture is mixed when it comes to Americans’ view of the government paying “stay-at-home” parents or “family, friend, and neighbor” caregivers for child care: Overall, more respondents are in favor of paying caregivers of adult kin (parents, grandparents, etc.)—with 40 percent agreeing versus 30 percent disagreeing. In contrast, respondents are slightly less likely to be in favor of the government paying stay-at-home parents, with 32 percent agreeing and 39 percent disagreeing. However, nearly a third of participants (31 and 30 percent respectively) respond “neither agree nor disagree” to both questions, suggesting a high degree of ambivalence. The questions on paying kin and stay-at-home parents also reveal significant subgroup differences. Younger Americans (18–44) are vastly more likely to support both ideas than older Americans, with 42 percent agreeing stay-at-home parents should be paid while only 18 percent of those aged 65 and older agree. On paying caregivers for adult kin in particular, Black respondents are much more likely than white Americans to support the concept; 52 percent of Black respondents back the idea versus only 37 percent of white respondents.
- 64% said that the government should compensate all family caregivers (not just low-income caregivers, as is currently the case)
Home care: Nearly two-thirds of respondents, 64 percent, say that the government should compensate all family caregivers, versus 36 percent who say compensation should only go to low-income family caregivers as is currently the case. More women than men think the government should support all family caregivers, 68 percent to 59 percent. More white and Hispanic respondents—67 percent and 64 percent respectively—agree compared with Black respondents, at 56 percent. (The sample size for Asian Americans was not large enough to make statements about that population.) And caregivers who frequently care for older adults are more likely to agree, 70 percent, compared to those who’d never cared for an older adult, 61 percent.
Most respondents support either the government covering all costs or the government and families splitting child care and home care costs.
Eighty-one percent of those respondents chose one of those options for child care and 85 percent for home care. A majority of the respondents who say the costs should be split believe the government should pay for at least half.
Child care: Most respondents (68 percent) who agree that the government should pay a share say that the government should pick up at least half the cost of child care, with only 18 percent saying parents should bear 70 percent or more of the cost.
Home care: An even larger majority (73 percent) of respondents who agree that the government should pay a share say the government should pay at least half the cost of home care, with 33 percent saying the government should pay for at least 70 percent of it. Just 15 percent say families should pay for 70 percent or more of the cost. On average, Hispanic respondents say the government should pick up 67 percent of the cost of home care and families should pay for 33 percent, compared to white respondents, who favor a 53-47 government/family split. Black respondents favor a 59-41 government/ family split. Democrats favor a 60-40 split, Independents a 56-44 split, and Republicans a 48-52 split.
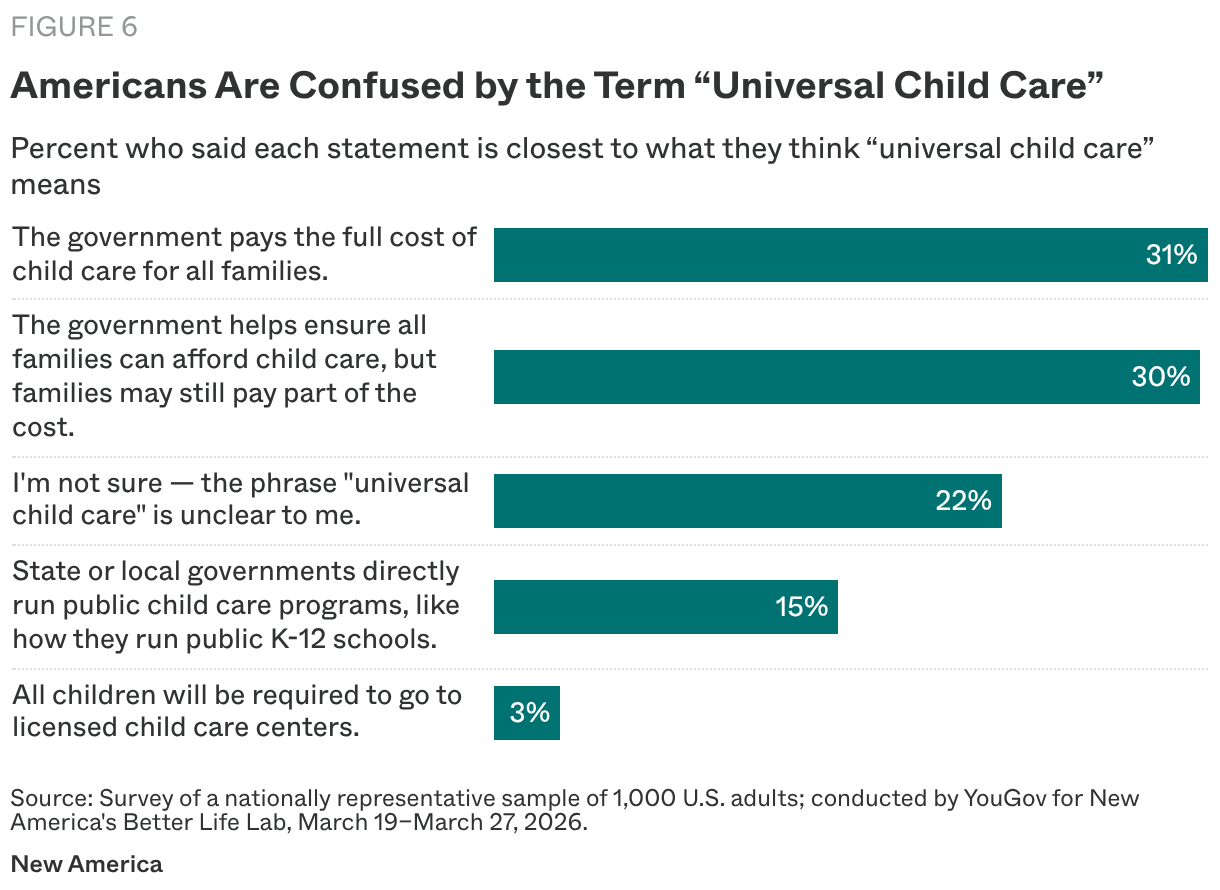
Americans are confused by the term “universal child care.”
- The most chosen definitions are “The government pays the full cost of child care for all families” (31 percent) and “The government helps ensure all families can afford child care, but families may still pay part of the cost” (30 percent). Other options chosen less frequently are that “State or local governments directly run public child care programs, like how they run public K-12 schools” (15 percent) and “All children will be required to go to licensed child care centers” (3 percent). Nearly a quarter (22 percent) of respondents say that they are unsure and that the phrase is “unclear” to them.
- This uncertainty may reflect the fact there is no one established definition of universal child care among politicians or the child care field. Some use it to indicate a fully free-to-families system, as in New Mexico, while others use it to indicate a system where everyone benefits but there is a sliding scale of parent co-pays, as in proposed legislation from Sen. Elizabeth Warren (D-Mass.) and Rep. Alexandria Ocasio-Cortez (D.-N.Y.). There is also no consensus about whether families should be eligible when all available parents are not working outside the home or in school.
Business Should Play a Role
A majority of Americans think business should play a role in supporting care, but don’t agree about what that role should be.
-
53%
believe businesses should be taxed to help pay for child care
-
44%
believe businesses should be taxed to help pay for long-term care for adults
Child care: Over three quarters of Americans, 78 percent, say businesses should play some role in child care. Of those who think businesses should play a role, a majority—68 percent—think that such a role includes paying taxes to improve child care provision for all families.
Home care: More than half of respondents, 59 percent, say business should have some role in helping families pay for long-term care for adults, either through paying taxes (15 percent), offering home care benefits to their employees (15 percent), or both (29 percent), with 20 percent unsure. Democrats showed the strongest support for a business role, at 73 percent, followed by 57 percent of Independents and 47 percent of Republicans. Those who provide care to older adults on a daily or near daily basis were also much more likely to support a business role, at 72 percent, than those who haven’t cared for an older person in the last year in the past year, at 53 percent.
Care Is Valuable, but Invisible
A majority of Americans see value in care, though care is still invisible for many and opinions vary significantly by demographic group, caregiving experience, and type of care.
Child care:
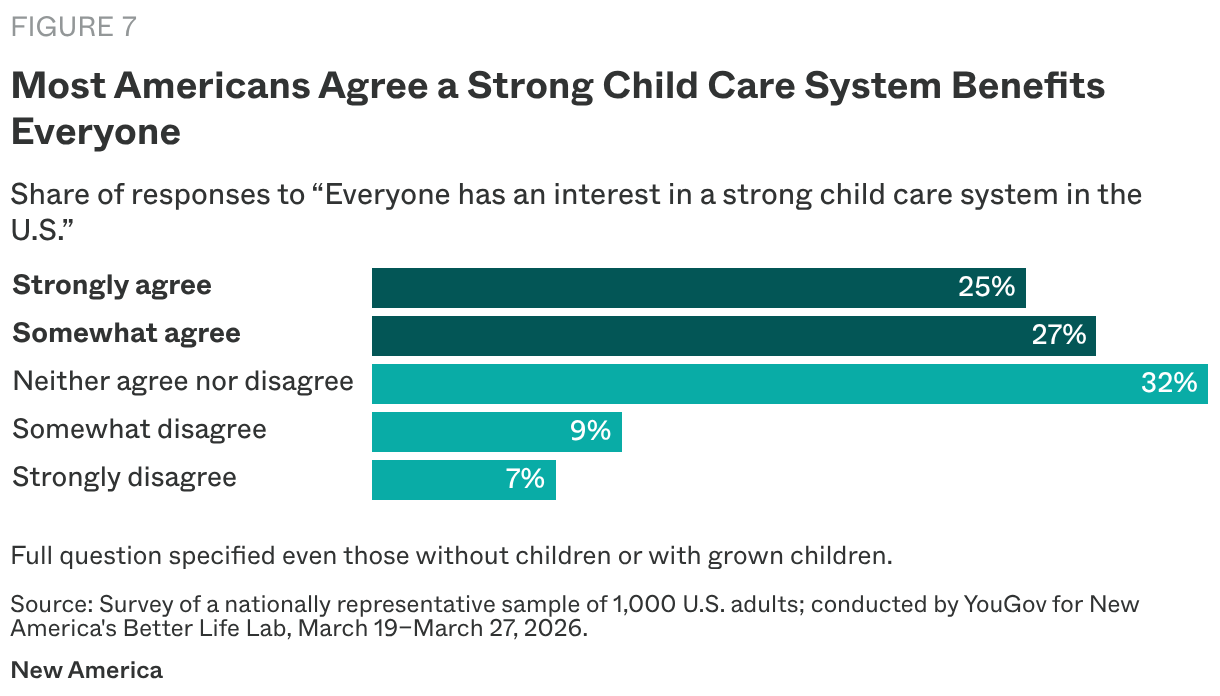
- While a slight majority of Americans (52 percent) agree that even those without children have an interest in a strong child care system, that only goes so far. When asked if K-12 public education should be a free, taxpayer-funded right, 60 percent of respondents agree (40 percent strongly agree and 20 percent agree, with another 25 percent neutral, 8 percent somewhat disagreeing, and 7 percent strongly disagreeing). But only 38 percent say the same of child care (17 percent strongly agree and 21 percent agree, with 31 percent neutral, 15 percent somewhat disagreeing, and 17 percent strongly disagreeing).
- There are differences by political ideology and age, with liberals, Democrats, and young people much more likely to think child care should be a right than conservatives, Republicans, and older people. However, support for child care as a right is significantly weaker on both sides of the political spectrum than is support for free K-12 education as a right. Whereas 81 percent of those who identify as very liberal strongly agree K-12 public education should be a right, only 48 percent strongly agree child care should be a right. On the other end of the ideological spectrum, 48 percent of very conservative individuals agree or strongly agree that K-12 education should be a right, while only 20 percent agree or strongly agree that child care should be a right.
Share, by political party identification, who somewhat or strongly agree child care should be offered to families for free, paid for by taxes, and considered a right:
-
57%
Democrats
-
31%
Independents
-
23%
Republicans
- Some of these opinions may be driven by a poor understanding of what goes on in child care settings: Only 18 percent of all respondents think math and science activities happen most days, and about a third, 36 percent, think literacy activities happen most days in infant/toddler classrooms (though half think read-alouds are common). In reality these basic educational activities occur often. With the exception of read-alouds, a similar number of people, 38 percent, think watching screens is happening regularly. In reality, research shows that over 90 percent of center-based toddler programs do daily reading and math activities, and many child care programs have no TV usage at all, with one study reporting an average of 12 minutes a day across licensed centers.
- When asked to rank the quality of child care programs in the United States on a scale ranging from 1 (very low quality) to 10 (very high quality), just over half of respondents (56 percent) rate the quality of U.S. child care programs between 6 and 10, with the average rating being 5.7, or just above the midpoint of the scale. A majority of ratings (56 percent) range from 4 to 6, showing a rather lukewarm public view of child care.
- That said, the public doesn’t think child care is a low-skill job. On a scale of skill required to be a child care teacher, with 1 being the least and 10 being the most, the average rating is 7.3 (in comparison, respondents on average say it requires a 8.2 level of skill to be a K-12 teacher).
Home care:
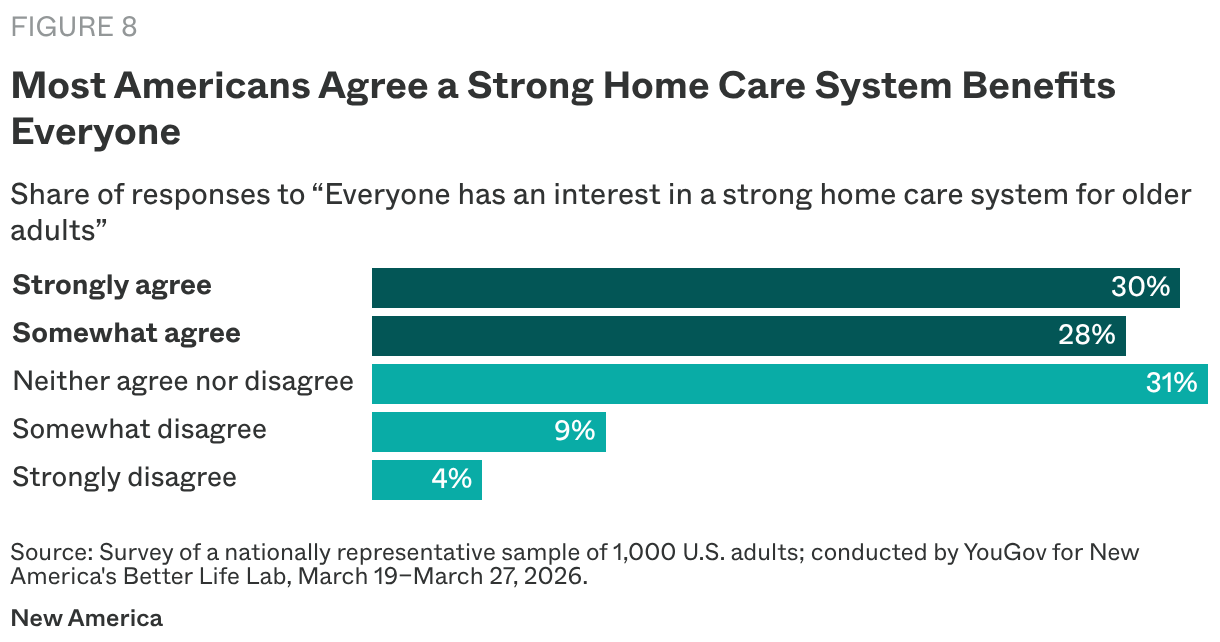
- Slightly more than half of respondents, 56 percent, agree or strongly agree that everyone has an interest in a strong home care system that enables people to age with dignity.
- Though 31 percent say they neither agree nor disagree, younger people show the most ambivalence, with 41 percent of those 18 to 29 years old neither agreeing nor disagreeing. In contrast, among the oldest respondents (65 years and older), 61 percent agree or strongly agree that a strong care system for older adults is in the best interest of everyone.
- More women, 33 percent, strongly agree than men, 25 percent.
- For a majority of Americans, home care is not a low-skill job. Respondents were asked to rate the skill required to provide home care to adults on a scale from 1 (the least skill) to 10 (the most skill).
- In contrast with the low pay it typically receives, only 5 percent of respondents rate home care work as a low-skill job, with a rating of 4 or less. Forty-three percent rate it a middle-skills job (5-7 on the 10-point scale) and 52 percent rate it at 8-10, equivalent to a high-skill job.
- Those giving home care the highest skill rating, 10, include more women than men, 21 percent to 14 percent respectively, and more Black respondents at 29 percent, compared to 13 percent of white, respondents and 20 percent of Hispanic respondents. Income shapes views as well, with 26 percent of workers earning less than $30,000 rating home care work as 10, highly skilled work, compared to 10 percent of those earning more than $100,000.
- Most Americans agree that it is difficult to find home care workers, with 43 percent rating it either moderately difficult (5 to 7 on a scale from 1 to 10) and 43 percent rating it very difficult (8-10 on the scale).
Political Action Is Lacking
Right now, care does not drive political action.
Child care:
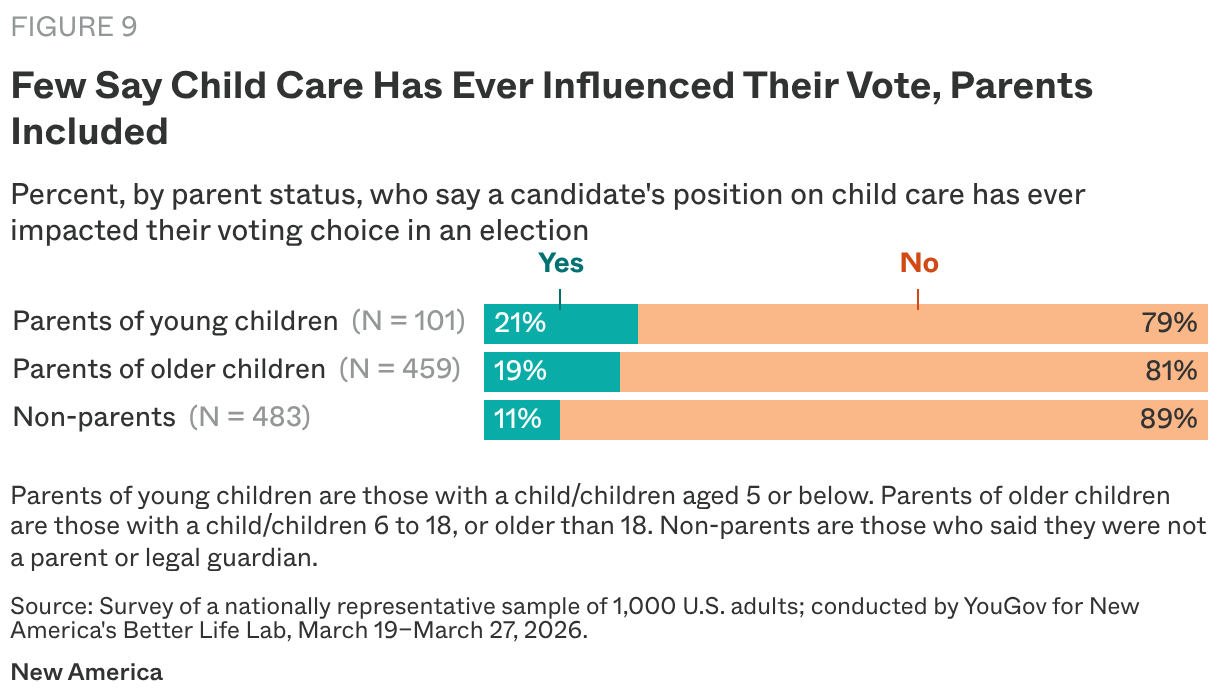
- Most respondents (85 percent) say that a candidate’s child care position has never influenced their vote, and only 5 percent have contacted an elected official regarding child care. Parents are more likely than others to say that child care has influenced their vote (21 percent for parents of children under five and 19 percent for parents of older children, compared to 11 percent for non-parents). Nevertheless, nearly 8 in 10 parents—the population most affected by child care policy—are not influenced by candidates’ positions on this issue.
- More parents of children ages five and under have contacted elected officials about child care (8 percent) than parents of older children (5 percent) and those without children (4 percent). Among parents of these young children who have not contacted an official about this issue, 41 percent give no reason, 19 percent say they didn’t know how to contact officials, and 23 percent say they didn’t feel comfortable doing so, with the remaining 17 percent giving a different reason.
- Open-ended comments provide texture to these numbers. Some common themes are typified by the responses, “I felt ignored when I did contact someone about my concerns,” “they don’t listen,” and “never thought about it.”
Home care:
- Only 4 percent of those surveyed say they have ever contacted an elected official about adult home care. Among the 96 percent who have never done so, 42 percent give no reason and 29 percent say the issue of home care doesn’t affect them personally. Even among those who provide care for older adults on a regular basis, just 10 percent say they’ve ever reached out to a policymaker.
- In open-ended written comments, some respondents explain that they’d never contacted policymakers because they feel their views don’t matter to policymakers. Some say the idea never occurred to them, while others that they have other pressing issues demanding their attention. Some signal resignation that the effort would not make a difference and that this is just the way things are. And some say they are too busy juggling care to make time for it.
- “I just did what needed [to be] done [for] my family. I guess I didn’t put much thought [into] the fact that the system could be [different].”
- “No time. Was providing home care for disabled older adult!”
- Two express conservative views that women should provide care, including: “If we can make it so a family can survive on one income, then the mother can provide care to elderly parents … exactly like we have done for a thousand years. Government just makes everything more expensive and lowers the quality of everything it touches.”
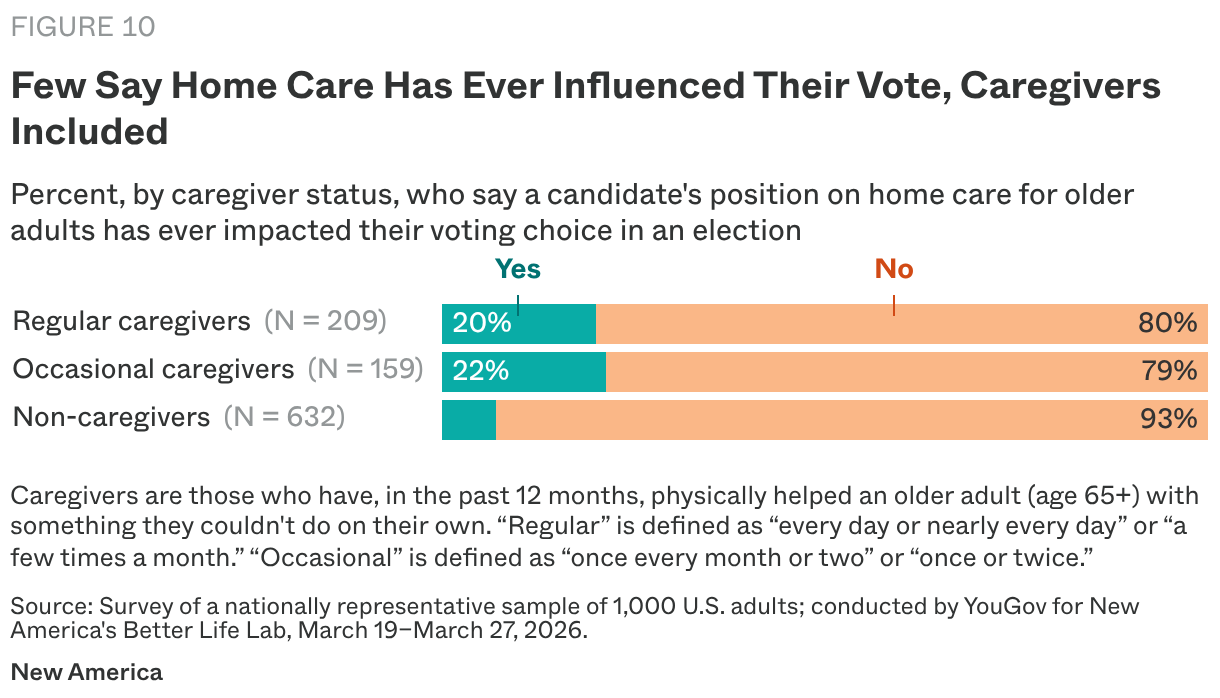
- For 88 percent of respondents, a candidate’s position on home care does not impact their voting choice. Those with a high school or less education are less likely to be swayed by home care, at 7 percent, compared to those with four-year college degrees or higher, at 15 percent. Similarly, Republicans and Independents are less likely to be moved by a candidate’s position on home care, 9 percent in each group, compared to Democrats at 20 percent. One in five respondents who have ever provided home care for older adults (20 percent of those who do at least monthly and 22 percent of those who do so less often) say a candidate’s position on home care influences their vote, compared to 7 percent who’ve never provided older age care.