Table of Contents
- Introduction
- Districts Shaped by Discrimination
- Understanding the Data
- National Findings
- Local Stories
- Divided Districts and Native Students
- A Future Not Determined by the Past
- Appendix A: 100 Most Segregating School District Borders by Difference in Poverty Rate
- Appendix B: 100 Most Segregating School District Borders by Difference in Percent Students of Color
- Appendix C: Segregating Borders by State
- Appendix D: Data and Methodology
National Findings
Economic Segregation and School Funding
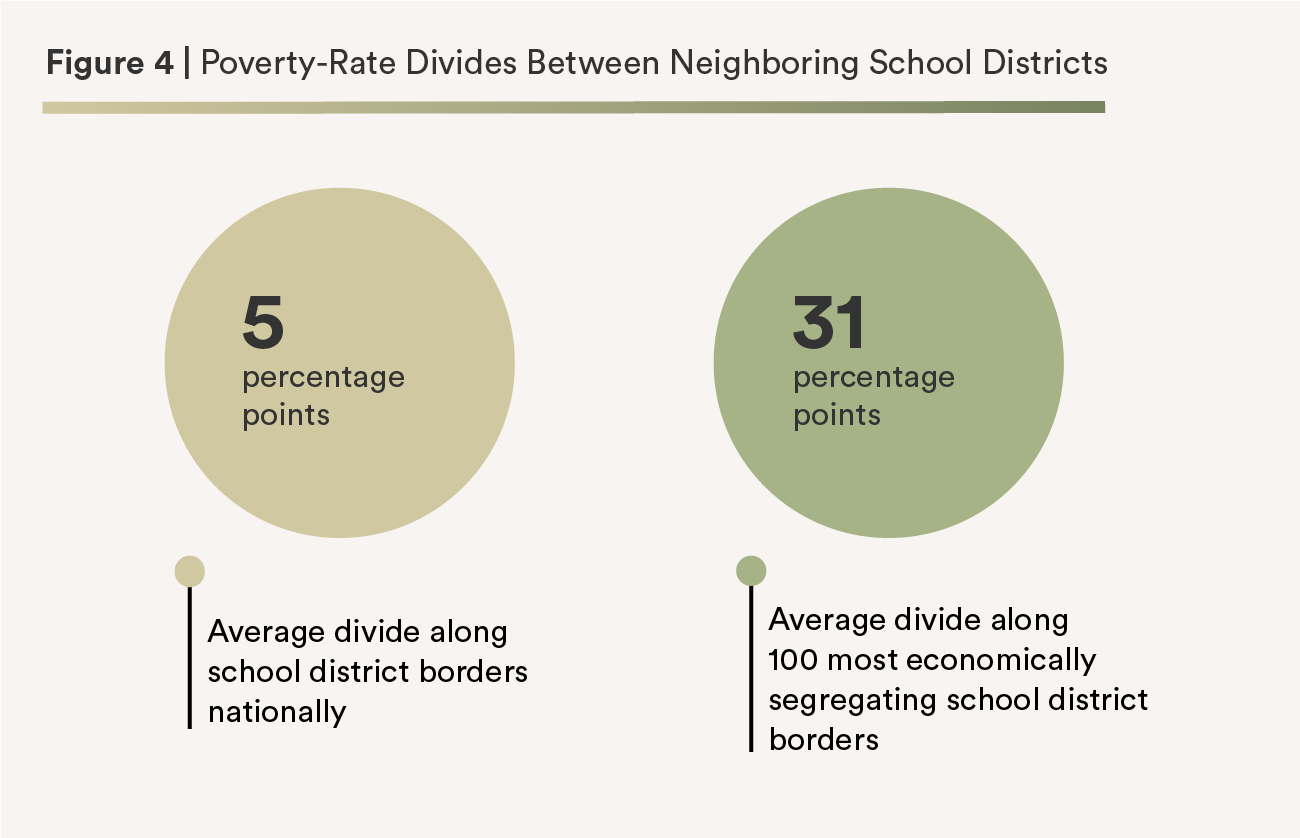
The average school district in the United States had a school-aged poverty rate of 15.8 percent in 2021, and the average border between two neighboring school districts in the United States marked a poverty-rate divide of 5.2 percentage points. However, along the 100 most economically segregating borders—those that create the greatest poverty-rate gaps—the average divide is a staggering 31 percentage points. (See Figure 4.)
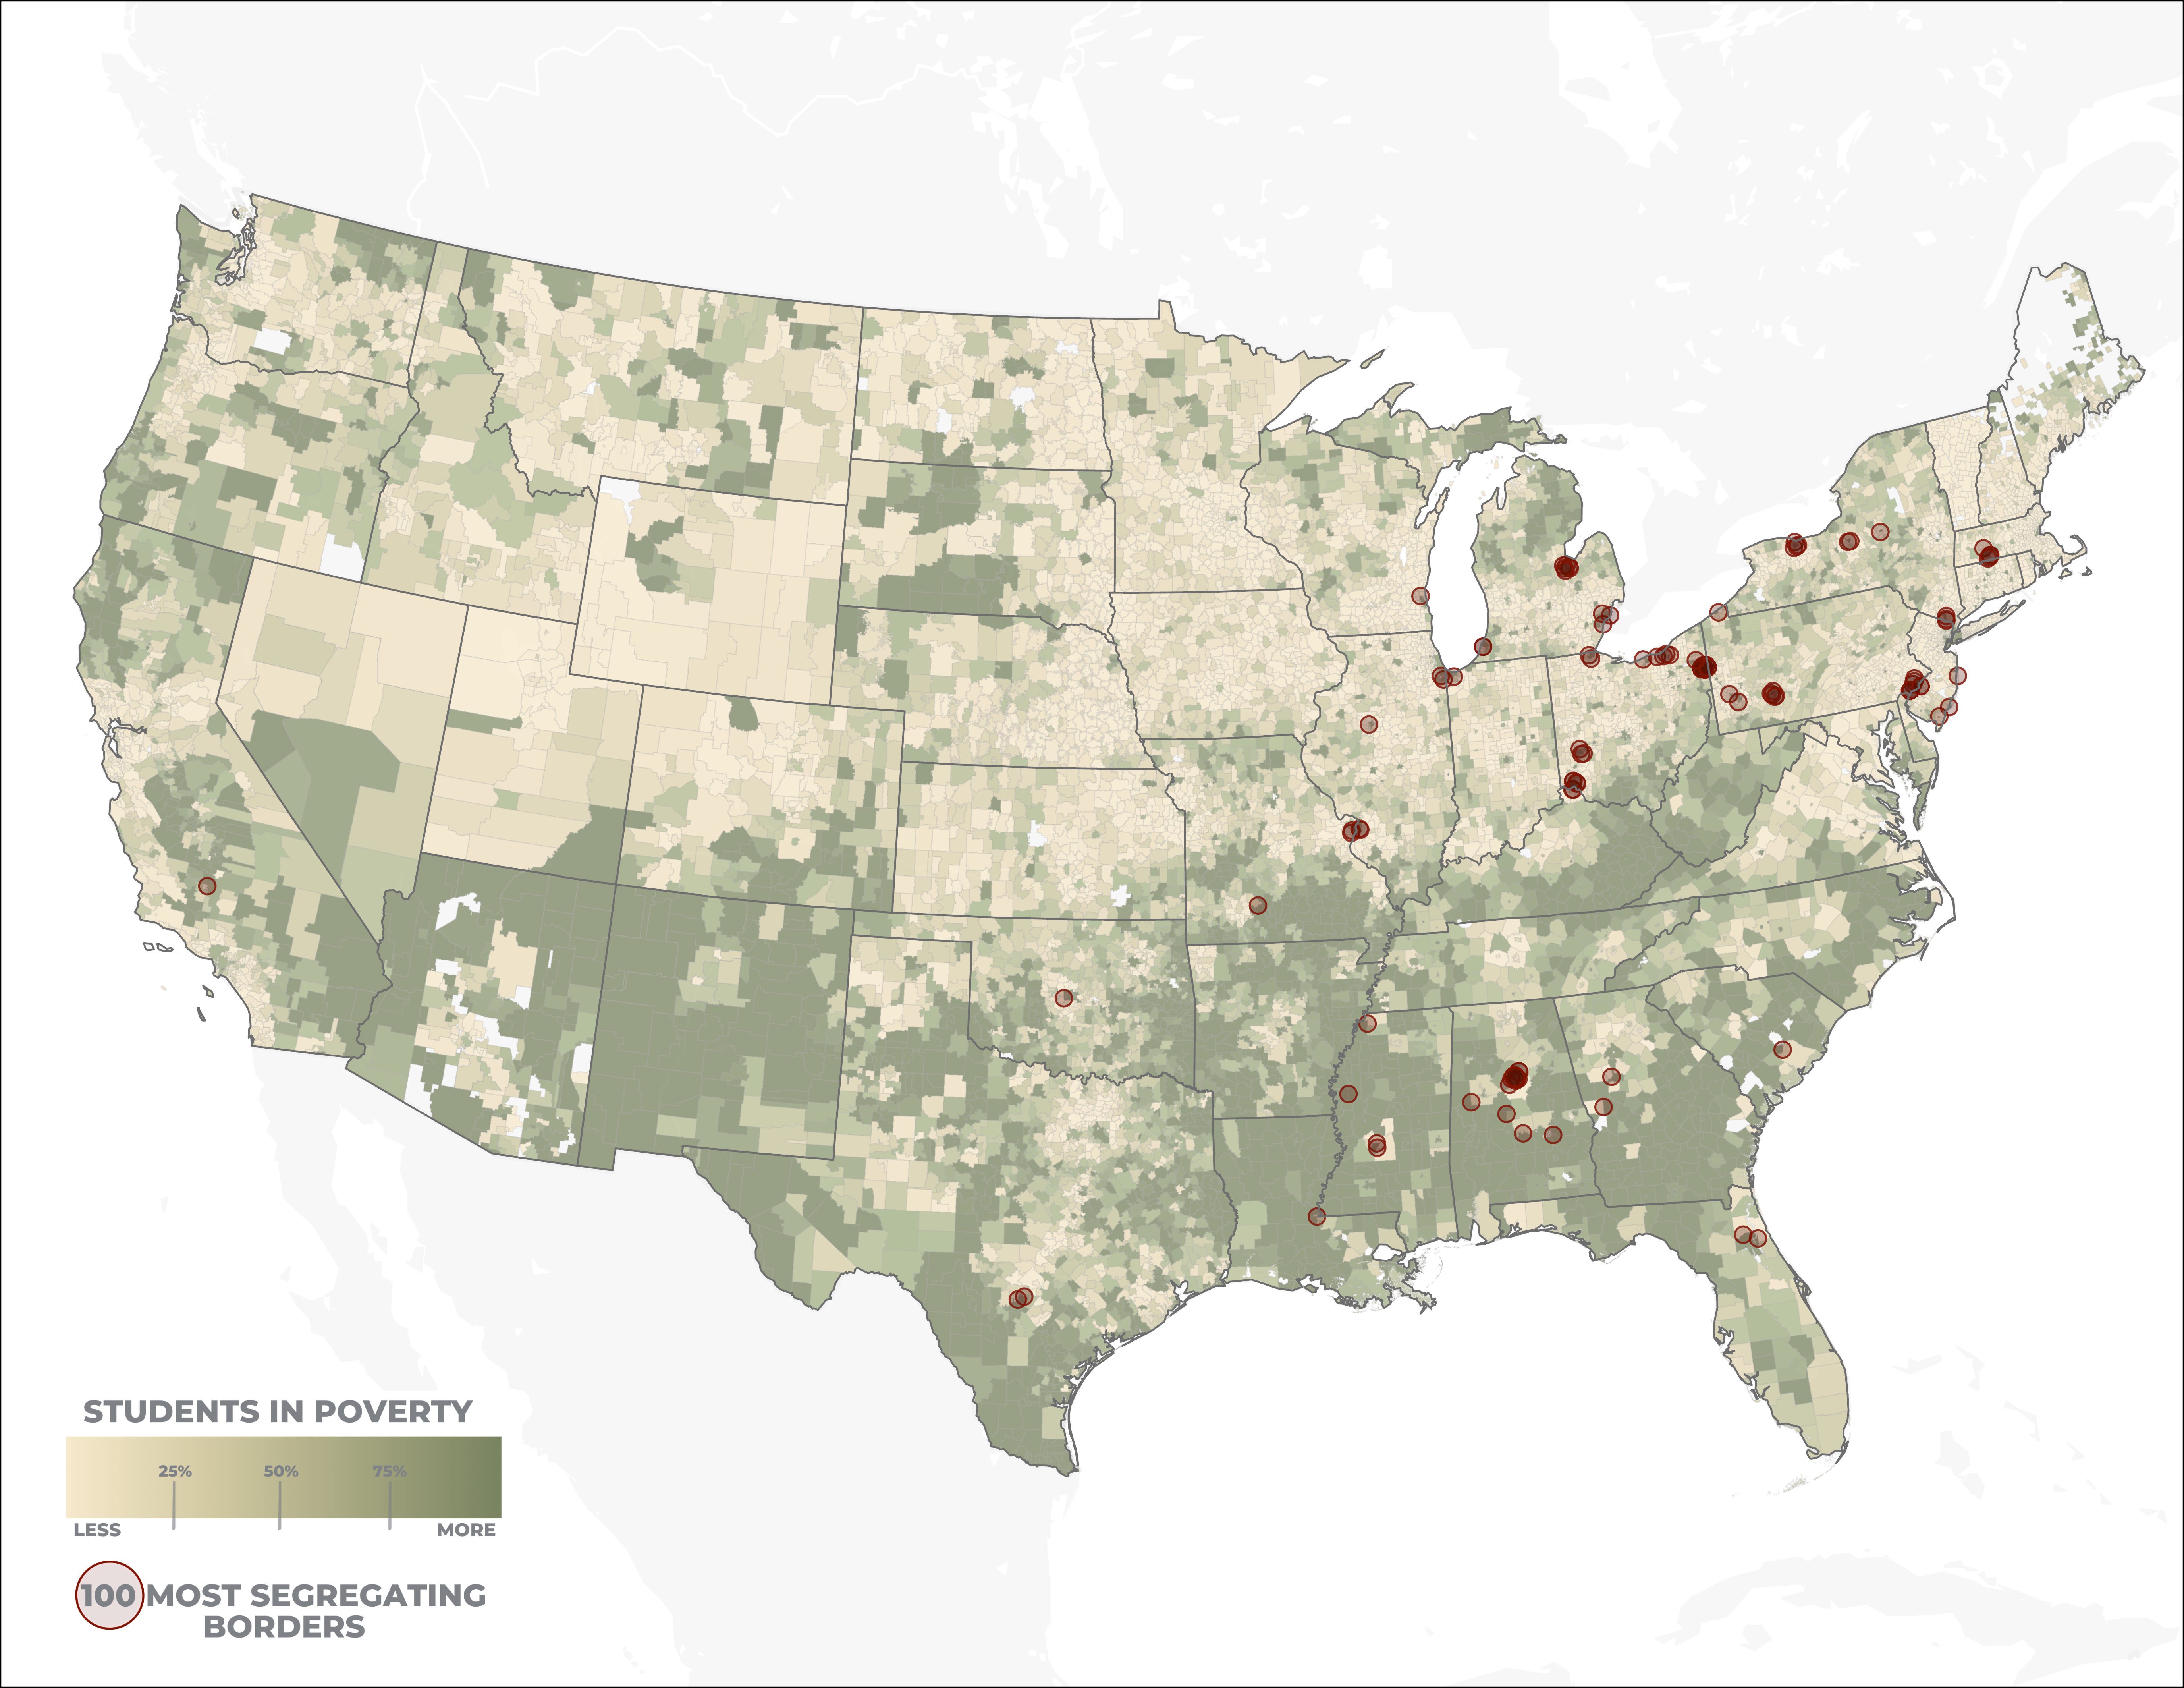
The disadvantaged districts have an average of 40.2 percent of school-aged children living in poverty, compared to a rate of 9.3 percent in more advantaged districts. See Figure 5 for a map of these 100 most segregating borders by poverty-rate difference. A full list of these borders and the districts they separate can be found in Appendix A.
The average poverty rate on the disadvantaged side of these borders, 40.2 percent, represents a tremendous depth of need. The income at the federal poverty line is quite low—just $21,960 for a family of three in 2021,1 less than a third of the median household income in the United States that year.2 For 40 percent of students to live below that threshold is devastating.
Unsurprisingly, school district borders that mark a wide poverty-rate divide frequently also separate districts with very different property values. National data are not available on assessed property values at the school district level, but state-specific data are illustrative of the connection.
In Connecticut, our analysis of town-level property assessment figures3 showed a strong, statistically significant relationship connecting the difference in poverty rates between two neighboring school districts to the difference in the value of their property tax bases. The larger the poverty-rate gap, the wider the divide in property value per student. Of the 45 Connecticut borders that mark at least a 15-point poverty rate difference between adjacent school districts, there is only a single instance where the higher-poverty district can draw upon even half the per-pupil property wealth of its more affluent neighbor.
Similarly, in Ohio, using state-reported property assessment data,4 we find a clear and highly significant relationship between two adjacent districts’ poverty-rate divides and their gaps in property value. And when Ohio district borders are ranked by the size of the poverty-rate gap they create, the most segregating quartile of borders marks an average difference of more than $52,000 in assessed value per pupil, while the average property-value gap along the borders in the least segregating quartile is smaller than $3,000 per pupil.
This pattern is not equally clear in every state. For instance, we find that the relationship between poverty-rate gaps and assessed-value differences is not statistically significant in Mississippi,5 perhaps because high poverty rates there are so common across school districts. But it is certainly the case that, across the country, larger poverty divides are frequently associated with bigger property-value disparities.
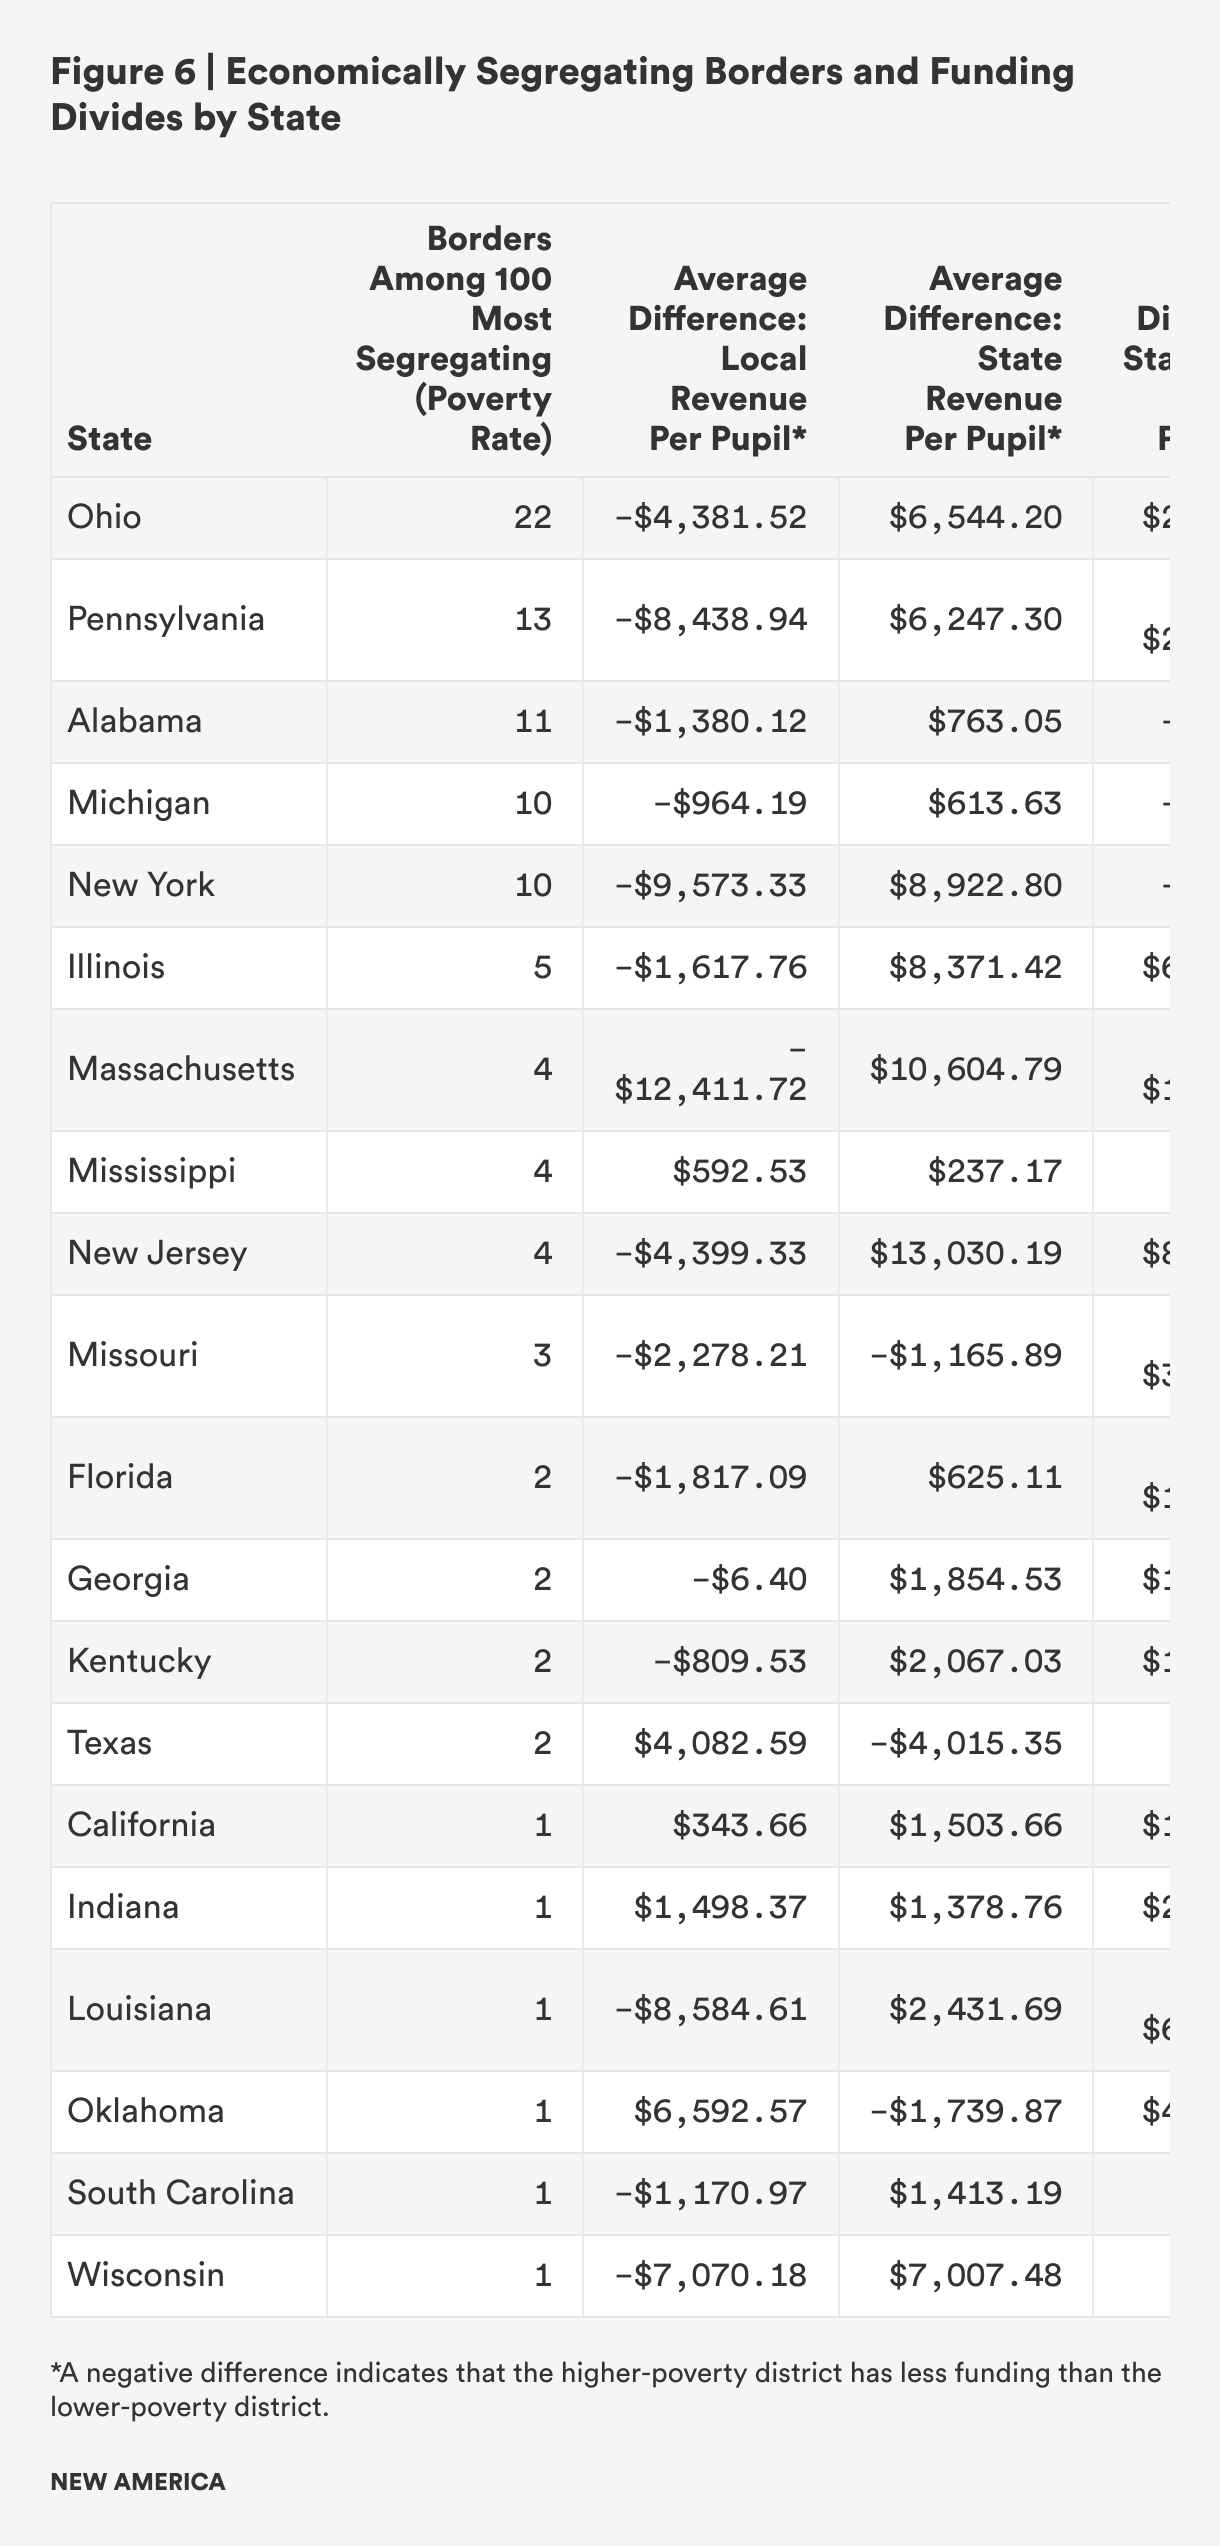
Given this connection, and because so much school funding is drawn from local property taxes, big divides in the school-aged poverty rate—and in property values—have the potential to mean big disparities in school budgets. Along the 100 most segregating school district boundaries by poverty rate, the average difference in local revenue between lower- and higher-poverty districts is $4,119.46 per pupil. This ground-level inequality places a huge burden on state budgets to close the gap. On average, they are barely managing to do so. Altogether, states are providing $4,758.51 more per pupil in aid to these higher-poverty districts, so that when state and local funding are added together, the higher-poverty districts have $639, or about 4 percent, more per pupil.6
This meager success does not represent a uniform effort on the part of all states. Instead, it is the average effect of wildly different state funding policies. The 100 most segregating borders in the country by poverty-rate difference were located across 20 states in 2021. Ohio was home to 22 of these divides, the greatest number of any state, but it did succeed at providing its high-poverty districts with enough state aid to offset their local-funding disadvantage. Once state and local funds were tallied, the higher-poverty districts on these 22 Ohio borders received 14 percent more per pupil than their lower-poverty neighbors. In New Jersey, which contains four of these borders, the higher-poverty districts on the list received 37 percent more per pupil. In Illinois, which is home to five such borders, that figure is 49 percent more. But these progressive allocations were counterbalanced by troubling numbers in other states. Pennsylvania contains 13 of these most segregating borders; the districts disadvantaged by those borders received 11 percent less in state and local funding per pupil. Alabama has 11 pairs of neighboring districts ranked among the most economically segregating, and the higher-poverty districts of these pairs received 5 percent less per pupil, on average. Along Massachusetts’s four ranked borders, the disadvantaged districts received an average of 9 percent less per pupil. (See Figure 6 for a list of these funding differences for all states with borders in this ranking.)
Ultimately, in 9 of the 20 states represented on this ranking, the higher-poverty districts were on the losing end of a funding divide.
"Having allowed economic chasms to open between neighboring districts, too many states were not up to the task of filling the gap."
Another View: Economic Segregation Measured by Median Household Income
Some regions where incomes are higher overall are less likely to see wide poverty-rate divides, because fewer people fall below the very low federal poverty threshold. Many families, however, still struggle within their local economic contexts even if their earnings place them above the poverty line.
Similarly, many school district boundaries create severe economic segregation by separating lower-income communities from ones that are especially well-off. We can see this by examining disparities in median household income instead of disparities in poverty—specifically, the ratio of the median household income of one school district to that of the school district next door. Along the 100 most segregating borders by this metric, the average more advantaged school district has a median income nearly three times that of the less advantaged district. Across all 100 of these district pairings, the ratio is never lower than 2.5 to 1.
When school district borders are ranked by the divide they create in median household income levels, certain regions that are less represented on the national poverty-rate segregation map above—for instance, California and several northeastern states, especially Connecticut and northern New Jersey—appear as home to many of the most income-segregating borders. The most segregating border in the country by this measure separates New Jersey’s East Orange City School District, where the median income is $54,520, from Glen Ridge Borough School District, where that income level is almost four and a half times as high, at $243,899.
Figures 7 and 8 below show the borders in regions that are among the 100 most segregating by median household income, a form of segregation between districts that carries tremendous implications for property value and school funding disparities.
"High-wealth regions should not escape notice simply because their deepest divides occur between communities that live above the poverty line."
The higher-income districts in these states are often able to raise and keep astronomical amounts of property tax revenues for their schools, creating huge resource disparities with their less-advantaged neighbors. These divides are certainly worthy of policy attention.
Racial Segregation and School Funding
American school districts serve a very diverse population. Nationwide, 53 percent of public-school district enrollees are students of color, including 14 percent Black students, 28 percent Latino students, and 5 percent Asian students, among others. However, these students are highly concentrated in a relatively small number of districts. Forty-six percent of students of color are enrolled in just 1 percent of all school districts. Meanwhile, 26 percent of school systems serve student populations that are more than 90 percent white.
The average district border included in our analysis separates districts that are 14 percentage points apart in their proportions of students of color. But more severe segregation is not rare. Nearly 20 percent of borders between neighboring districts mark a 25-percentage-point difference in the enrollment of students of color. Along the 100 most racially segregating school district borders in the country—those that create the greatest divide between neighboring districts in the proportion of students of color enrolled—the separation is, on average, between a district that 92.4 percent white and a district that is 86 percent students of color. (See Figure 9.)
See Figure 10 below for a map of these 100 most racially segregating borders. A full list of these borders and the districts they separate can be found in Appendix B.
Like districts serving more students in poverty, those serving more students of color are likely to face the challenge of lower property values. In the absence of national data on property valuation by school district, state-specific analysis can again prove useful. In Connecticut, our analysis of town data on property assessment7 shows a clear, statistically significant relationship between the gap in racial composition between neighboring districts and the difference in their property wealth levels. Even along borders with a racial difference of 10 percentage points or smaller, the districts serving more students of color have lower property valuations per pupil, by just under $175,000. And where the border marks a racial difference of 50 percentage points or more, the disparity is far more extreme. The district with a higher proportion of students of color has almost $675,000 less in per-pupil property value, on average. The wider the racial chasm, the bigger the difference in property tax capacity.
Connecticut is home to some particularly stark divides, but this problem is present across a number of other states for which data were available. We found statistically significant relationships between neighboring-district racial differences and property value disparities in Arkansas and Ohio (which each have nine of the country’s most racially segregating school district borders), and Mississippi (which has five).
This problem is directly attributable to America’s history of racist policies and practices in the area of housing. The economic and racial segregation of neighborhoods, cemented through the decades of U.S. housing policy, has led to lower property values in communities of color. Since explicitly and implicitly racist policies placed homeownership out of reach for many Black and Latino families for an extended period in the 20th century, these communities were largely denied the opportunity to build wealth in their homes in the way that many white families did in the 1940s and 1950s, a problem that still shapes neighborhoods today.8
This is not to say that residential patterns have remained unchanged since the days of redlining; populations have certainly shifted over time, and suburbs especially have become steadily more diverse, with the 2020 census counting 45 percent of suburbanites as people of color.9 But the effects of discriminatory policies have persisted. Past exclusion from housing markets prevented many families of color from building home equity, which is the predominant means of wealth-building for American middle-class households.10 Parents of color have been less able to pass on less in inherited wealth,11 creating barriers for members of the next generation as they seek to establish themselves as financially secure homeowners, continuing the cycle. In 2020, three economists published an examination of newly compiled historical data on household-level finances in the U.S. that found that wealth inequality between Black and white households had not narrowed at all in the seven decades following the Second World War.12
This has led to a wide racial disparity in homeownership today. The overall homeownership rate in the U.S. (that is, the percentage of housing units in the U.S. that are owner-occupied) is 65 percent, with white homeownership at 73 percent and Black homeownership at 43 percent.13 Even today, neighborhoods that were historically redlined have dramatically lower home values than areas that were deemed less “hazardous.”14 Further, homes in present-day Black neighborhoods are consistently valued less than homes in non-Black neighborhoods, by roughly 21 to 23 percent, according to one study.15 The ongoing devaluation of Black-owned homes adds up to billions of dollars in lost wealth.
When school district boundaries are drawn narrowly around communities that are predominately white or non-white, the divides in property wealth translate into unequal ability to raise property tax dollars for schools. Along the 100 most racially segregating school district boundaries, this is indeed the case. On average, the districts serving more students of color collect $2,222.70 less in local revenue per pupil than the predominately white districts across these borders. This puts an expensive responsibility before states to compensate for these ground-level inequalities so that students of color do not lose out. In the aggregate, state aid is indeed making up the difference. The districts serving more students of color are receiving $3,310.59 more in state funding per pupil, so even after the lion’s share of that money is poured into the local revenue gap, these districts receive $1,087.89 more per pupil in state and local funding combined.
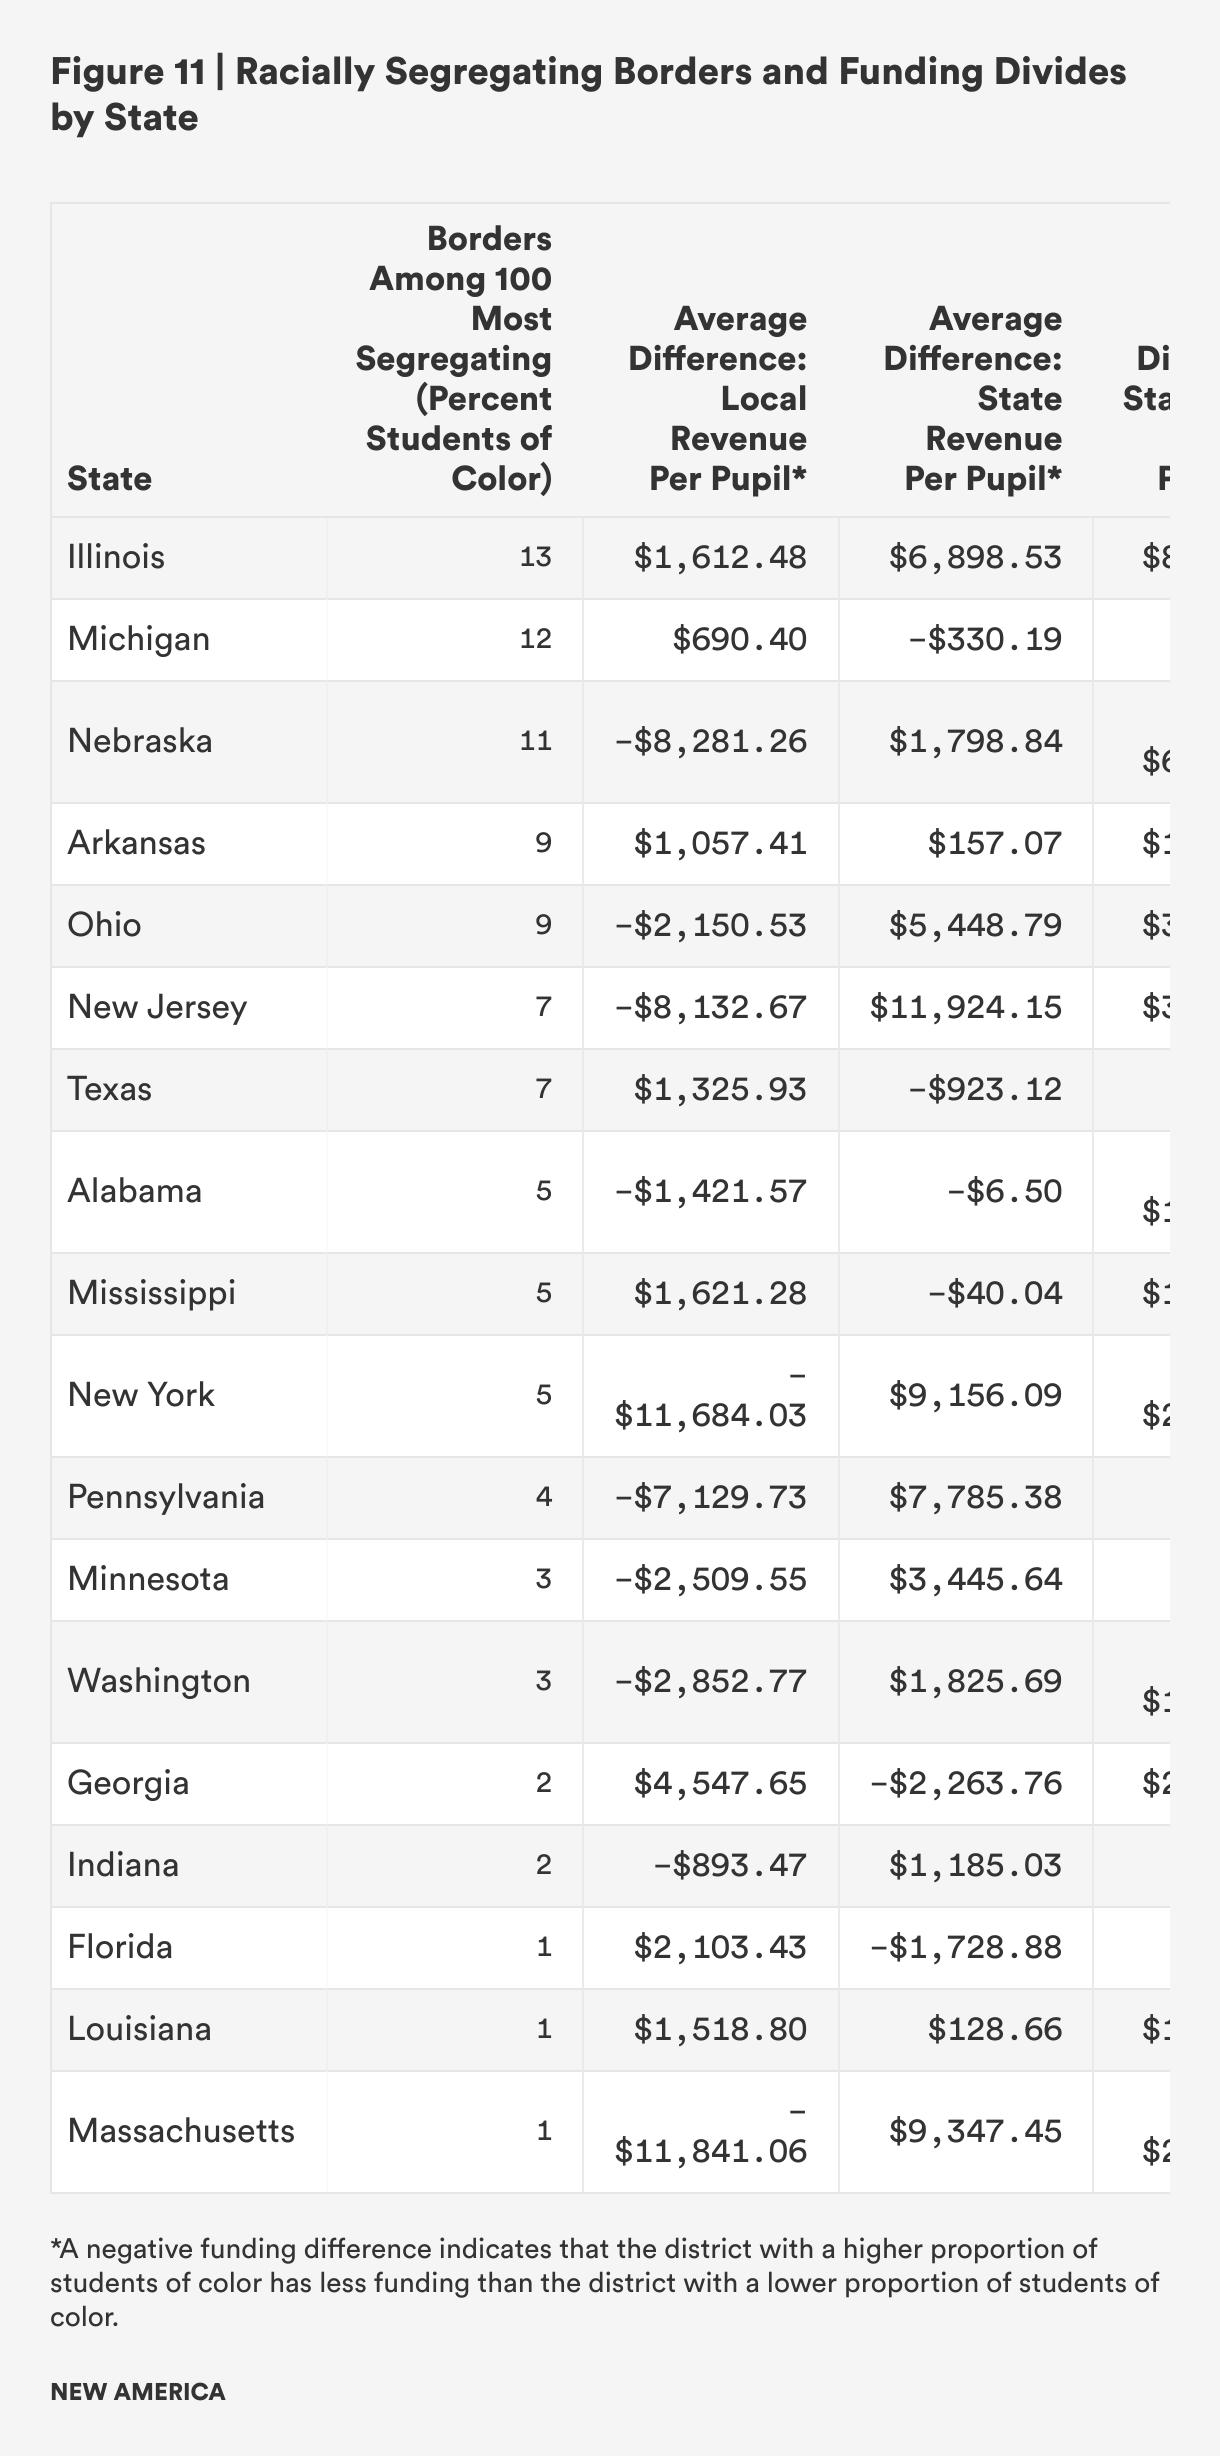
Not all states have met this challenge, however. The nation’s 100 most racially segregating school district borders can be found in just 18 states. Along these borders, the district serving more students of color receives less state and local funding than its predominately white neighbor district in five states. Thankfully, this is a minority of states. Still, the funding data in some of those states tells a worrying story. Nebraska is home to eleven of these most segregating borders and the pairs of districts they separate. Among these districts, on average, the ones serving more students of color raise almost $8,300 less per pupil from local sources than their neighbor-districts. The state funding system in Nebraska provides only $1,800 more to these districts in state aid per pupil on average, less than a quarter of what is needed to make up the deficit. New York, where there are five of these school district borders, the districts serving more students of color along these borders raise almost $11,700 less in local revenue per pupil than their neighbor-districts on average. New York compensates with over $9,100 more per pupil in state aid to address the funding gap, but those districts serving more students of color still wind up $2,500 per pupil behind their neighbors, on average. (See Figure 11 for a list of these funding differences for all states with borders in this ranking.)
Even in states where the funding gap across these borders does not disadvantage students of color, the story is not all good. For example, Pennsylvania just manages to mitigate the disparities caused by unequal local revenue. The state contains four of the country’s most racially segregating borders, and when all state and local dollars are totaled, the districts serving more students of color along these borders have slightly more (by almost 4 percent) than the districts serving fewer. But these school systems start out over $7,100 behind in local revenue per pupil. To achieve parity, the state must then muster huge amounts in aid funding for the districts on the wrong side of these lines. This reveals the nonsensical foundation of Pennsylvania’s state funding policies, along with those of most other states. This is a state whose funding system was recently found unconstitutional, in part because of the funding disparities created by unequal property tax receipts.16 The state was ordered to increase support for underfunded districts. But
"Why should Pennsylvania, or any state, start its schools on such unequal footing and then have to work so hard to fill these gaps? Why not construct a school funding system that is fair from the start?"
Citations
- ASPE, “2021 Poverty Guidelines.”
- U.S. Census Bureau, “Income in the United States: 2021.”
- Connecticut Open Data, “Equalized Net Grand List by Town (2011-2021 GL),” updated July 20, 2023, source This analysis is made possible by town-to-district conversion guidance by The School and State Finance Project, Hamden, CT. Further description is found in data and methods appendix.
- “SD-1: Number of Taxable Property Values by School District, Taxes Levied and Tax Rates for Current Expenses, and Average Property Values per Pupil (DTE13/DTE14),” Ohio Department of Education, source.
- 2020-2021 Superintendent’s Annual Report, “District Assessment and Tax Levies,” Mississippi Department of Education, source.
- Whether this very slight progressivity is actually enough to account for the increased needs of students in poverty is another matter. There is a broad consensus among school funding researchers and policy experts that students with greater needs should be supported with commensurately greater funding. See, for example, Danielle Farrie and Robert Kim, Making the Grade 2023: How Fair Is School Funding in Your State? (Newark, NJ: Education Law Center, December 11, 2023), source; Bruce Baker, Matthew Di Carlo, and Mark Weber, The Adequacy and Fairness of State School Finance Systems (Washington, DC: Albert Shanker Institute, University of Miami School of Education and Human Development, and Rutgers Graduate School of Education, January 2024), source; Matthew Chingos and Kristin Blagg, Do Poor Kids Get Their Fair Share of School Funding? (Washington, DC: Urban Institute, May 2017), 2, source; and Ivy Morgan, Equal Is Not Good Enough: An Analysis of School Funding Equity Across the U.S. and Within Each State (Washington, DC: The Education Trust, December 2022), 2, source
- Connecticut Open Data, “Equalized Net Grand List by Town.”
- Dedrick Asante-Muhammad Jamie Buell Devine Joshua, “60% Black Homeownership: A Radical Goal for Black Wealth Development,” NCRC (National Community Reinvestment Coalition), March 2, 2021, source.
- William H. Frey, Today’s Suburbs Are Symbolic of America’s Rising Diversity: A 2020 Census Portrait (Washington, DC: Brookings, June 15, 2022), source.
- Moritz Kuhn, Moritz Schularick, and Ulrike I. Steins, “Income and Wealth Inequality in America, 1949–2016,” Journal of Political Economy 128, no. 9 (September 1, 2020): 3469–3519, source, 3471.
- Christian E. Weller and Lily Roberts, Eliminating the Black-White Wealth Gap Is a Generational Challenge (Washington, DC: Center for American Progress, March 19, 2021), source.
- Kuhn, Schularick, and Steins, “Income and Wealth Inequality in America, 1949–2016,” 3500.
- United States Census Bureau, “American Community Survey Data, 5-year estimates, 2017-2021” Census.gov, August 16, 2023, source.
- Sarah Mikhitarian, “Home Values Remain Low in Vast Majority of Formerly Redlined Neighborhoods,” Zillow, April 25, 2018, source.
- Jordan M. Fields, Andre M. Perry, and Manann Donoghoe, How the Property Tax System Harms Black Homeowners and Widens the Racial Wealth Gap (Washington, DC: Brookings, August 22, 2023), source.
- Zahava Stadler, “Powerful Pennsylvania Ruling Sets a New Standard for School Funding,” EdCentral (blog), New America, February 22, 2023, source.