
Leslie Villegas
Senior Policy Analyst, Education Policy

Linguistically diverse children enrolled in public school in the United States are screened and assessed to determine if they need additional language support to engage academically. Students who fall below their state’s English proficiency threshold are classified as English learners (ELs), and in order to exit this group, they must meet their state’s criteria for reclassification. The reclassification process varies from state to state, yet, few comprehensive resources explore EL reclassification policies and trends from a national vantage point.
New America conducted a national scan of state-level EL reclassification policies and trends between 2018—the first full year the Every Student Succeeds Act (ESSA) was implemented1—and 2025. The two briefs in this series provide information about how reclassification policies have changed, trends in reclassification rates, and how states compare with each other. We hope this information will be useful to policymakers as states hone their reclassification processes.
This second brief offers an account of how many EL students have reached states’ reclassification standards during this time. We focus on two questions:
On its face, a reclassification rate represents the percentage of ELs that met their state’s requirements to exit EL classification. This rate is calculated at the school, district, and state level based on how students perform on the English language proficiency (ELP) assessment, and whether they meet any additional criteria, when required. However, this rate represents more than just a number. It also reflects the characteristics of the EL student population, the educational services they receive, and the criteria used to determine reclassification.
ELs are a heterogeneous group of students. Factors that contribute to the number of students that can reasonably be expected to reclassify any given year include the age of the EL population (e.g., Are they concentrated in elementary, middle, or high school grades?), the amount of time students have been enrolled in a U.S. school (e.g., Have the majority of students been enrolled since kindergarten, or have they recently arrived in the U.S.?), students’ level of English proficiency (e.g., Are they concentrated in the beginning, intermediate, or advanced proficiency levels?), and the presence or absence of a large newcomer population in the community (e.g., Are there older students with lower English proficiency levels?).
The educational opportunities that ELs have access to also influence reclassification. These opportunities are shaped by the model of instruction used, such as English as a second language, bilingual programs, or sheltered English immersion.2 Research has long shown that students do better in the long run, both academically and linguistically, in bilingual programs,3 though bilingual teacher credentialing across the country varies greatly4 and there is a national shortage of bilingual teachers.5
The level of training and support teachers receive also matters. For most teachers, that training is hard to come by. Education Week found that fewer than half of the 874 educators it surveyed in a nationally representative poll in 2025 felt like the instruction and professional development they received adequately prepared them to meet ELs’ academic and linguistic needs.6
Schools, districts, and states that do not provide ELs with a robust instructional program—regardless of the approach chosen—and which do not invest in a qualified teacher workforce for these students will inevitably see this lack of investment reflected in the form of students who do not exit services at the developmentally appropriate time.
State reclassification policy can be thought of as a sieve that sorts through the EL population to let some students through while keeping others back. However, not all states use the same sieving tool. Some have bigger, more lax holes, and others have tools with much tighter mesh. The mesh here is comprised of not only different reclassification policies, but also different methodologies used to calculate annual statewide reclassification rates. These complicating factors mean that a reclassification rate in one state can mean something different in another.
A high reclassification rate should not signal that a state (or district or school) is doing a good job of serving ELs. What matters more is how students fare academically after reclassification: High exit rates are not useful if students go on to struggle academically without language support services. This is why federal law requires districts to monitor academic progress for ELs between two and four years after they exit.7 If students backslide during this monitoring, schools and districts can offer support to get them back on track without needing to return to EL status.
There is a dearth of information about what a “normal” or “expected” annual reclassification rate looks like. However, a report published by the Migration Policy Institute in October 2025 said that a statewide reclassification rate between 14 and 20 percent could be considered “in line” with the research-backed expectation that students take five to seven years to become proficient in English.8 Although this research offers ballpark guidance, each state’s target reclassification rate range depends on the characteristics and makeup of its own EL population. One component of the analysis that follows includes an examination of how states are measuring up to this 14 to 20 percent range.
We separated states based on the ELP assessment used and the three basic reclassification policy characteristics listed here:
Separating states into these categories makes it easier to observe and compare trends between states with similar policies. This analysis includes 50 states and the District of Columbia. Ten states had reclassification data gaps for one or more years analyzed and were excluded where applicable.9 (See here for more on our methodology and Table A in the appendix for data collected for all states.)
COVID-19 Data Gaps
Data for 2019–20 and 2020–21 were excluded from this brief because of the interruptions caused by the COVID-19 pandemic. These years are greyed out on any data visualizations tracing reclassification rates over time. Additionally, given the significant amount of time that these data gaps represent, data points plotted for 2018–19 (the baseline) are not connected to data points plotted for 2021–22 (the first post-COVID year with available data). This was done out of precaution because there are simply too many unknowns about EL assessment and reclassification during the missing years to suggest a direct (linear) path between 2018 and 2021.
In 2025, 36 states10 used the WIDA ACCESS to assess ELs’ language proficiency. There are two obvious trends in these states:
The five states with the biggest absolute positive change were:
The bottom five states for absolute negative change were:
The interactive data in Figure 1 show the distribution of 2025 reclassification rates for all WIDA states with available data by exit criteria typology. We made four key observations:
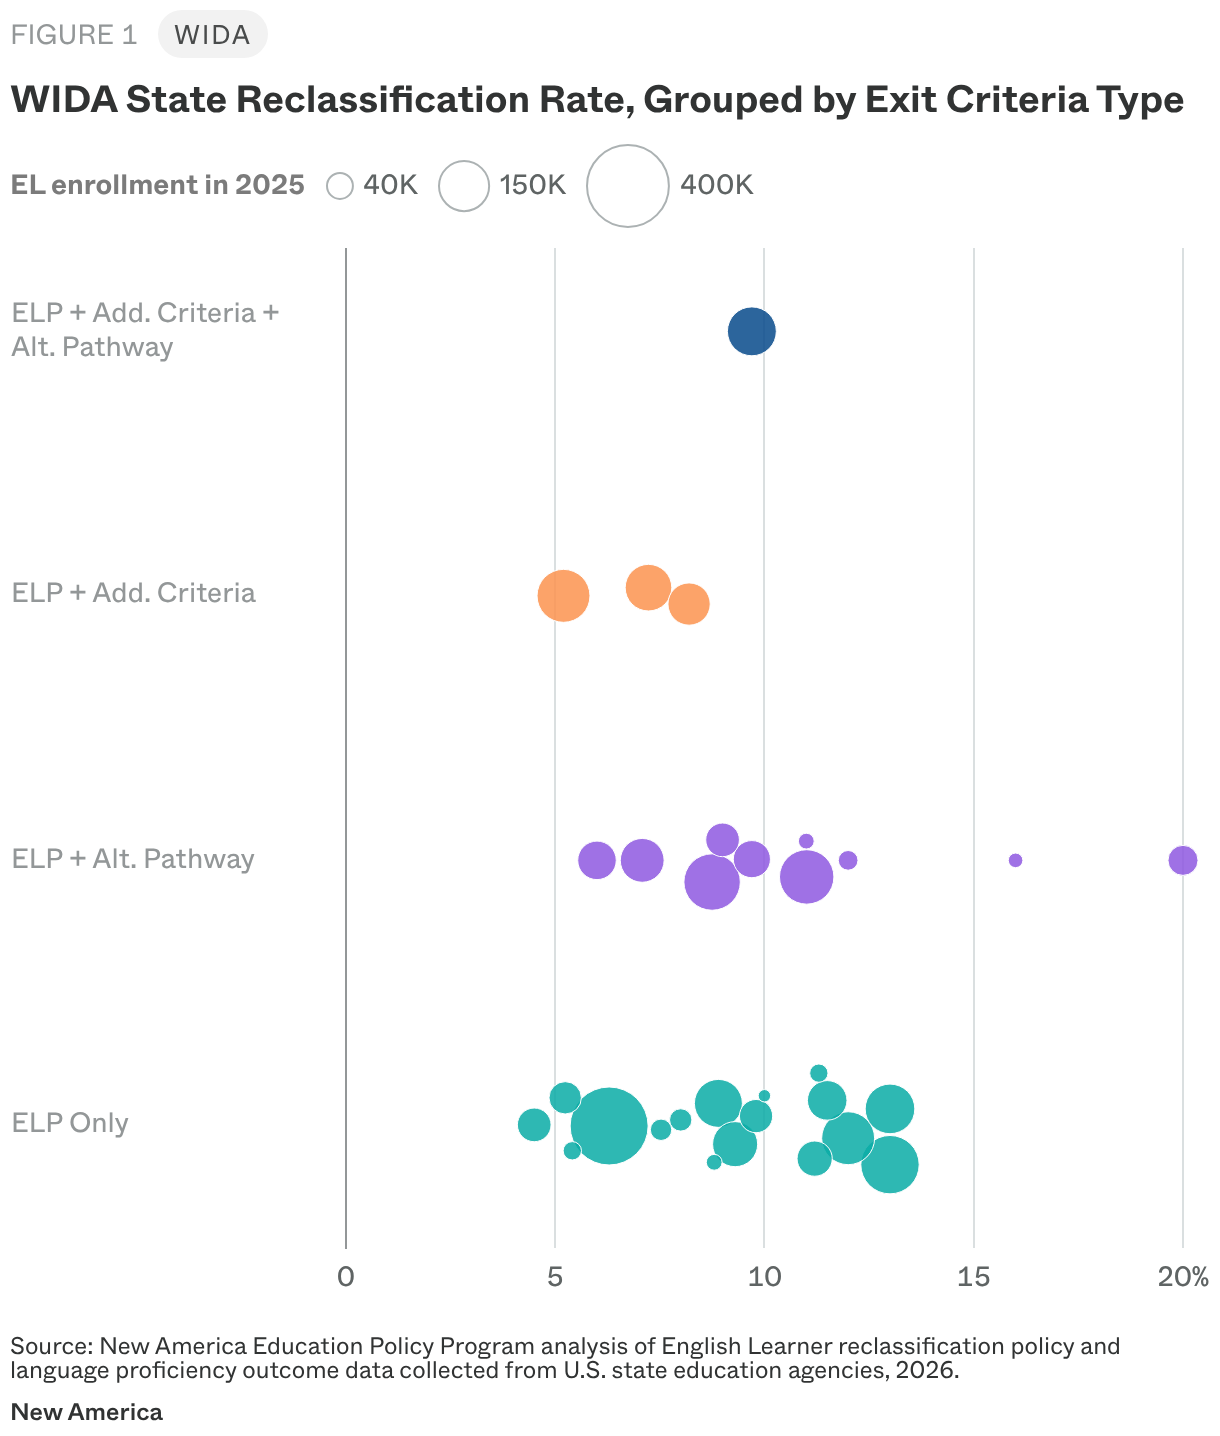
Figure 1 incorporates one helpful contextual variable—EL population size—and shows the proportionality between the size of the EL population and reclassification rates. Here, the size of the circles corresponds with the size of the EL population in each respective state. By adding this layer of information, the reader is able to observe reclassification rates relative to the EL population in a given state. For example, although North Dakota has the second-highest reclassification rate in the ELP + Alt Pathway category, it also has the smallest EL population among its peer states. That proportionality matters when drawing comparisons between states with similar reclassification policies. This is because a large or small EL population may affect a state’s ability to show progress in reclassifying students, since it may be easier to show a big change with a small denominator (smaller EL population), and more difficult to show a big change with a large denominator (large EL population).
The reclassification rate data plotted in Figure 1 were also used to calculate simple and population-weighted reclassification rate averages by category among WIDA states with available data. A simple average calculation treats reclassification rates across states as if they were equal. Population-weighted averages, on the other hand, help ensure that reclassification rates in states with larger EL populations have a proportional impact on the calculated average rather than being treated the same as those with fewer EL students.12 These rates are shown in Table 1.
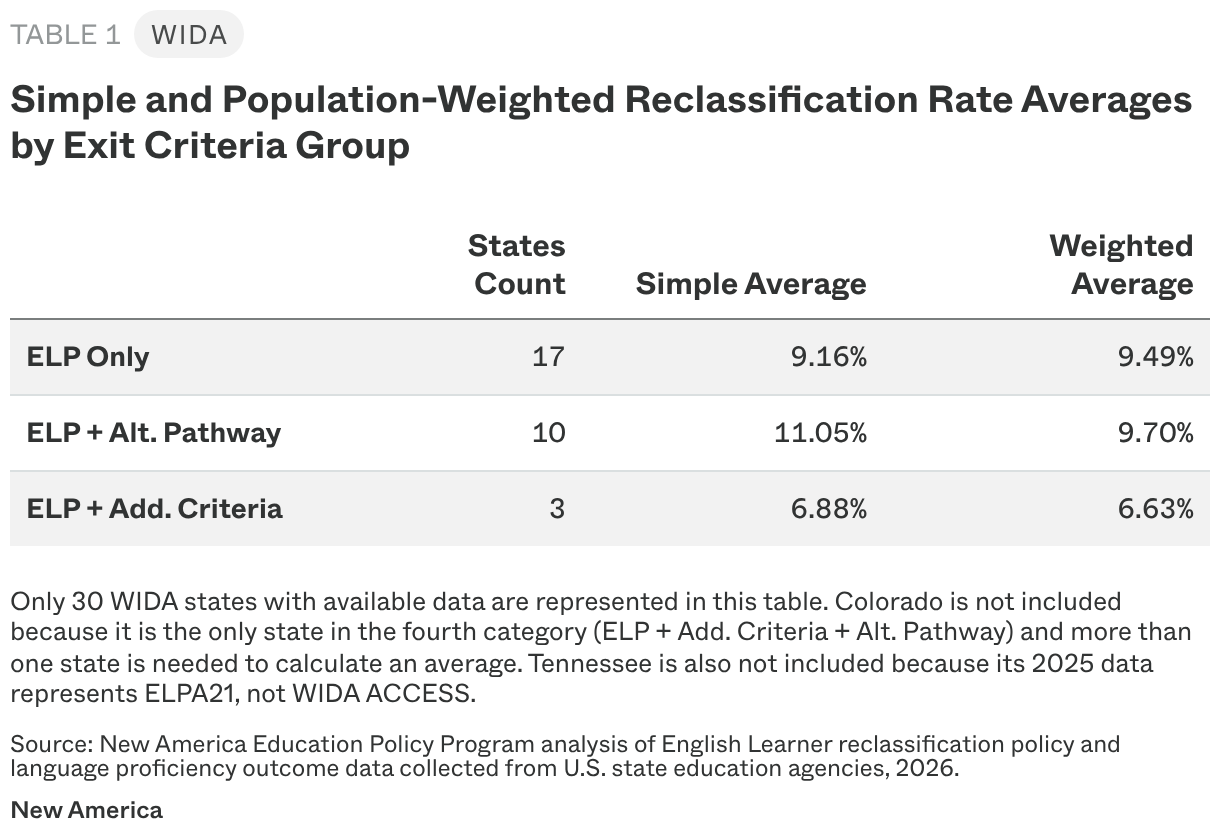
Before the size of the EL population is taken into account, there is a bigger difference between average reclassification rates between “ELP Only” and “ELP + Alt. Pathway” states. However, when the size of the EL population is taken into account, the difference between the two categories shrinks, though the weighted average among “ELP + Alt. Pathway” states remains marginally higher. Additionally, there is a clear difference between weighted and simple average for the “ELP + Alt. Pathway” because the states with high reclassification rates also have the smallest number of EL students. The average for ELP + Add. Criteria states is the lowest, and even decreases slightly, when the size of the population is taken into account.13
The use of weighted averages is helpful because they prevent high reclassification rates in states with small EL populations from making their exit criteria group look better than is potentially warranted. As Table 1 shows, the average for ELP + Add. Criteria states is still lower than the other two categories when the size of the population is taken into account, and actually decreases a bit. This finding suggests that having additional criteria as part of the reclassification process may have an outsized effect on reclassification than other factors. However, the sample size for this category (three states) is much smaller than the others.
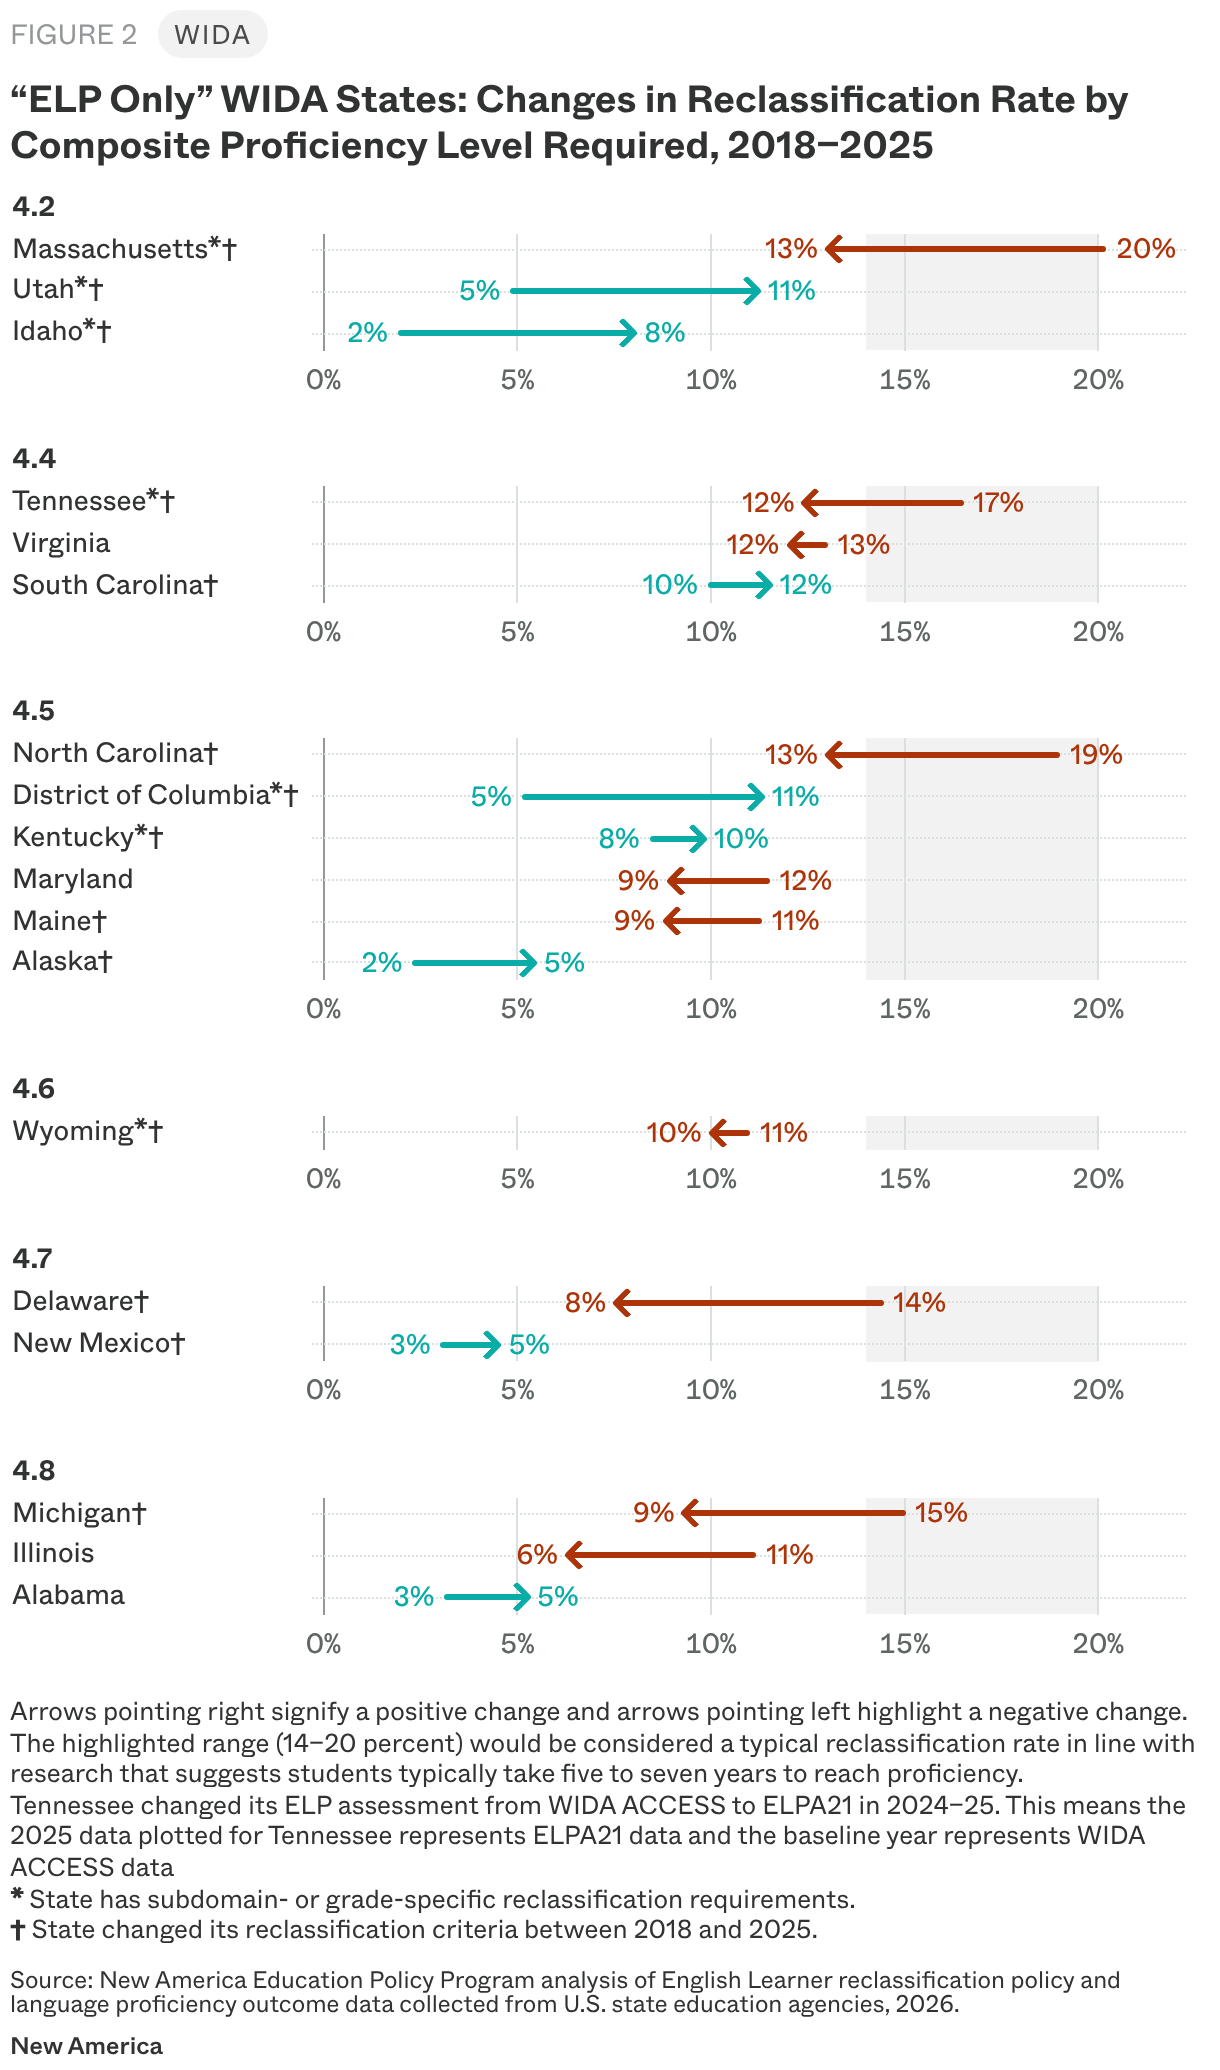
Eighteen WIDA states only use ELP scores in reclassification decisions (Figure 2).14 We have six key observations about this group:
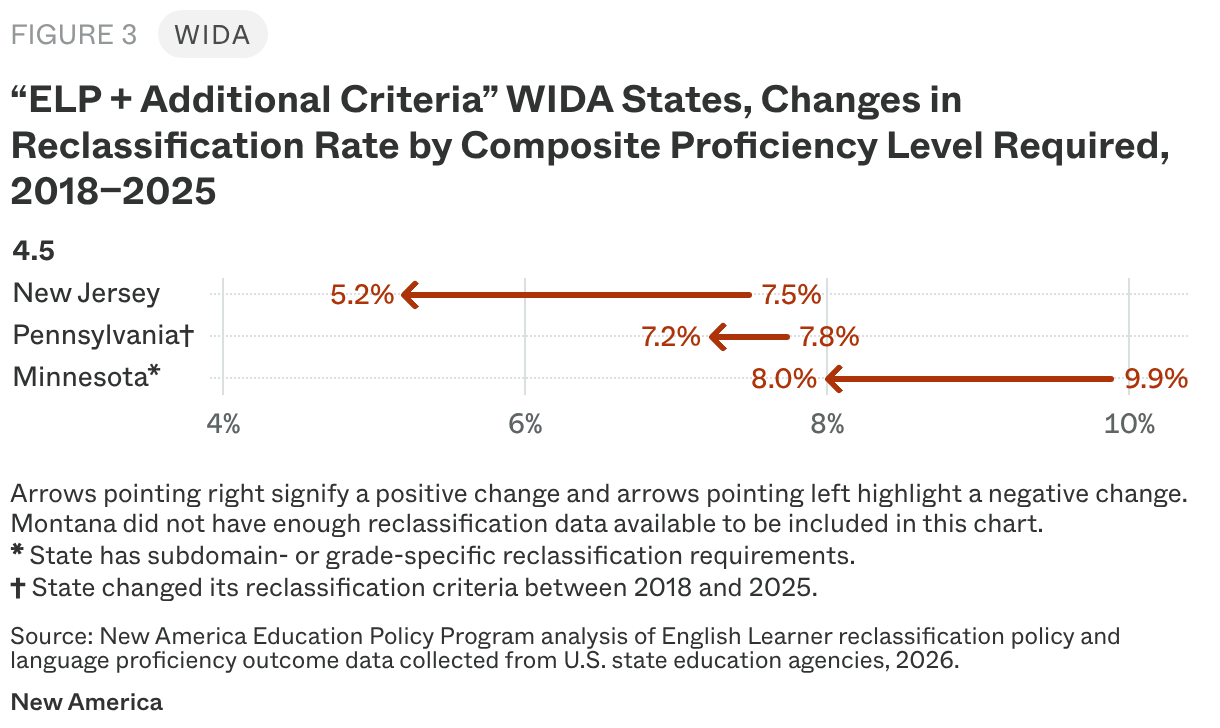
Four WIDA states use a combination of ELP and additional criteria to exit ELs. However, only three states had data available to determine the change in performance (Figure 3). Montana did not have reclassification data available in 2024–25 to determine its change in performance.17
We have three key observations for the states with available data:
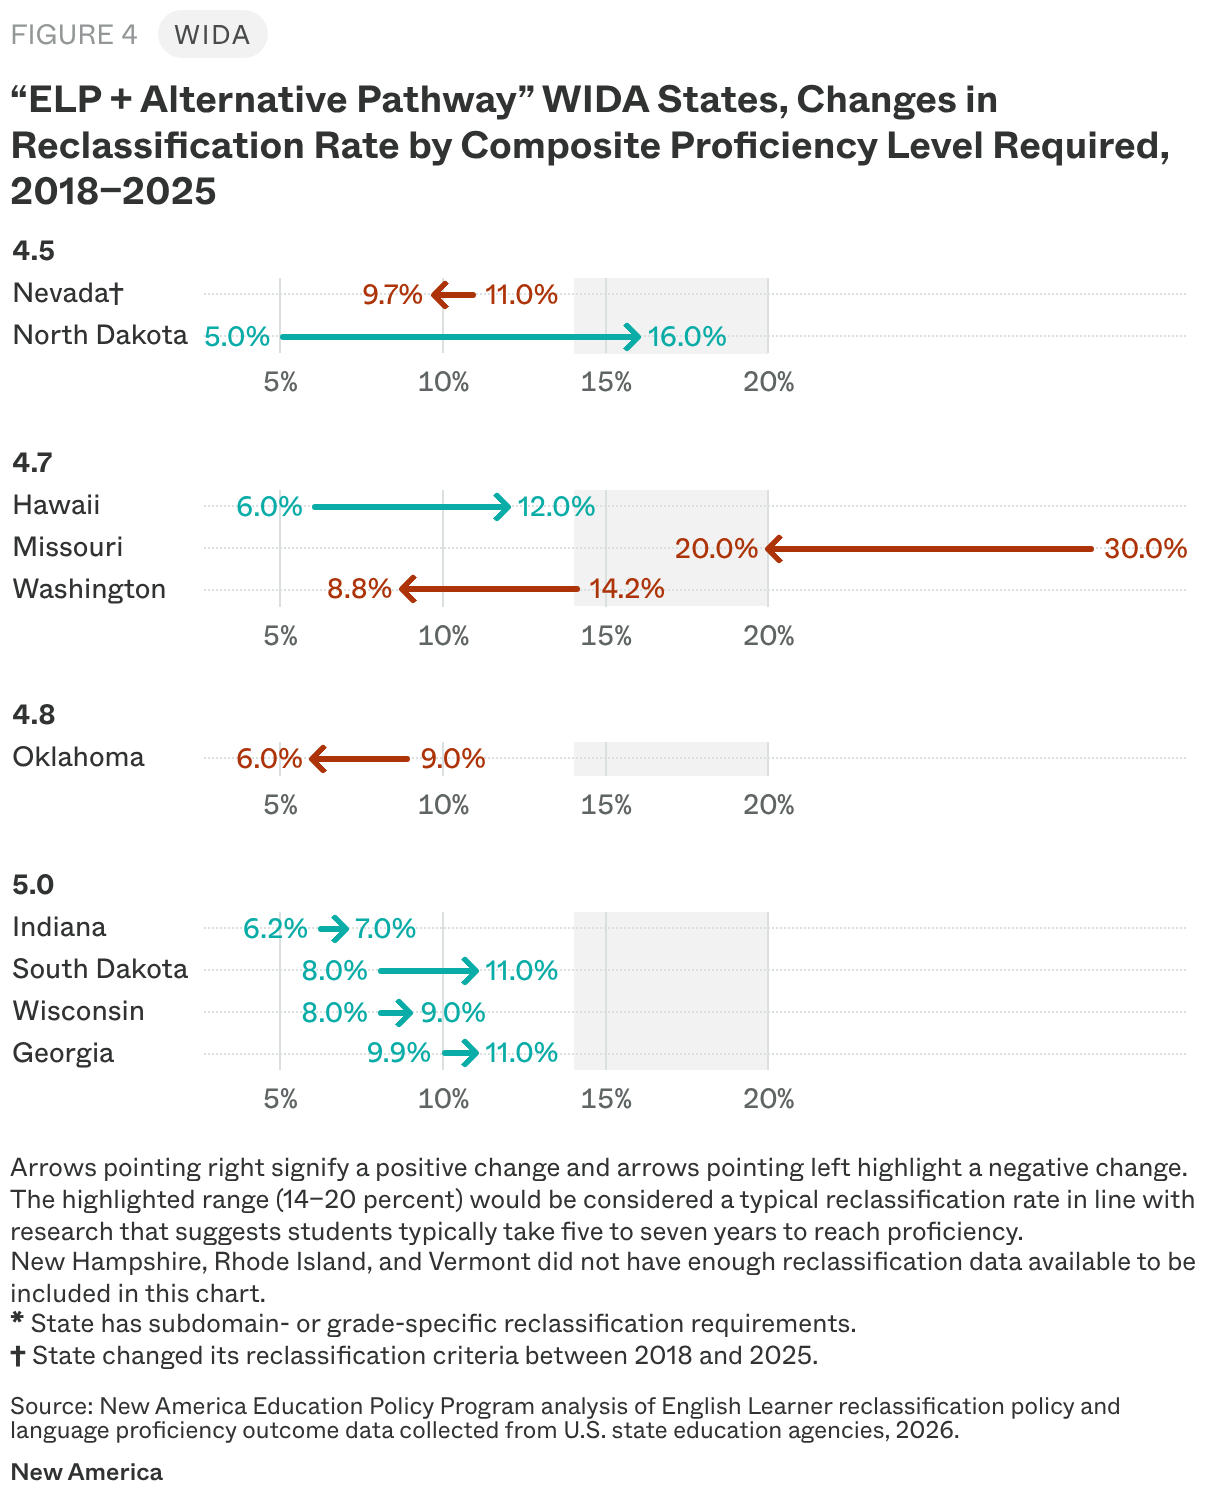
Thirteen WIDA states based reclassification decisions on ELP and offer some students an alternative exit pathway when they do not meet the state’s ELP threshold (Figure 4).18 Three states19—New Hampshire, Rhode Island, and Vermont—did not have data available to determine the change in performance.20
We made four key observations for the states with available data:
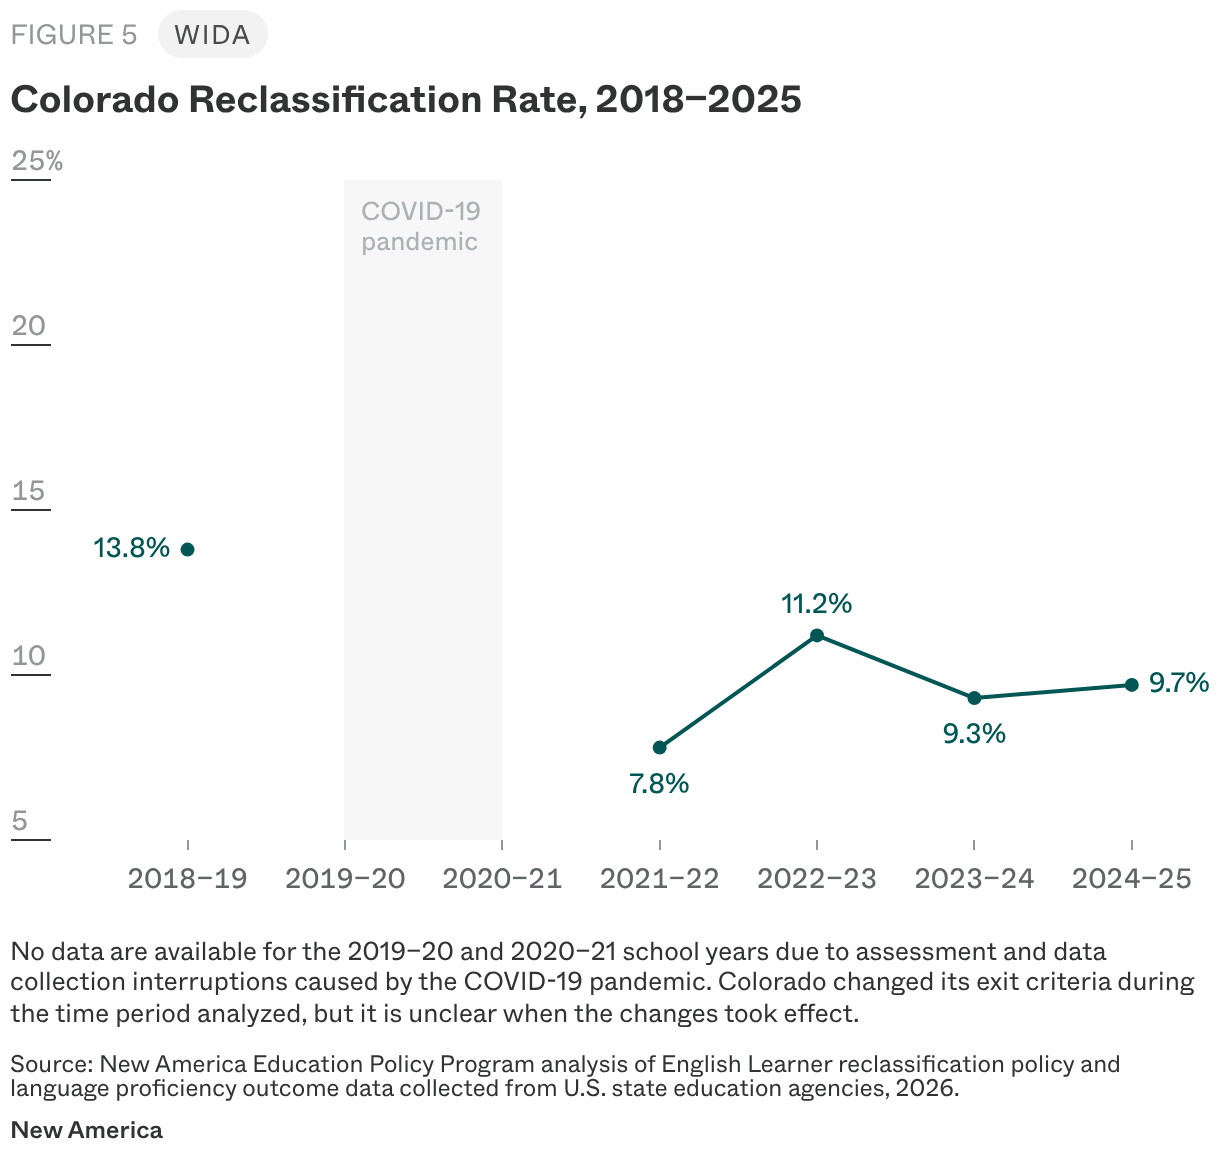
Colorado is the only state in this category with data available to analyze. As Figure 5 shows, the percentage of ELs redesignated (reclassified) has fluctuated every year. Colorado’s post-COVID reclassification rates were below 2018–19 levels and have yet to rebound to the pre-COVID level. Colorado’s reclassification rate has been continuously below the 14–20 percentile range of what would be considered “typical” over the last four years.21
Six of the seven ELPA21 states had available data to show a difference between 2018 and 2025.
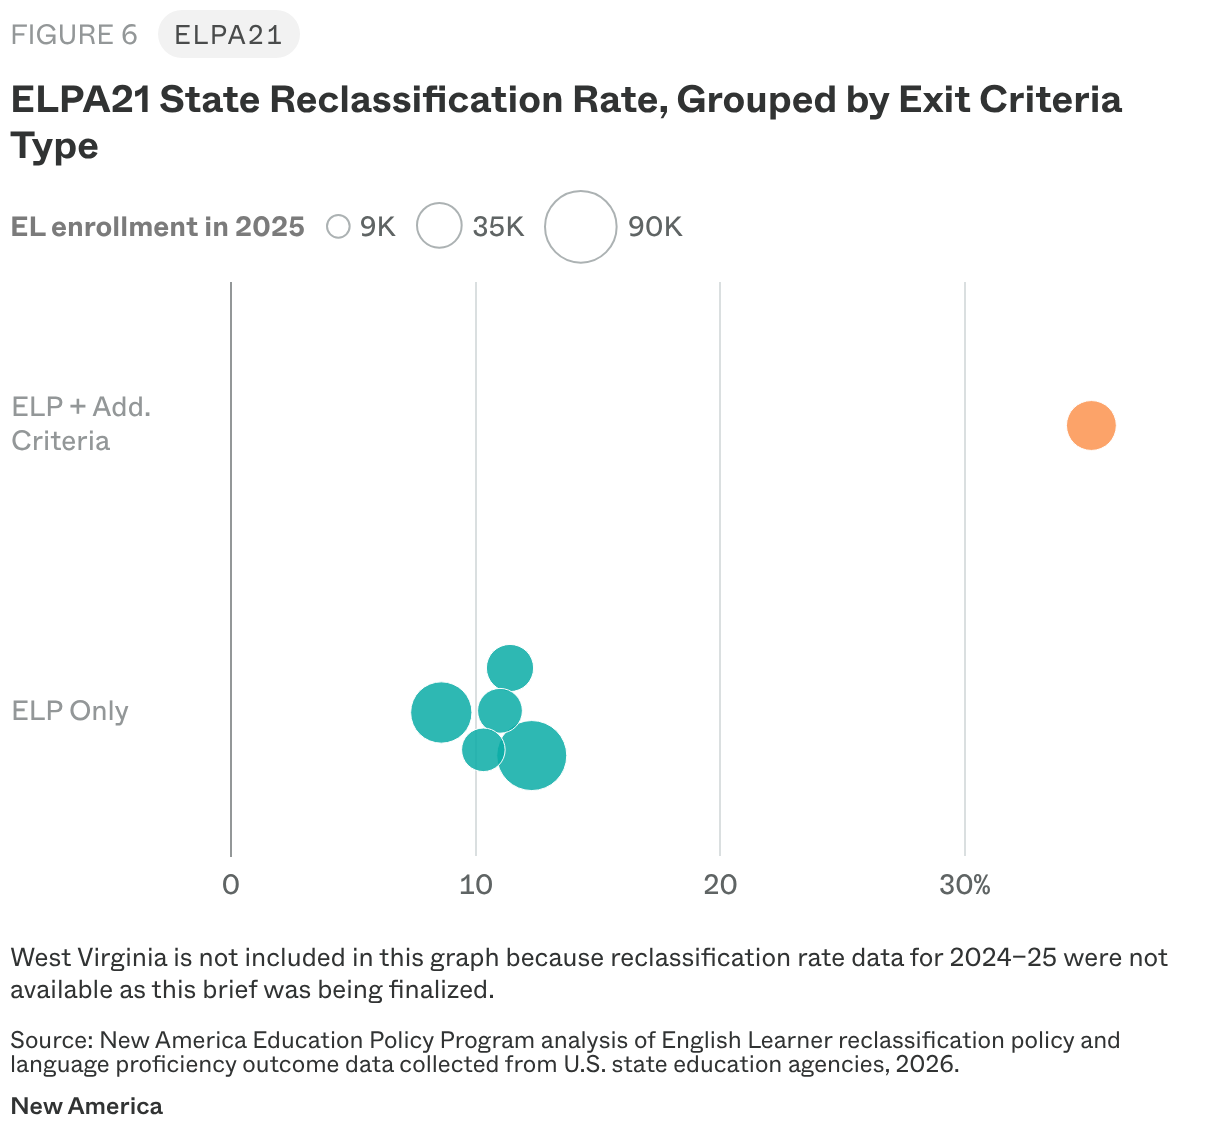
Although only two exit criteria categories are represented among ELPA21 states, Figure 6 shows the reclassification rate distribution by exit criteria typology for states with available data. This interactive graph shows reclassification rates in the ELP Only category ranging from 8.6 percent in Oregon to 12.3 percent in Ohio. The graph also shows that three ELPA21 states have pretty similar EL populations and reclassification rates (Iowa, Louisiana, and Nebraska). Arkansas is the only state that requires additional criteria and is an outlier, with a much higher reclassification rate.
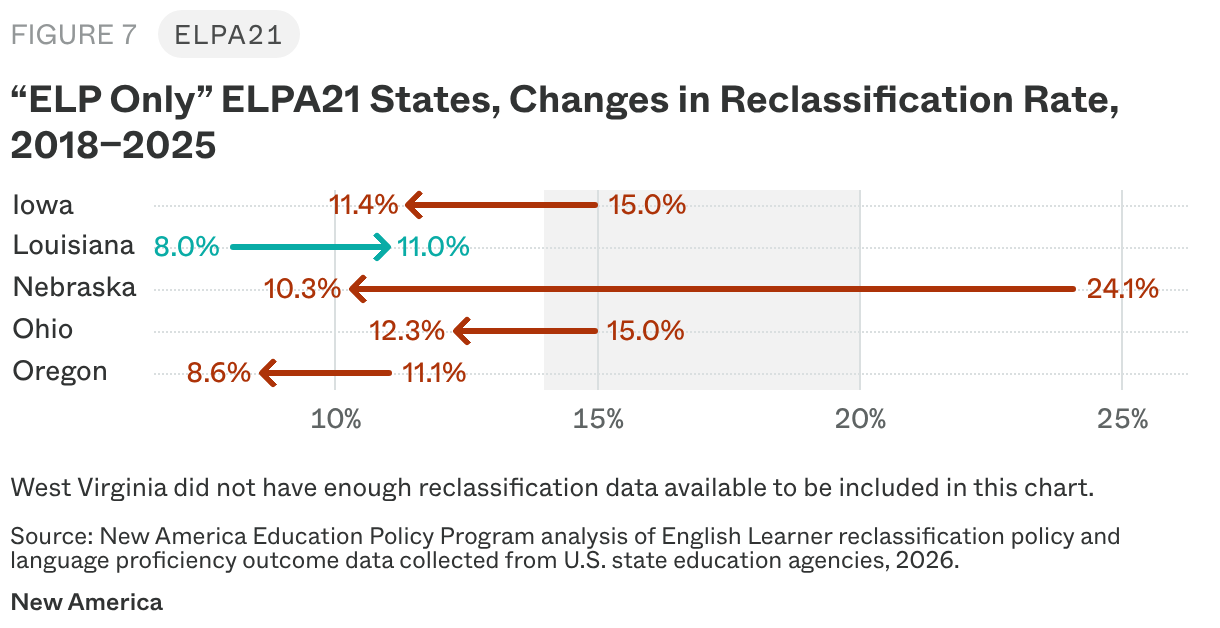
Six ELPA21 states only use students’ ELP in reclassification decisions. None of these states made changes to their exit criteria during the years analyzed.
West Virginia did not have reclassification data available for 2024–25 to determine a change in performance. Of the remaining five states, four reported lower reclassification rates in 2024–25 than in 2018–19, with the biggest decrease (almost 14 percentage points) observed in Nebraska (Figure 7). Only Louisiana had a higher reclassification rate in 2024–25 than in 2018–19. None of these states fell within the 14 to 20 percentile range of what would be considered “typical” in 2025.
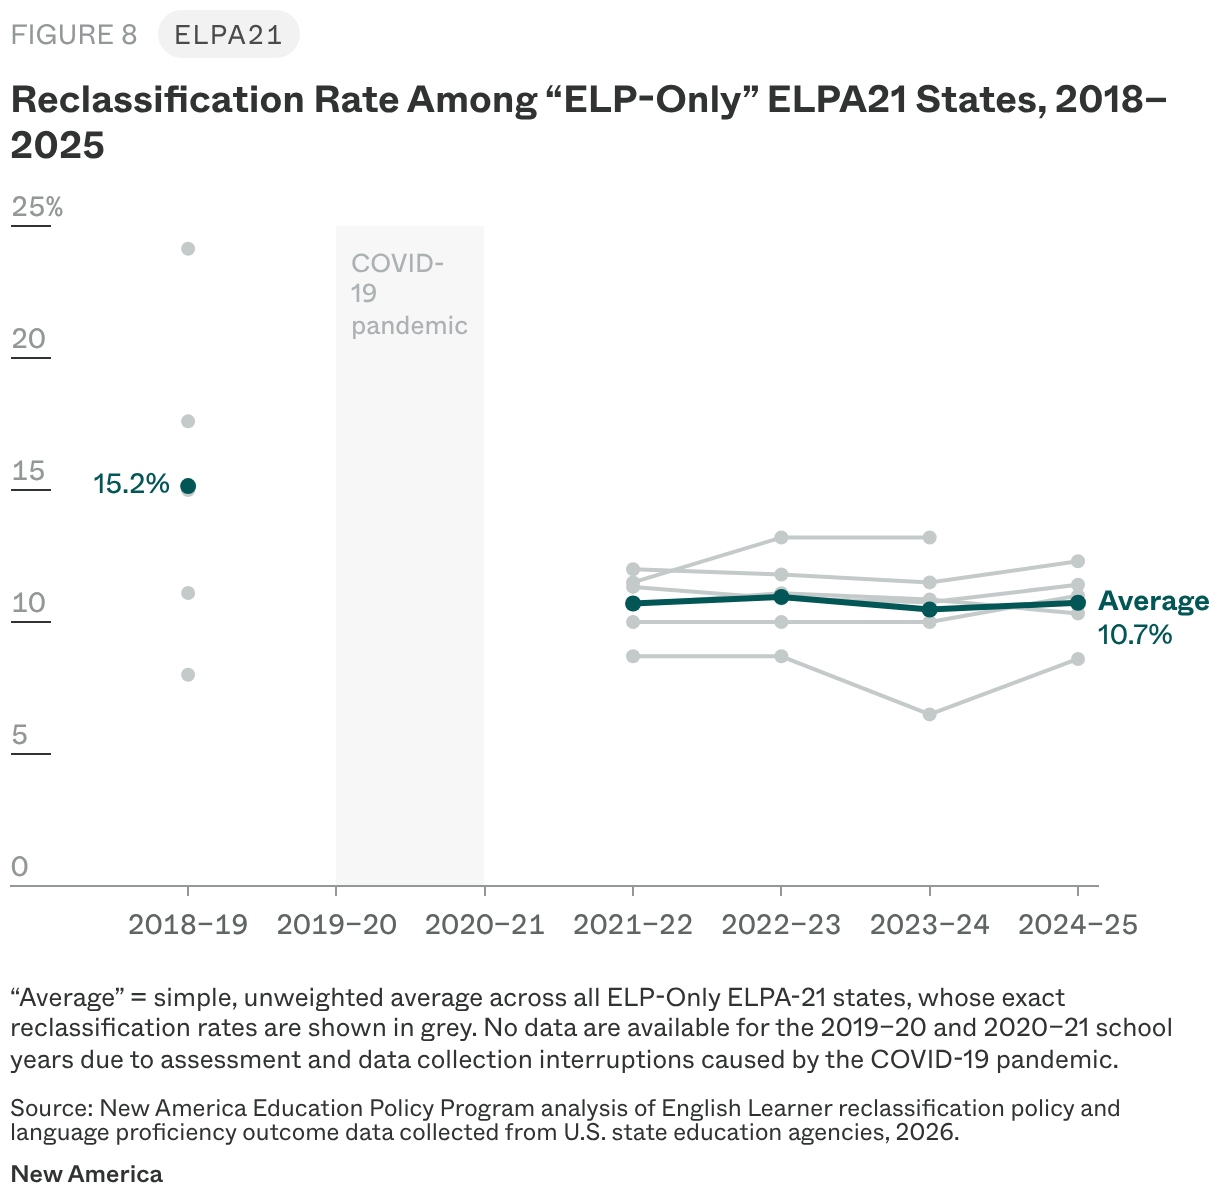
As Figure 8 shows, there was a wider distribution of reclassification rates for these states in 2018–19, prior to COVID, maybe because they were acclimating to the reclassification standardization established by ESSA. Post-COVID, however, these ELPA21 states have coalesced around the same reclassification rate, the average of which has hovered around 11 percent.
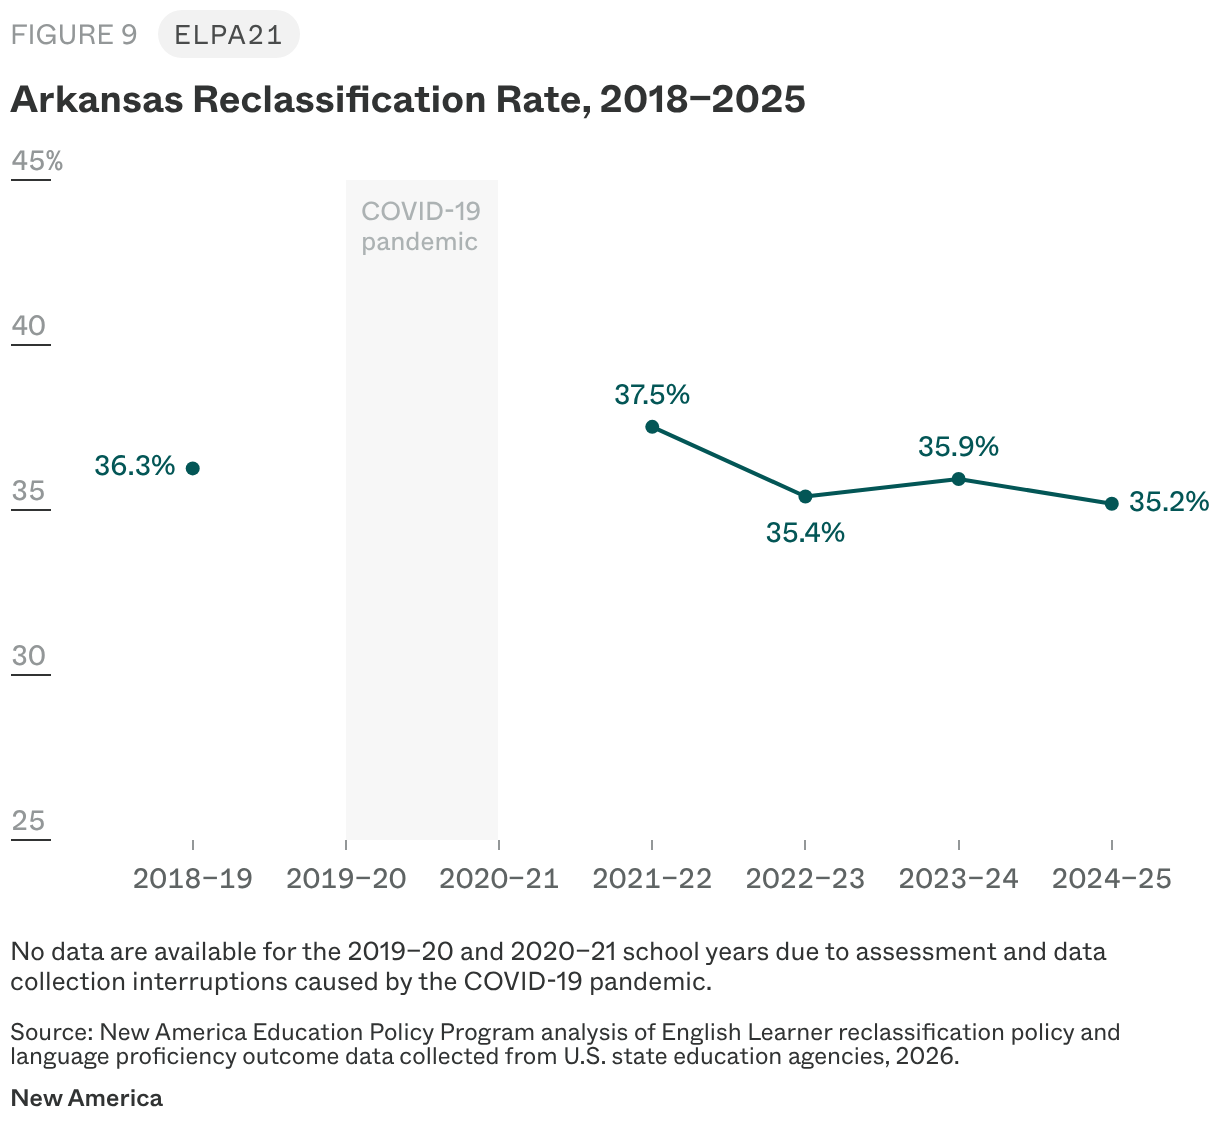
Arkansas is the only ELPA21 state that requires ELs to meet additional requirements to exit services. Figure 9 shows that reclassification rates have remained relatively steady throughout the years. The reclassification rates reported in Arkansas are well beyond the 14–20 percent range that has been observed as “typical” across all years.
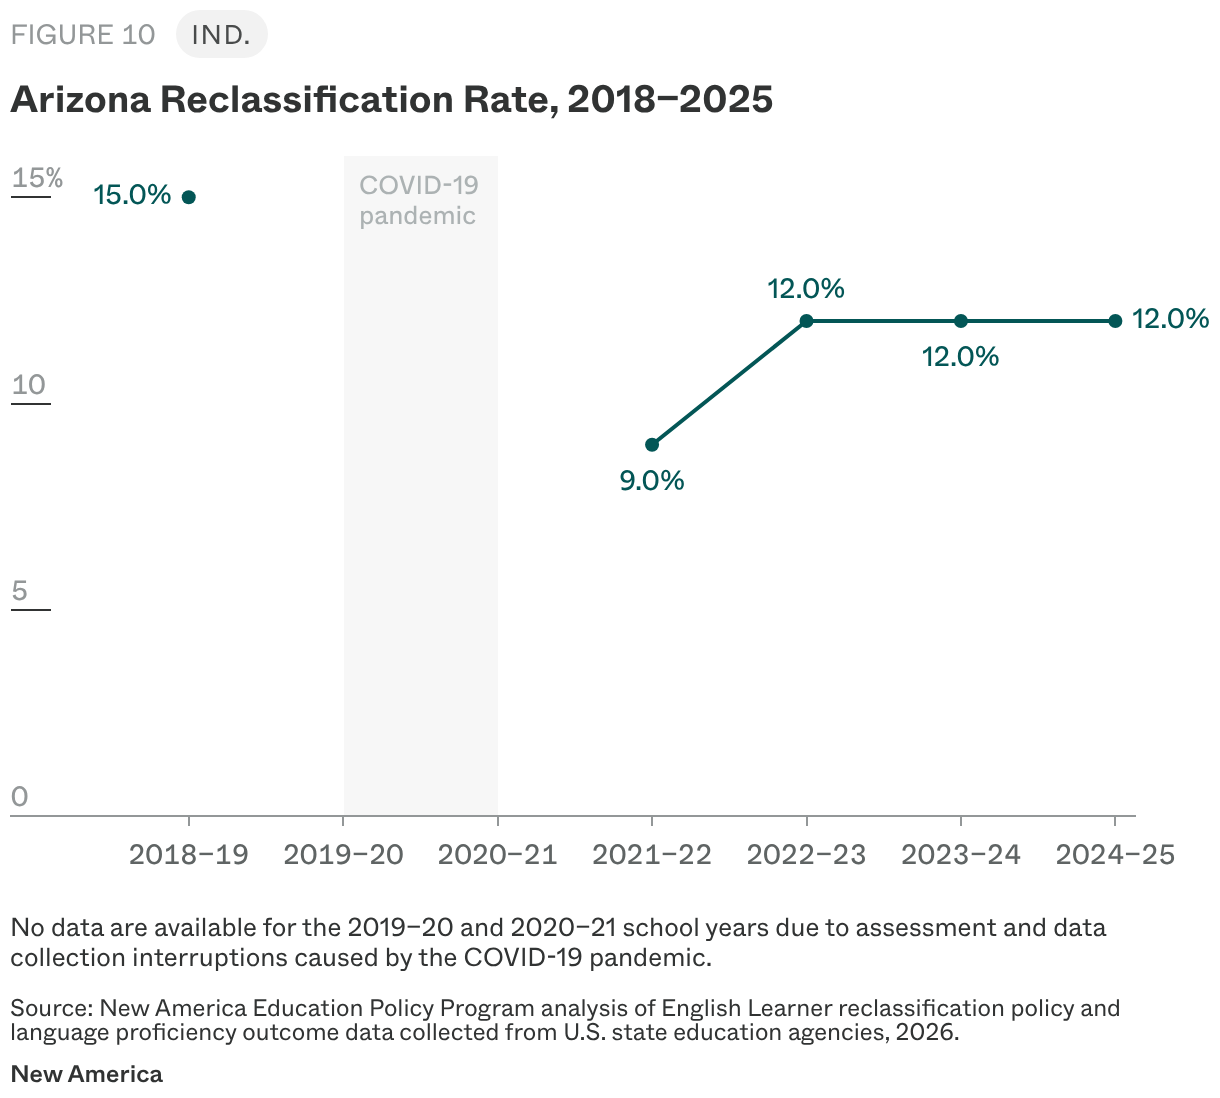
Arizona is the only state of the two in this category that had a complete data set to analyze. As Figure 11 shows, reclassification rates post-COVID have remained below 2018–19 levels, and the rate has stagnated at 12 percent for the last three years, below the 14–20 “typical” range since COVID.
California and Texas both require ELs to meet additional criteria to be eligible for reclassification. Texas does not have publicly available reclassification data.22 And the California Department of Education did not publish statewide reclassification rates between 2021 and 2026.23 According to SEA staff, the data were being updated and were therefore not publicly available.24 Given California’s incomplete data set and changing methodology, we could not observe trends over time. However, the state provides a useful example of the unintended consequences of requiring multiple reclassification criteria (see vignette below).
California’s Additional Reclassification Criteria
Reclassification in California has been the focus of extensive research and analysis.25 Even under ESSA’s requirement for statewide standardization of reclassification policy, California’s policy was implemented in such a way that local education agencies had discretion about how to use three of the standard criteria.26
Until recent changes, students were required to satisfy three additional criteria in addition to achieving a level 4 on the ELPAC exam: (1) teacher evaluation, including a curriculum review; (2) parent opinion and consultation; and (3) evaluation of “basic skills” measured against the performance of English-proficient students of the same age.
Over the last several years, researchers from Policy Analysis for California Education, the SCALE Initiative at Stanford, WestEd, and the Public Policy Institute of California (PPIC) have contributed to the body of evidence showing that the “basic skills” criterion is an obstacle for EL reclassification in California.27 Studies led by these researchers found that uneven application of the component held students back, with disproportionate impacts observed among ELs in secondary grades and those living in rural areas.28
An August 2026 report by PPIC provided more evidence that reclassification is not standardized or uniform across California. It identified vast variation in how districts tested and evaluated ELs’ basic skills, including the use of 24 different assessments and district-written exams and report cards.29 It also reported that the teacher input component of the state’s reclassification criteria was used in subjective and inconsistent ways. The authors argued that California should “simplify and standardize reclassification criteria” and “automate reclassification to lower barriers and reduce administrative burden.”30 This recommendation echoes previous calls from prominent EL researchers to remove the “basic skills” criteria.31
Evidence showing that California’s additional reclassification criteria have been “gatekeeping” academic opportunity for ELs was the impetus for AB 2555 by Assembly member Darshana Patel.32 The bill, signed by Governor Gavin Newsom on September 27, 2026, eliminated the additional three criteria and implemented an automatic reclassification for ELs who score a level 4 on the ELPAC, similar to Michigan’s “Auto Exit” policy.33 AB 2555 included an urgency clause, which means districts are immediately able to reclassify students solely based on their ELPAC scores.34
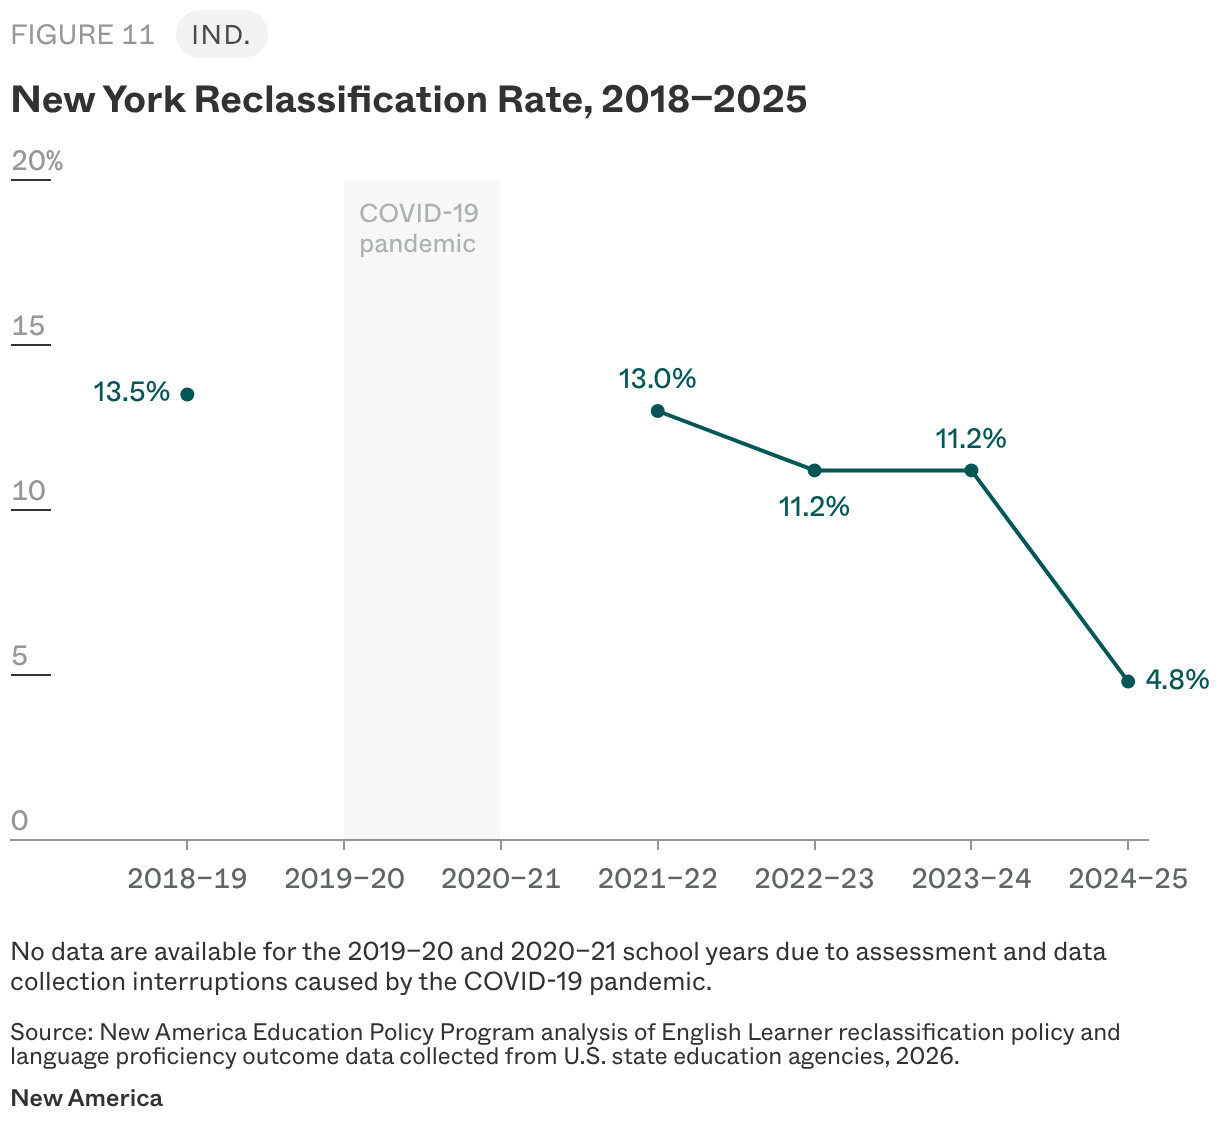
Prior to switching to WIDA in 2025, New York used its own ELP assessment and offered ELs an alternative pathway to reclassification.35 As Figure 12 shows, reclassification rates took a major dip in 2024–25, after being on a downward trend since COVID-19. Reclassification rates have remained just shy of the “typical” rate.36
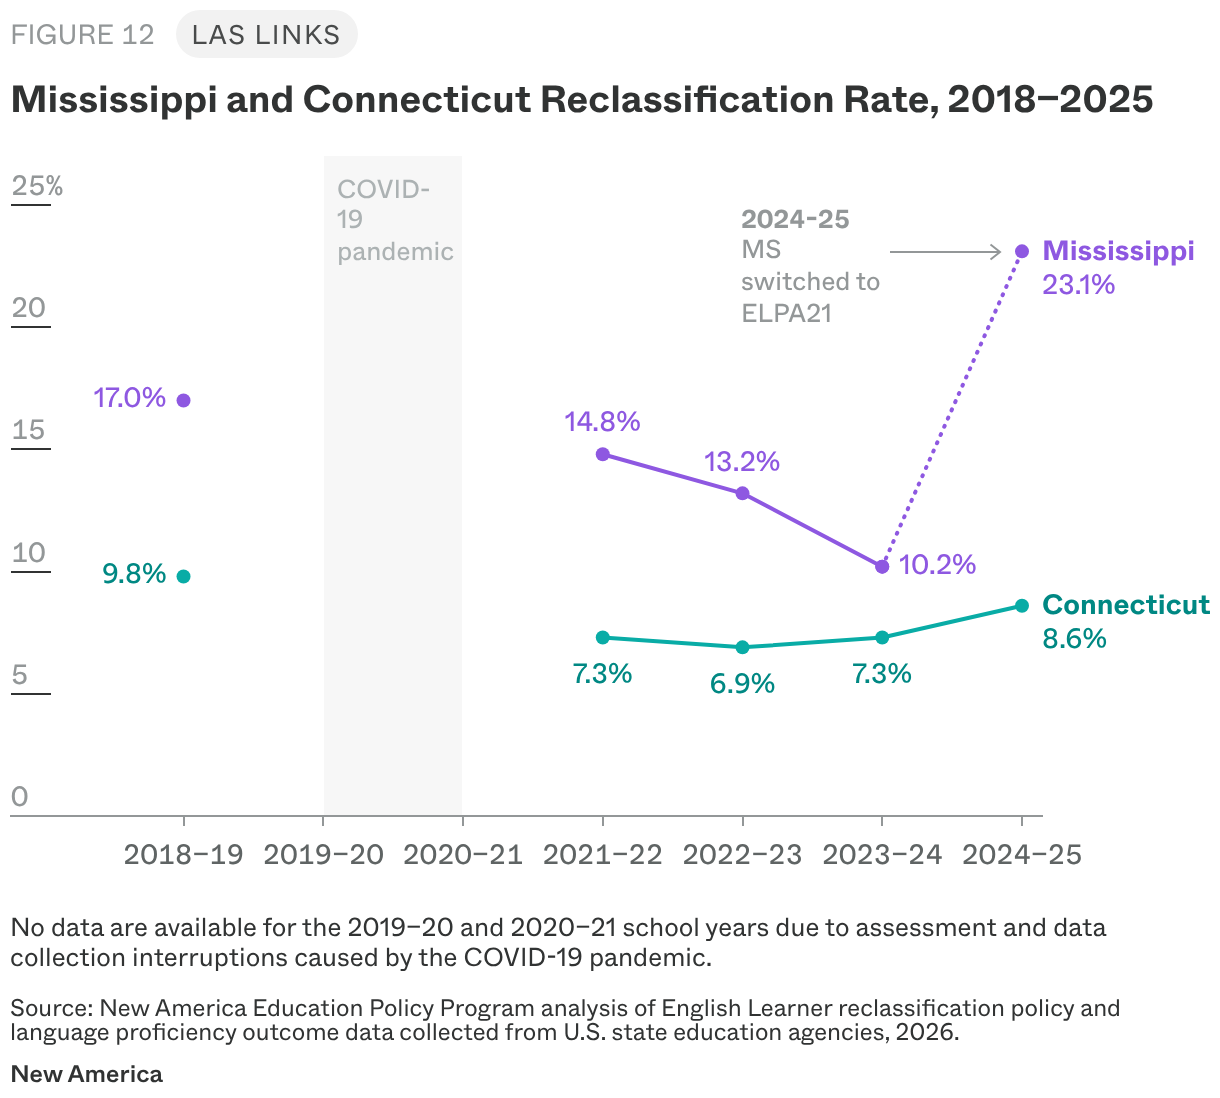
From 2018 until 2024, both Connecticut and Mississippi used the LAS Links ELP assessment.37 Starting in 2024–25, Mississippi transitioned from the LAS Links to ELPA21, leaving Connecticut as the only state that used the LAS Links in 2025. Mississippi’s reclassification data from 2023 or earlier reflect LAS Links levels, and any data from spring 2025 onward reflects ELPA21 scores.
As Figure 10 shows, Mississippi’s reclassification rate was consistently higher than Connecticut’s, though it was trending down post-COVID until it switched its ELP assessment. The spike in 2024–2025 coincides with the assessment changes. Before this change, Mississippi’s reclassification rate was about 7 percentage points lower than its pre-COVID levels. Connecticut has hovered around 7 to 8 percent post-COVID.
When we compared reclassification rates over time, we saw that 16 states reported higher reclassification rates in 2024–25 than in 2018–19. Fourteen of them changed their exit criteria at some point in the years in between. Twenty-five states reported lower reclassification rates in 2024–25 compared to 2018–19. Eleven of them changed their exit criteria at some point in the years in between.38 California and Arkansas reported virtually no change between the two years, and neither made changes to their reclassification policy during the years analyzed. Eight states had data gaps that prevented comparison.39
A confluence of factors shape reclassification rates, including, but not limited to, the ELP assessment used, the ELP threshold established, and additional reclassification components required. Non-policy related factors such as the size and characteristics of the EL population in a given state, as well as the methodology used to calculate the rate also influence the percentage of students that could be eligible to exit EL status in any given year, so caution should be used when examining EL reclassification rates and trends.
No two states have the same conditions. And as the first brief in this series shows, the majority of states (31) changed their exit criteria at some point during the years analyzed, so each state should be analyzed on its own to understand how EL services and reclassification policy are working together—or not—to ensure these students are exiting services at the appropriate time. Below we offer two lessons and ten considerations to strengthen state-level reclassification data.
Reclassification rates are one of the few available tools in the EL accountability toolbox. State, district and school reclassification data should, ideally, help us understand whether ELs are being supported to exit classification in a developmentally appropriate way. However, our ability to glean this kind of insight from statewide reclassification rates and trends, as currently reported, is limited. We learned two lessons from our research that can help improve clarity and accountability surrounding EL reclassification moving forward.
Throughout the data collection process it became clear that states did not necessarily use the same methodology to calculate annual statewide reclassification rates. Specifically, states can have different ways of accounting for which ELs count in the denominator and numerator. This is important because different approaches can produce varied results and/or results that can be interpreted differently and carry a different meaning. States that use a smaller denominator (e.g., the total EL count used to calculate reclassification rates) may be able to inflate their numbers.
These methodological nuances became more apparent while we were collecting data for states with more than one exit criteria. This is because, unlike “ELP Only” states that only need two data points to calculate their reclassification rate (e.g., percentage of ELs scoring proficiency on the ELP test and the total number of ELs included in the denominator), “ELP + Additional Criteria” and “ELP + Alternative Pathway” states have many other data points to account for. This can be an issue if their data collection systems and infrastructure are not set up to collect the information they need to know who is exiting language services and why. It is worth noting that of the ten states with missing reclassification rate data, seven use either additional criteria or have alternative pathways to exit.
Data collection systems that are not aligned with reclassification policy can present a problem because, as reclassification data for “ELP + Additional Criteria” and “ELP + Alternative Pathway” states show, having these extra components in the reclassification process does impact the pool of students eligible to exit. If a state’s data collection system does not account for all the various ways an EL can exit (e.g., ELP, additional criteria, and/or alternative pathway), it may not be able to know whether its policies (and services) are working as intended. Hence, it would be helpful to state and local education leaders, advocates, and researchers to have these various components accounted for in state data collection efforts.
Although there are many valid reasons why reclassification criteria between states differ,40 there are various policy considerations that can be used to create more clarity, consistency, and transparency in how annual EL reclassification rates are calculated.
Policy Considerations
Reclassification rates are not a pure representation of English language proficiency. Reclassification rates are the product of various intersecting factors including, but not limited to, the composition of the EL population, the instructional services provided in the classroom, the reclassification policies set up to sift through these students, and the methods used to crunch the numbers. These factors can change from one year to the next, which means that we need to understand the policy context to be able to glean any useful information from reclassification data.
In Mississippi, for example, the spike in reclassification in 2024–25 may be misunderstood if not presented alongside information about the state’s change to ELPA21 that same year. In North Carolina, the spike in reclassification from 2024 to 2025 may be misrepresented if it is not understood that the increase coincided with a change in the ELP threshold needed to reclassify (from 4.8 to 4.5).42
Another important policy consideration is whether states have additional criteria and/or alternative pathways. For example, the top two states in terms of largest percentage point increase between 2018 and 2025 (North Dakota and Hawaii) both offer students an alternative pathway to exit. Both states adopted their alternative pathways at some point between 2018 and 2025. Here, it would be helpful to know the percentage of students who exited language services because they met the state’s ELP threshold or because they met the alternative pathway’s criteria. This information can also help states reflect on the purpose of their alternative pathways, whether these policy tools are serving their intended purpose, and whether their core reclassification criteria should be revisited.
State and local education leaders, advocates, and researchers should also know the share of students that met the ELP threshold but did not exit, in states with additional criteria. This information can help identify academic barriers that ELs may be facing.
Sorting states by exit criteria allowed us to examine and compare states within their policy parameters. However, decision-makers, families, advocates, and researchers need to have access to information that helps them understand the entire reclassification policy context affecting ELs within their own state.
Policy Considerations
Research Considerations
This research project would not have been possible without the data visualization and thought partnership of Liz Cory, who leads data visualization design and development at New America.
This brief series was created with generous support from the Heising-Simons Foundation. The findings and conclusions contained in this series are those of the author and do not reflect positions or policies of the foundation.
The author would like to thank Amaya Garcia for her involvement in this project, as well as Zahava Stadler and Ivy Love for their keen data visualization advice in its early stages. Thanks to Lisa Guernsey for reviewing the final drafts, Sabrina Detlef for editing, and Katherine Portnoy, Maggie Navracruz and Amanda Dean for supporting publication and dissemination.
Special thanks to Molly Faulkner-Bond, English learner assessment and reclassification expert, who generously reviewed iterations of these briefs. The author is also immensely grateful to the state education agency staff who responded to inquiries throughout the data collection process.
Senior Policy Analyst, Education Policy