
Focus on the United States
In the U.S. market, prices vary widely across the country—but municipal networks tend to offer the fastest, most affordable options. Many consumers may struggle to determine total cost due to poor transparency, highly-complex pricing structures, and confusing itemized billing. In addition, the high average cost of internet service is unaffordable for many U.S. consumers, contributing to a longstanding digital divide that disproportionately affects low-income households and BIPOC communities.
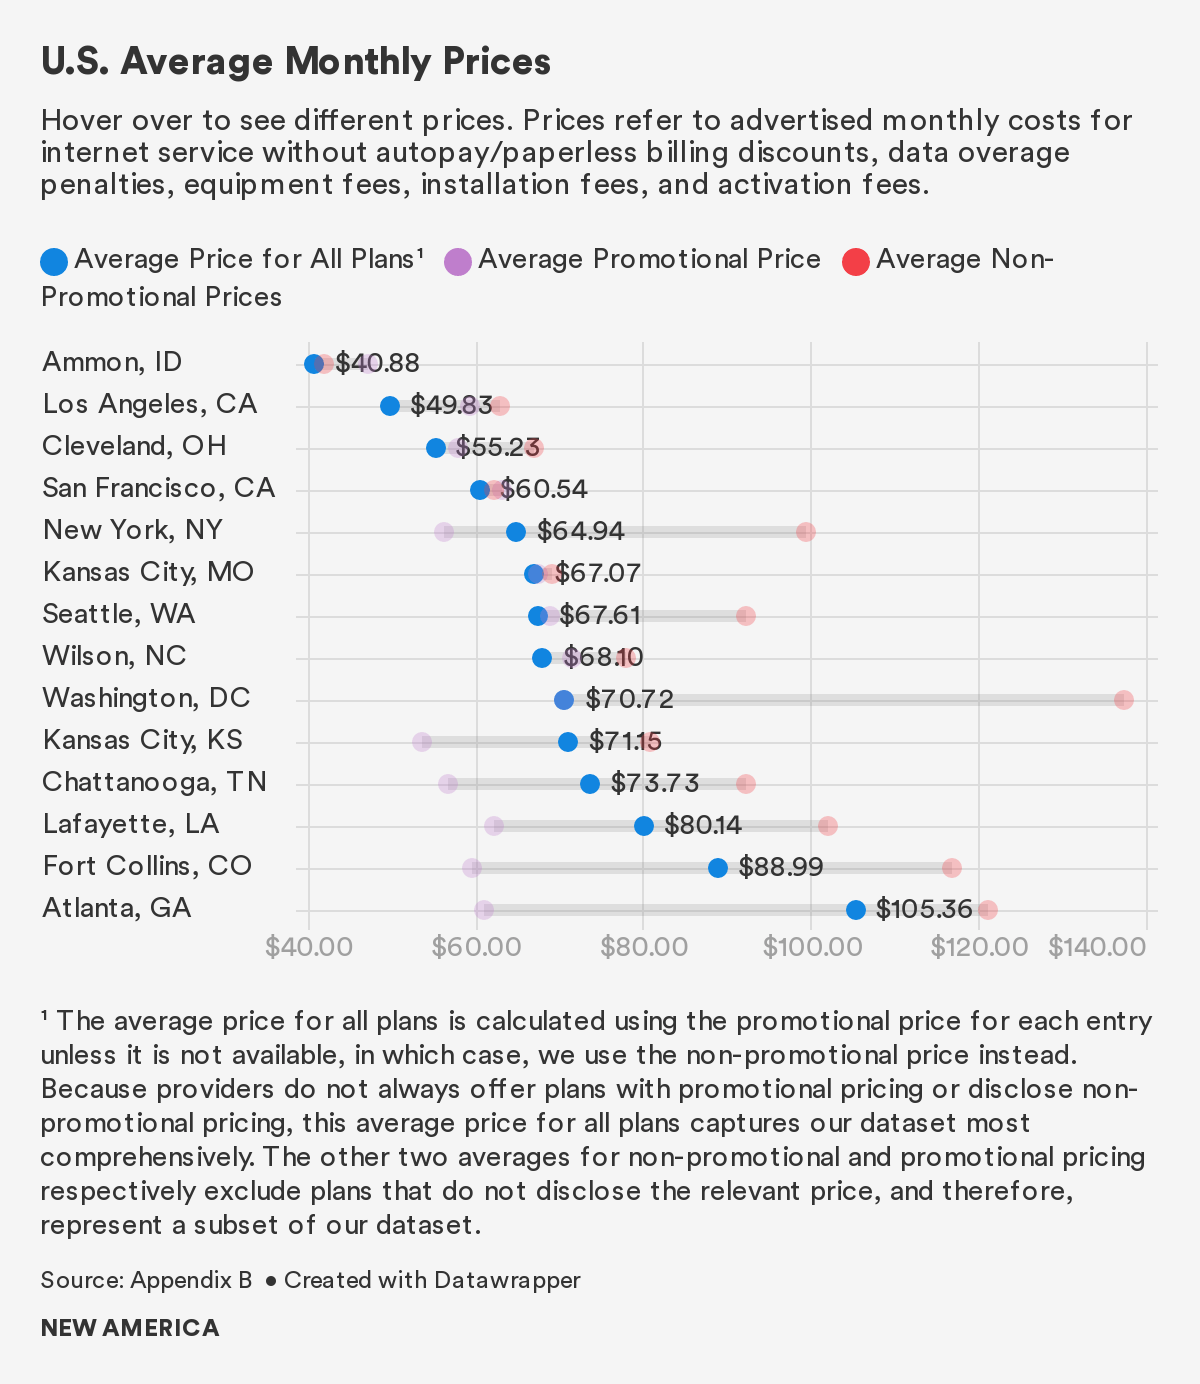
Within our dataset of 290 plans in the United States, the average promotional price is $62.17 per month and the average non-promotional price is $83.41 per month.1 The average monthly cost across all plans is $68.38.2 Of the 14 U.S. cities in our study, Atlanta has the highest average price. The lowest average price is in Ammon, Idaho, a city with a municipally-owned open access network.
Municipal Networks Offer Faster, More Affordable Service
Municipal networks serve more than 500 communities across the country.3 These networks are maintained by local governments either independently or through private-public partnerships. As OTI details in two recent reports, municipal networks can challenge incumbent private providers by delivering higher quality and more affordable internet, reaching more underserved communities than private providers would.4 Municipal networks can also expand economic opportunities by attracting new businesses and connecting residents to online education.
Five of the 14 cities examined within our U.S. dataset have municipal networks: Ammon, Idaho; Wilson, N.C.; Chattanooga, Tenn.; Lafayette, La.; and Fort Collins, Colo. As the following chart demonstrates, municipal providers bring down the average price in each city.
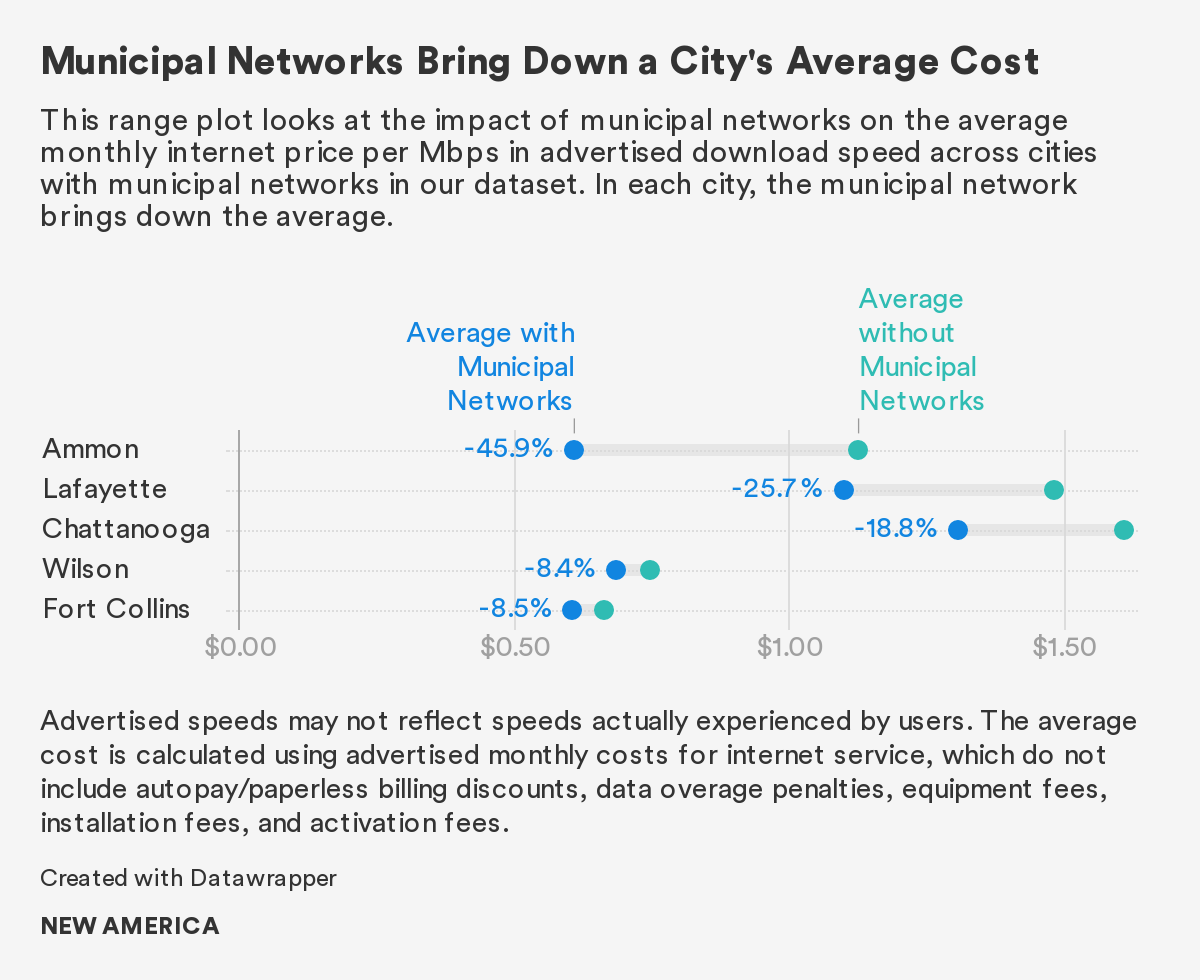
Juxtaposed against the prices advertised by private ISPs in each city, the procompetitive effects of municipal networks are stark. They offer consumers more affordable and faster alternatives than the private market alone. Looking at dollars per Mbps in advertised download speeds, municipal networks bring down the average cost by $0.06 to $0.52 per Mbps.5 Assuming that one pays for 25 Mbps download speed monthly service, for example, a resident in Lafayette, La. would on average pay $73.10 annually on the municipal network, versus $690.87 annually on a private network.6
We can also see the benefit that municipal networks bring in unlocking faster advertised speeds. The average advertised download and upload speeds are higher in cities with municipal networks than those without. The average advertised download speed for plans in cities with municipal networks is 712.88 Mbps, compared to 393.59 Mbps for plans advertised in cities without municipal networks. The average upload speed for plans advertised in cities with municipal networks is 675.40 Mbps, compared to 236.83 Mbps for plans advertised in cities without municipal networks.
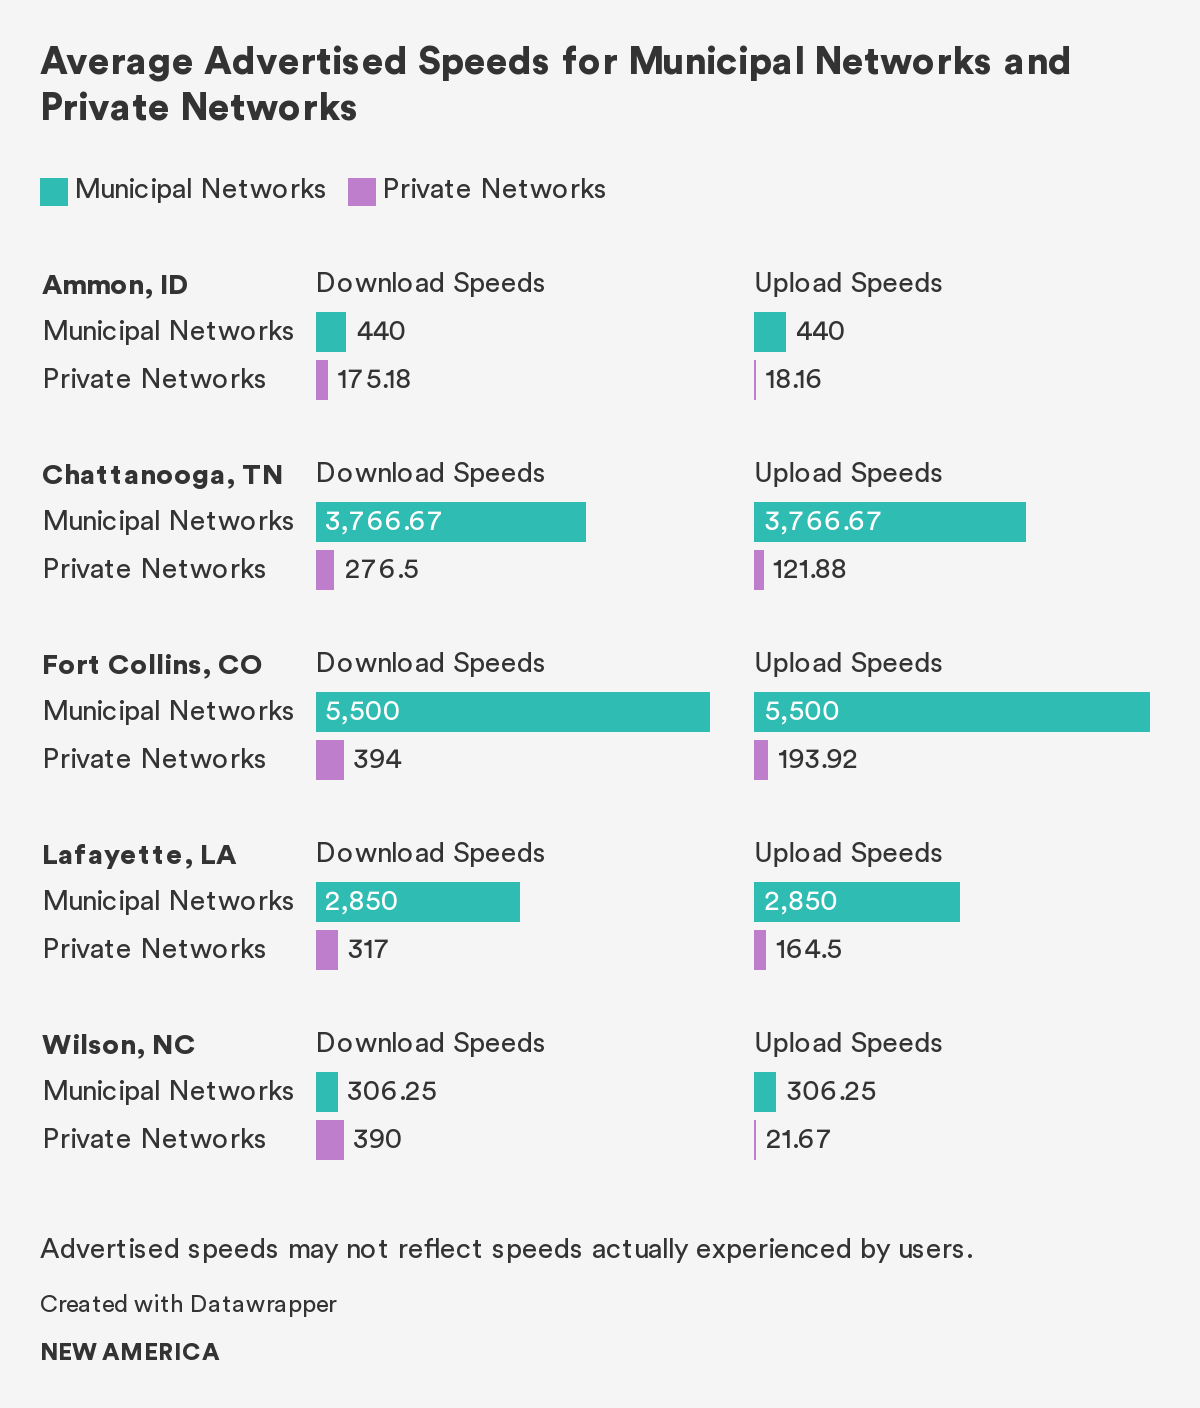
In the five cities, municipal networks offer higher average advertised download and upload speeds than the private networks, with the exception of advertised download speeds in Wilson, N.C. The average advertised download speed for municipal networks in these five cities is 1,608.20 Mbps, over four times the average for prviate networks at 313.18 Mbps. The average advertised upload speed for municipal networks in these five cities is 1,608.20 Mbps, over 14 times the average for prviate networks at 106.62 Mbps.
Earlier this year, OTI published The Cost of Connectivity in Ammon, Idaho, which examines a city that offers an innovative municipal network—and the lowest average monthly price of any U.S. city in our dataset.7 Fort Collins, Colo. offers another interesting case study. The average cost in Fort Collins is on the higher end of our U.S. results. A closer look at our Fort Collins dataset reveals that expensive plans advertised by private ISPs are pulling the city’s average upwards; four of the five most expensive plans are offered by private ISPs. Meanwhile, the city’s municipal network, called Connexion, advertises plans at the same speeds for less. For example, the municipal network offers the fastest plan advertised within Fort Collins, at 10,000 Mbps for $299.95, whereas Comcast under its Xfinity brand offers a plan at the same price that advertises just one-fifth of the download speed. The municipal network also advertises a 1,000 Mbps download speed plan for $59.95, which is almost a third of the price of the comparable 1,000 Mbps download speed plan advertised by kci.net, and $40 less than the 1,000 Mbps download speed plan offered by Comcast under its Xfinity brand. The municipal network, therefore, offers a better deal on the fastest advertised internet service option in the city.8
The benefits of the 1,000 Mbps plan from Connexion’s municipal network may be even more significant in the future. At the time of data collection, Connexion was a relatively new provider, so incumbents may not have felt competitive pressure to lower prices yet. Nonetheless, research has demonstrated that competition at the 1 Gbps speed level—the equivalent of 1,000 Mbps—leads to price reductions.9 For plans advertised between 25 Mbps and 1,000 Mbps download speed, the average price reduction is $13.28 to $29.08 per month. This research also found that each additional provider offering 1 Gbps service in a market reduces prices for comparable plans by $50 to $60 per month.
COVID-19 Exacerbates Affordability Problems, Particularly for BIPOC Communities and Low-income Households
Access to the internet is far from equal, and the digital divide disproportionately affects BIPOC communities and low-income households. One reason for this disparity is the lack of affordability. A growing body of research makes it clear that cost is one of the biggest barriers to adoption. According to a recent study of 6 million U.S. households with annual incomes under $25,000, 51 percent didn’t have home internet because it was too expensive.10
While the racial digital divide can be partially attributed to income inequality and the enduring Black-white wage gap,11 Black and Brown communities are less likely to have home internet access even after accounting for income disparities.12 The problem is especially acute in tribal reservations, where the American Indian Policy Institute found that only 49 percent of residents have fixed home internet service.13 Additionally, a long history of systemic racial discrimination in credit scoring, housing practices, and network deployment likely exacerberates the market failures in this sector.14
Internet affordability has taken on renewed urgency during the COVID-19 pandemic. As the economy slows and companies lay off millions of workers, more and more people are struggling to pay for basic necessities—including internet service. Overall, 61 percent of Latinx households and 44 percent of Black households have experienced a loss of income due to the pandemic, compared to 38 percent of white households—even as Black workers are disproportionately employed in essential work and less likely to have the option to telework.15 According to a Pew survey in April 2020, 28 percent of consumers reported that they were worried about paying their home internet bills in the coming months.16 This percentage increases when looking exclusively at the lower-income survey respondents: 52 percent of lower-income households reported worries, compared to 26 percent of middle-income households and just 9 percent of high-income households.17 Black and Brown communities were also disproportionately concerned: 54 percent of Hispanic adults said they were worried, compared to 36 percent of Black adults and 21 percent of white adults.18
…in April 2020, 28 percent of consumers reported that they were worried about paying their home internet bills in the coming months.
The move to distance learning during the pandemic has further exposed the "homework gap" that many students experience.19 In April 2020, 43 percent of lower-income parents reported that their children will likely have to do homework on their cellphones, and 40 percent said that their children would likely have to use public Wi-Fi to finish schoolwork because they lack a reliable internet connection at home.20 The "homework gap" also disproportionately affects students who belong to BIPOC communities.21
Other researchers have identified benchmarks for low-income affordability that should be explored. For instance, the Benton Institute for Broadband & Society’s Jonathan Sallet recommends that ISPs receiving federal funding be required to offer an unlimited data, 50/50 Mbps plan to all consumers for $50 per month—and $10 per month for low-income consumers.22 Sallet’s recommendation relies on research suggesting that internet costs of $10 per month would be affordable for low-income consumers.23
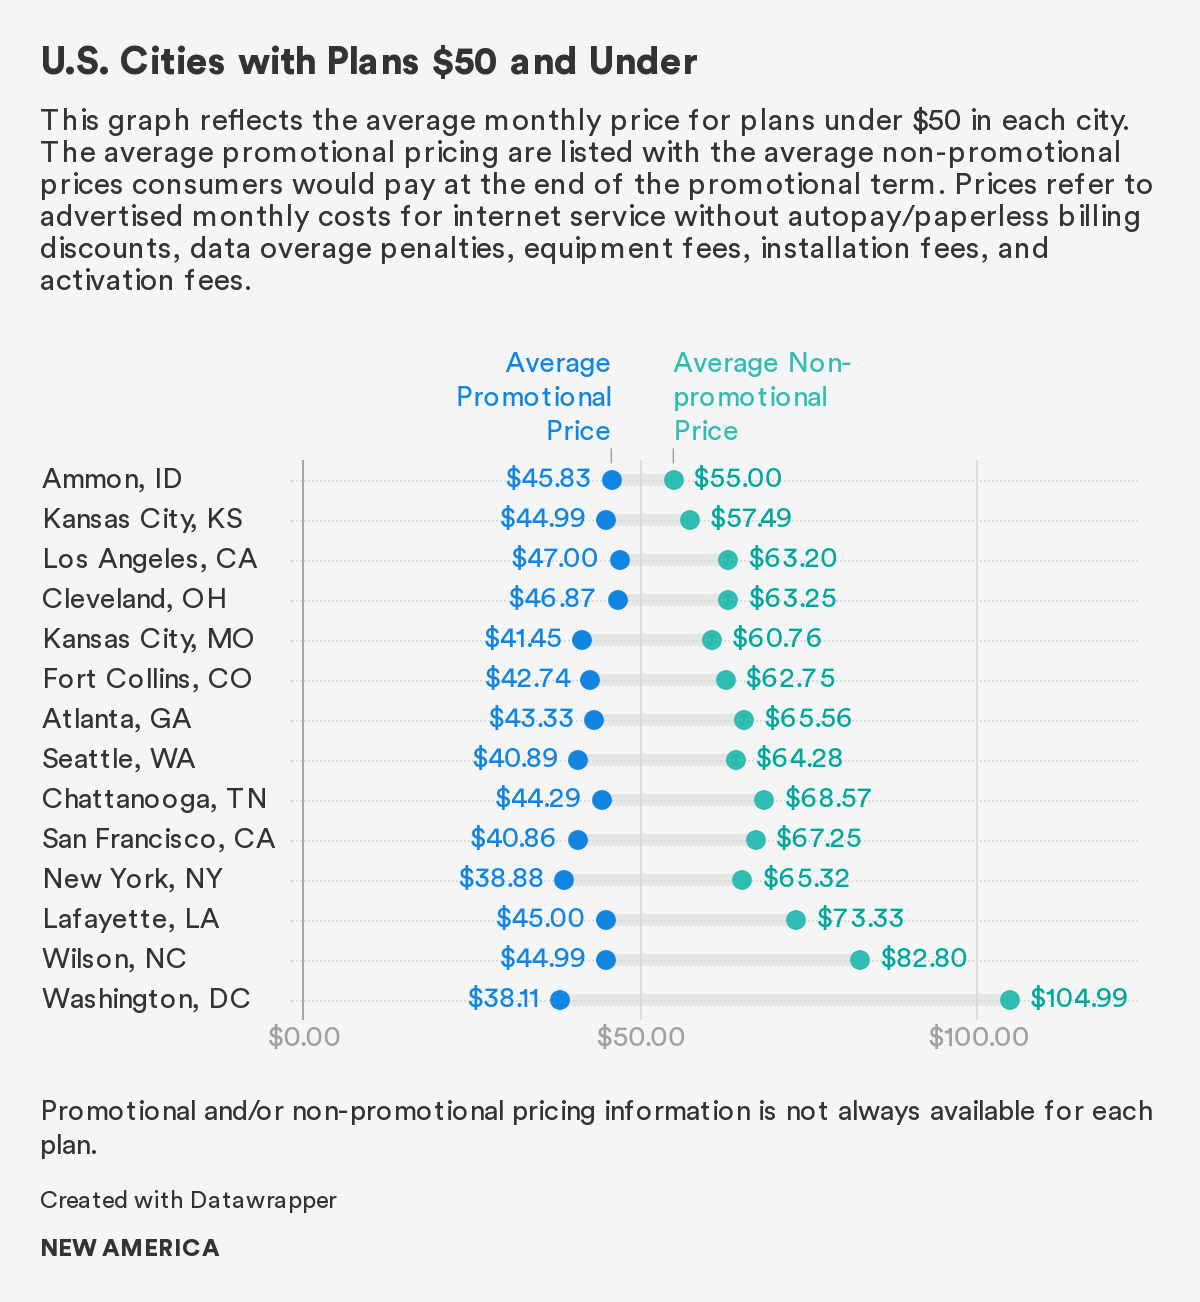
Our dataset demonstrates that the $50 benchmark conflicts with ISPs’ common practice of promotional pricing that increases after a period of time. In our dataset of 290 plans,24 only 118 advertise an initial promotional rate at $50 or less per month. Once the promotional term ends—usually after a year or two—providers increase the monthly rate by $22.25 on average.25 For many households, such price increases are unaffordable.26
Moreover, many plans that fall under the $50 benchmark do not meet advertised broadband speeds. Only 64 plans advertise 25/3 Mbps minimum speeds, the FCC’s current definition of broadband.
Even with promotional pricing, no private provider offers a plan that meets Sallet’s $10 benchmark for low-income households. Our dataset does not include standalone low-income offerings or plans targeted toward Lifeline subscribers for reasons detailed in our methodology. Within our U.S. dataset of 290 plans,27 only six meet this $10 benchmark, and all six are offered on Ammon’s open access network. After accounting for the $16.50 monthly utility costs and additional construction fee, these plans would exceed the $10 benchmark.28
Providers also sometimes offer autopay/paperless billing discounts in the United States.29 Within our United States dataset, these discounts range from $10 to $15 per month and are only advertised by Comcast under its Xfinity brand, Verizon, and WOW!. These discounts are sometimes only available based on the consumer’s method of payment. For instance, Verizon states on its website that it offers a $5 or $10 monthly autopay/paperless billing discount to enrolled consumers who use a debit card or a bank account as their automatic payment method; paying by credit cards is not allowed. This billing practice means that low-income consumers may have a harder time accessing these discounts if they do not have the available cash on hand or do not have bank accounts.
Our study provides additional evidence that internet service in the United States remains unaffordable for, and therefore inaccessible to, many low-income households. Recent research suggests that inflation may be rising faster for poor families.30 While our study doesn’t examine affordability from this perspective, we cannot ignore the economic conditions that affect households’ ability to afford internet services. A 2016 report found that low-income families are spending over 80 percent of their budgets on basic necessities—a much greater share than 30 years ago.31 The current pandemic reinforces that internet access is, as OTI and many others have long argued, a necessity.
These rising costs make government subsidies and discount programs all the more important for low-income households. The federal Lifeline subsidy of $9.25 covers only a small portion of average monthly costs—about 13 percent of the average advertised monthly price in the United States. Lifeline participants are still responsible for covering the difference out-of-pocket, including additional fees. Furthermore, recent FCC reforms have made it more difficult for standalone internet providers to participate in Lifeline.32
The federal Lifeline subsidy of $9.25 covers only a small portion of average monthly costs—about 13 percent of the average advertised monthly price in the United States.
Our dataset does not include standalone low-income offerings or plans targeted toward Lifeline subscribers, as these plans rarely disclose much information online or advertise sufficiently fast speeds for modern needs. For instance, Charter offers a low-income “Internet Assist” plan that is available to eligible households with at least one member participating in the National School Lunch Program (NSLP), Community Eligible Provision of the NSLP, or Supplemental Security Income.33 Charter’s website contains very minimal information about this plan. Similarly, AT&T offers an Access program advertising three speed tiers, none of which meet the FCC’s current definition for broadband.34 AT&T’s Access plans do not come close to meeting the average advertised download speeds across the United States. Nor do these plans come close to advertising the same download speeds per dollar as the plans in our dataset. U.S. consumers pay $0.16 on average for each Mbps in advertised download speed. By this metric, low-income consumers on AT&T’s $5 per month, 3 Mbps Access plan should expect to pay $0.48 per month, but are instead paying more than ten times that amount.35 These disparities suggest that plans targeted at low-income consumers may offer poor value.
What is Lifeline?
Lifeline is a federal program created in 1985 that provides a $9.25 monthly subsidy for telephone and internet services. Individuals are eligible for Lifeline if their income is at or below 135 percent of the federal poverty guidelines, or by participating in other federal assistance programs such as Supplemental Nutrition Assistance Program (SNAP), Medicaid, Supplemental Security Income, or Federal Public Housing Assistance. The subsidy is restricted to one per household, which is defined as any group of people who live together and share income and expenses, even if they are not related. Eligible consumers can use the subsidy on just one type of service: home phone, mobile phone, bundled mobile phone and internet, or standalone home internet—but no combination of any of these services.
Program participation rates are in decline. Rather than trying to improve participation, the FCC has proposed reforms that would make it more difficult for people to apply for Lifeline and maintain their eligibility, restrict provider participation (particularly for standalone internet providers), and infringe on subscribers’ privacy.36
ISPs Are Not Transparent With Consumers
The total cost of service is difficult to determine in the United States. ISPs advertise monthly prices for their services, but these prices are seldom inclusive of ancillary fees and price changes over time. ISPs frequently offer time-limited promotional rates for monthly internet costs, but when the promotional term expires, consumers have to pay the non-promotional rate, which is not always disclosed on providers’ websites. On top of these monthly internet costs, consumers pay fees for equipment purchase or rental, installation and activation, data overages, and early contract termination. These ancillary fees can be perceived as “hidden” fees due to a lack of transparency and complex contract terms. ISPs have also been fined for deceptive billing practices.37 Both trends underscore the urgent need for transparency and robust consumer protections that we detail in the “U.S. Policy Recommendations” section.
Time-limited promotions make it difficult for consumers to understand the prices they can expect to pay for internet access. These promotions are advertised on websites, sometimes without transparency into the prices that consumers would be charged once the promotional term has expired. More transparency around what consumers will be charged at any time is crucial to determining whether plans advertised in an area are truly affordable. The average promotion size for all plans in our dataset is $15.83.38 The average promotion size for U.S. plans is $22.64,39 but the price increase after a promotion expired ranges from 6 to 193 percent of the initial promotional price.40
When providers employ complex pricing structures with numerous itemized fees, consumers may not anticipate these price increases and take them into account in their initial decision-making. Time-limited promotional pricing can also demonstrate a facet of providers’ market power, as they may possess the ability to increase prices over time while maintaining the same plan qualities.
Do Website Restrictions Inhibit Price Transparency?
Web user agreements are common across websites. They detail “terms of service,” “terms of use,” or “acceptable use” policies that govern what users can do on a website. However, since we last published our Cost of Connectivity report in 2014, several ISPs have amended their web user agreements in a manner that inhibits price transparency and discourages public understanding of the cost of internet service.41
For instance, at the time of data collection for the current report, several providers included provisions prohibiting individuals from gathering data or reproducing content from their websites in their web user agreements. AT&T and CenturyLink prohibit users from “systemically collect[ing] and us[ing] any Content including the use of any data mining, or similar data gathering and extraction methods.”42 Verizon prohibits users from “reproduc[ing], display[ing], distribut[ing], or otherwise us[ing] the Site Material in any way for any public or commercial purpose.”43
Toward the goal of greater transparency to empower users, we urge providers to remove these restrictive provisions. Consumers need publicly available data about pricing and plan terms to understand what they are paying for. Researchers need this data to better understand the opaque market for internet service. Policymakers can use this data to inform efforts to close the digital divide. Advertising data also supports an open process for users to challenge inaccurate data without fear of retaliation from industry.
ISP websites typically feature the monthly internet price, but installation and activation fees, equipment fees, data overage penalties, and contract termination fees are generally harder to find. These additional fees can be sidelined to terms and conditions pages or PDF documents accessible through small hyperlinks on the bottom of provider websites or buried in fine print on ISPs’ service agreements. For instance, the comprehensive fee schedule for AT&T is available on its website in the legal policy section located at the bottom of the main webpage.44 Consumers do not always read the (very) fine print to find the contract termination fees,45 and as a result are more likely to underestimate their switching costs—an important distinction when consumers are more likely to overestimate cost-savings from long-term contracts that are more visibly advertised.46
These pricing structures make it difficult for consumers to understand the total price they can expect to pay for internet service. In 2018, 69 percent of U.S. consumers reported experiencing an “unexpected or hidden fee” from a cable, internet, or phone service provider in the past two years.47
Some of these fees may not be disclosed to people when they sign up for internet service. In a 2019 study, Consumer Reports detailed many of these undisclosed fees, including internet service-related fees, administrative fees, and convenience fees.48 For instance, Frontier charged a mandatory internet infrastructure surcharge and RCN charged a mandatory network access and maintenance fee.49 This medley of hidden costs can result in a bill that is up to 45 percent higher than what is advertised.50 It’s also worth noting that Frontier previously charged consumers a $10 monthly router fee, even if they used their own routers. This practice has since become illegal as of early 2020.51
To increase transparency around ISPs’ pricing structures, ISPs should disclose key information about their services in a standardized format, as the FCC encouraged ISPs to do in 2016.52 OTI recommends a format similar to a nutrition label, which we explain in the next section.
Citations
- This plan count excludes six plans with identical monthly prices for different contract terms. The plans excluded are identified in our methodology.
- We calculate the average price for all plans in our dataset using the promotional price for each entry unless it is not available, in which case, we use the non-promotional price instead. Because providers do not always offer plans with promotional pricing or disclose non-promotional pricing, this average captures our dataset most comprehensively.
- “Community Network Map,” Institute for Local Self-Reliance, updated January 2020, source
- Claire Park, Community Broadband: The Fast, Affordable Internet Option That's Flying Under the Radar (Washington, D.C.: New America, 2020), source ;Becky Chao and Lukas Pietrzak, The Cost of Connectivity in Ammon, Idaho, (Washington, D.C.: New America’s Open Technology Institute, January 22, 2020), source
- We exclude any additional fees that apply to plans operating on municipal networks in our analysis. In Ammon, Idaho, for example, consumers of the city’s open access network are subject to an additional monthly utility fee of $16.50 and separate construction fee paid to the city, on top of the monthly price paid to the provider. See Becky Chao and Lukas Pietrzak, The Cost of Connectivity in Ammon, Idaho, (Washington, D.C.: New America’s Open Technology Institute, January 22, 2020), source for more information.
- This comparison only includes monthly internet costs and excludes any additional fees. For the private network comparison, we use the average cost per Mbps based on monthly prices and speeds advertised by AT&T in Lafayette, La.
- This comparison only includes monthly internet costs and excludes any additional fees. See Becky Chao and Lukas Pietrzak, The Cost of Connectivity in Ammon, Idaho, (Washington, D.C.: New America’s Open Technology Institute, January 22, 2020), source for more information.
- Jon Brodkin, “Comcast, Beware: New city-run broadband offers 1Gbps for $60 a month,” Ars Technica, August 30, 2019, source
- Dan Mahoney and Greg Rafert, “Broadband Competition Helps to Drive Lower Prices and Faster Download Speeds for U.S. Residential Consumers,” Analysis Group Whitepaper, November 2016, 21-22, 24, source
- Rafi Goldberg, “Unplugged: NTIA Survey Finds Some Americans Still Avoid Home Internet Use,” National Telecommunications and Information Administration, April 15, 2019, source
- Elise Gould, “Black-white wage gaps are worse today than in 2000,” Economic Policy Institute, February 27, 2020, source
- See, e.g., S. Derek Turner, Digital Denied: The Impact of Systemic Racial Discrimination on Home-Internet Adoption, (Free Press: December 2016), source; Robert Fairlie, “Race and the Digital Divide,” UC Santa Cruz: Department of Economics, UCSC, September 11, 2014, source
- Brian Howard and Traci Morris, Tribal Tech Assessment: The State of Internet Service on Tribal Lands, (American Indian Policy Institute: July 27, 2019), source
- See, e.g., S. Derek Turner, Digital Denied: The Impact of Systemic Racial Discrimination on Home-Internet Adoption, (Free Press: December 2016), source; AT&T has also allegedly engaged in “digital redlining” in Cleveland, Ohio, see, e.g., Bill Callahan, “AT&T’s Digital Redlining Of Cleveland,” National Digital Inclusion Alliance (blog), March 10, 2017, source
- Darrick Hamilton, Preface, Dedrick Asante-Muhammad, Chuck Collins, and Omar Ocampo, White Supremacy is the Preexisting Condition: Eight Solutions to Ensure Economic Recovery Reduces the Racial Wealth Divide, Institute for Policy Studies, June 19, 2020, source; See, also, Ernie Tedeschi and Quoctrung Bui, “Unemployment Tracker: Job Losses for Black Workers Are Deepening,” New York Times, last updated June 16, 2020, source
- Emily A. Vogels, Andrew Perrin, Lee Rainie, and Monica Anderson, “53% of Americans Say the Internet Has Been Essential During the COVID-19 Outbreak,” Pew Research Center, April 30, 2020, source
- Emily A. Vogels, Andrew Perrin, Lee Rainie, and Monica Anderson, “53% of Americans Say the Internet Has Been Essential During the COVID-19 Outbreak.”
- Emily A. Vogels, Andrew Perrin, Lee Rainie, and Monica Anderson, “53% of Americans Say the Internet Has Been Essential During the COVID-19 Outbreak.”
- See, e.g., By Suzanne Woolley, Nikitha Sattiraju, and Scott Moritz, “U.S. Schools Trying to Teach Online Highlight a Digital Divide,” Bloomberg, March 26, 2020,source
- Emily A. Vogels, Andrew Perrin, Lee Rainie, and Monica Anderson, “53% of Americans Say the Internet Has Been Essential During the COVID-19 Outbreak,” Pew Research Center, April 30, 2020, source
- See, e.g., Brian Howard and Mikhail Sundust, “COVID-19: The Impact of Limited Internet Access and Issues with Social Distancing for Native Students,” American Indian Policy Institute, Spring 2020, source
- Jonathan Sallet, “Tell The Story We Know: Broadband Competition is Too Limited,” Benton Institute for Broadband & Society, March 6, 2020, source
- A report from the Benton Institute for Broadband and Society found that low-income participants in the Twin Cities, Minnesota were able to afford internet services offered by non-profit partnership programs at $10 per month. Colin Rhinesmith, Digital Inclusion and Meaningful Broadband Adoption Initiatives, (Evanston, IL: Benton Institute for Broadband and Society, January 2016), source
- This plan count excludes six plans that offer the same monthly price at different contract terms. The excluded plans are disclosed in our “Methodology” section.
- This average was calculated for the 64 plans that offered an initial promotional price of $50 and under and advertised the non-promotional price on their websites. Plans that did not disclose non-promotional prices were excluded from this calculation.
- For instance, community members enrolled in a non-profit partnership program offering internet access for $10 a month have said that increasing the cost to $20 a month would pose financial difficulties. Colin Rhinesmith, Digital Inclusion and Meaningful Broadband Adoption Initiatives, (Evanston, IL: Benton Institute for Broadband and Society, January 2016), source
- This plan count excludes six plans that offer the same monthly price at different contract terms. The excluded plans are disclosed in our “Methodology” section.
- See Becky Chao and Lukas Pietrzak, The Cost of Connectivity in Ammon, Idaho, (Washington, D.C.: New America’s Open Technology Institute, January 22, 2020), source for more information.
- Providers abroad did not appear to advertise similar discounts.
- See, e.g., Xavier Jaravel, The Unequal Gains from Product Innovations: Evidence from the U.S. Retail Sector, The Quarterly Journal of Economics 134, issue 2, (May 2019): 715–783, source
- Bourree Lam, “The Surging Cost of Basic Needs,” Atlantic, June 2, 2016, source
- Sarah Morris, Joshua Stager, Eric Null, Amir Nasr, Becky Chao, Comments of New America’s Open Technology Institute in the Matter of Bridging the Digital Divide for Low-Income Consumers, WC Docket No. 17-287, (February 21, 2018), source
- “Spectrum Internet Assist,” Charter, last accessed May 27, 2020, source
- AT&T provides the fastest speed available at a consumer’s residence. “Frequently Asked Questions,” Low-Cost Home Internet, AT&T, last accessed May 27, 2020, source
- At $5 a month, the AT&T plan charges low-income consumers by 10.42 times more than the average cost of plans in our U.S. dataset.
- Amir Nasr and Claire Park, “The Government Is Severing a Lifeline for Low-Income Americans,” New America Weekly, March 5, 2020, source ; Federal Communications Commission, Fifth Report and Order, Memorandum Opinion and Order on Reconsideration, and Further Notice of Proposed Rulemaking, WC Docket No. 17-287, WC Docket No. 11-42, WC Docket No. 09-197, adopted October 30, 2019, released November 14, 2019,source
- See, e.g. “AT&T to Pay $60 Million to Resolve FTC Allegations It Misled Consumers with ‘Unlimited Data’ Promises,” Federal Trade Commission, November 5, 2019, source
- We calculate this average for the 299 plans that providers advertised both promotional and non-promotional pricing for. Plans that did not disclose either promotional or non-promotional prices are excluded from this calculation.
- We calculate this average for the 140 plans that providers advertised both promotional and non-promotional pricing for. Plans that did not disclose either promotional (meaning that providers did not offer promotional pricing) or non-promotional prices are excluded from this calculation.
- We calculate the size of the price increase for the 140 plans with both advertised promotional and non-promotional pricing by taking the size of the promotional and dividing it by the initial promotional price.
- See David Talbot, Kira Hessekiel, and Danielle Kehl, Community Owned Fiber Networks: Value Leaders in America, (Cambridge, MA: Berkman KleinCenter for Internet & Society, 2017), source
- “14. Acceptable Use,” AT&T Website Terms of Use, AT&T, effective January 2020, source ; “Century Link Website User Agreement,” CenturyLink, effective June 1, 2014, source
- “Terms and Conditions,” Verizon, last accessed May 27, 2020, source
- “AT&T Internet Consumer Fee Schedule,” Legal Policy Center, AT&T, source; “AT&T Internet Consumer Fee Schedule,” AT&T, source
- Caroline Cakebread, “You're not alone, no one reads terms of service agreements,” Business Insider, November 15, 2017, source
- See, e.g., Oren Bar-Gill and Omri Ben-Shahar, “Exit from Contract,” Journal of Legal Analysis, 6 no.1, (October 2014): 151–183, source
- WTFee Survey 2018 Nationally Representative Multi-Mode Survey, (Consumer Reports: January 3, 2019), source
- WTFee Survey 2018 Nationally Representative Multi-Mode Survey, (Consumer Reports: January 3, 2019)
- “Taxes and Surcharges,” Understand My Bill, Frontier, last accessed May 27, 2020, source
- “US cable and fixed telecom bundle rates up to 45% higher than advertised,” GlobalData, September 27, 2019, source
- Jon Brodkin, “US Finally Prohibits ISPs From Charging for Routers They Don’t Provide,” Ars Technica, January 7, 2020, source ; Frontier has also since gone bankrupt.
- Federal Communications Commission, Report and Order On Remand, Declaratory Ruling, and Order, GN Docket No. 14-28, adopted February 26, 2015, released March 12, 2015, 80, source