
Automation Potential for Jobs in Indianapolis
Downloads
Introduction
Today, work as we know it is shifting, and rapidly. Over the next decade and beyond, how will artificial intelligence and automation change work and opportunity in cities like Indianapolis?
The Indianapolis metro area and other communities across the country will be at the front lines of this change.1 Of course, Indianapolis is no stranger to automation and technological change, including both the risks and rewards. Over the last few decades, the region’s manufacturing sector has experienced job loss and technological change. Today, Indianapolis’s tech sector is growing and the city was shortlisted for Amazon’s second headquarters. Looking ahead, rapidly advancing technology will bring new opportunities and challenges for the region.
To prepare for this future, New America will host its second ShiftLabs on May 18th in Indianapolis, Indiana, with support from the Rockefeller Foundation. At the day-long design lab, leaders from the Indianapolis region and across the country—from technology, industry, policy, philanthropy and culture—will come together to consider the impact of technology and automation on work in the greater Indianapolis region and to develop a long-term, place-based vision for opportunity. The Indianapolis ShiftLabs follows the first ShiftLabs on April 20th in Phoenix, Arizona, which New America hosted in partnership with Arizona State University.
To bring a data-driven lens to ShiftLabs, New America partnered with leading labor market analytics company Burning Glass Technologies and their analysis of data to conduct a first-of-its-kind analysis of the potential of automation to impact jobs in the greater Indianapolis region. We ask: Of the thousands of jobs held by Indianapolis workers today, which could be performed by existing technology? Which occupations and skills are at greatest risk of automation, and who holds those jobs today? To answer these questions, we combined and analyzed Burning Glass data on the likelihood of a computer being able to do a job using existing technology, as well as data from the Bureau of Labor Statistics on occupations in Indianapolis and nationally.
To be sure, emerging technologies will also create many jobs, including entirely new jobs that don’t even exist today. This is a familiar pattern—about half of all job growth came from the creation and expansion of brand new jobs. On balance, automation and technology may create more jobs than they eliminate, but predictions of the number and types of jobs that will be created are outside the scope of this study.
The findings of our analysis are clear: Automation will have a widespread impact on jobs in the Indianapolis region in the years ahead, and especially on low-skilled jobs and especially on female workers. In some cases, technology will eliminate high-risk jobs. In many more cases, technology will change them—sometimes dramatically.
Citations
- Throughout this report, when we refer to Indianapolis, we are referring to the Indianapolis metropolitan area of Indianapolis-Carmel-Anderson.
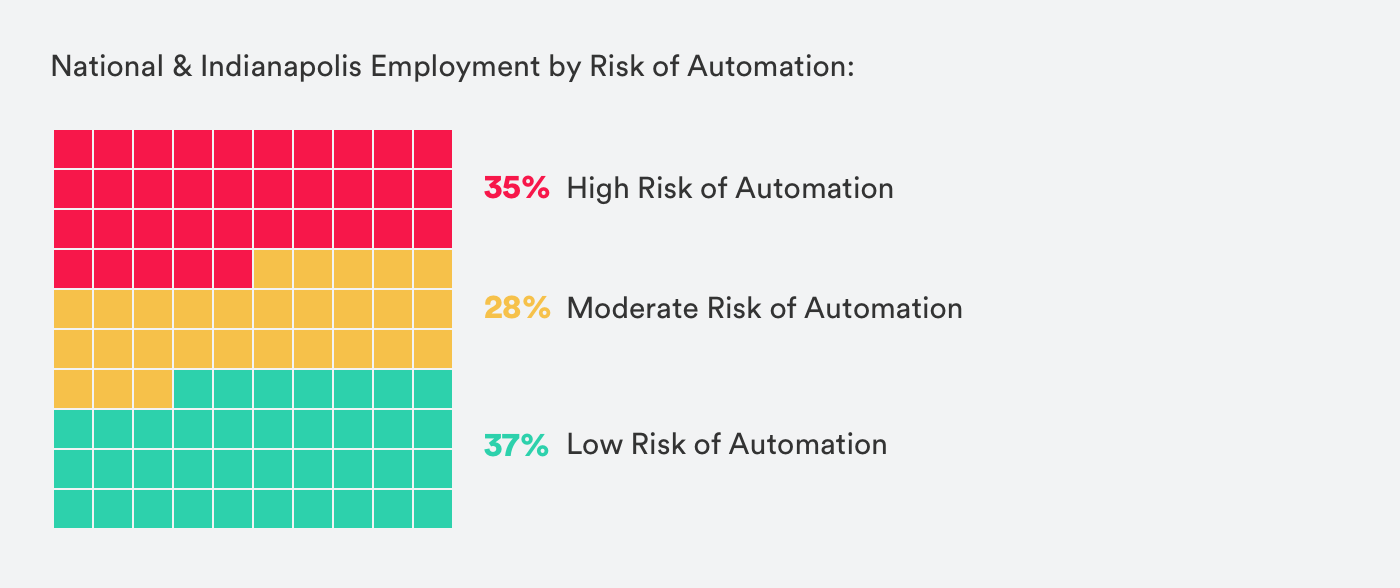
Overview: How Vulnerable are Indianapolis Jobs to Automation?
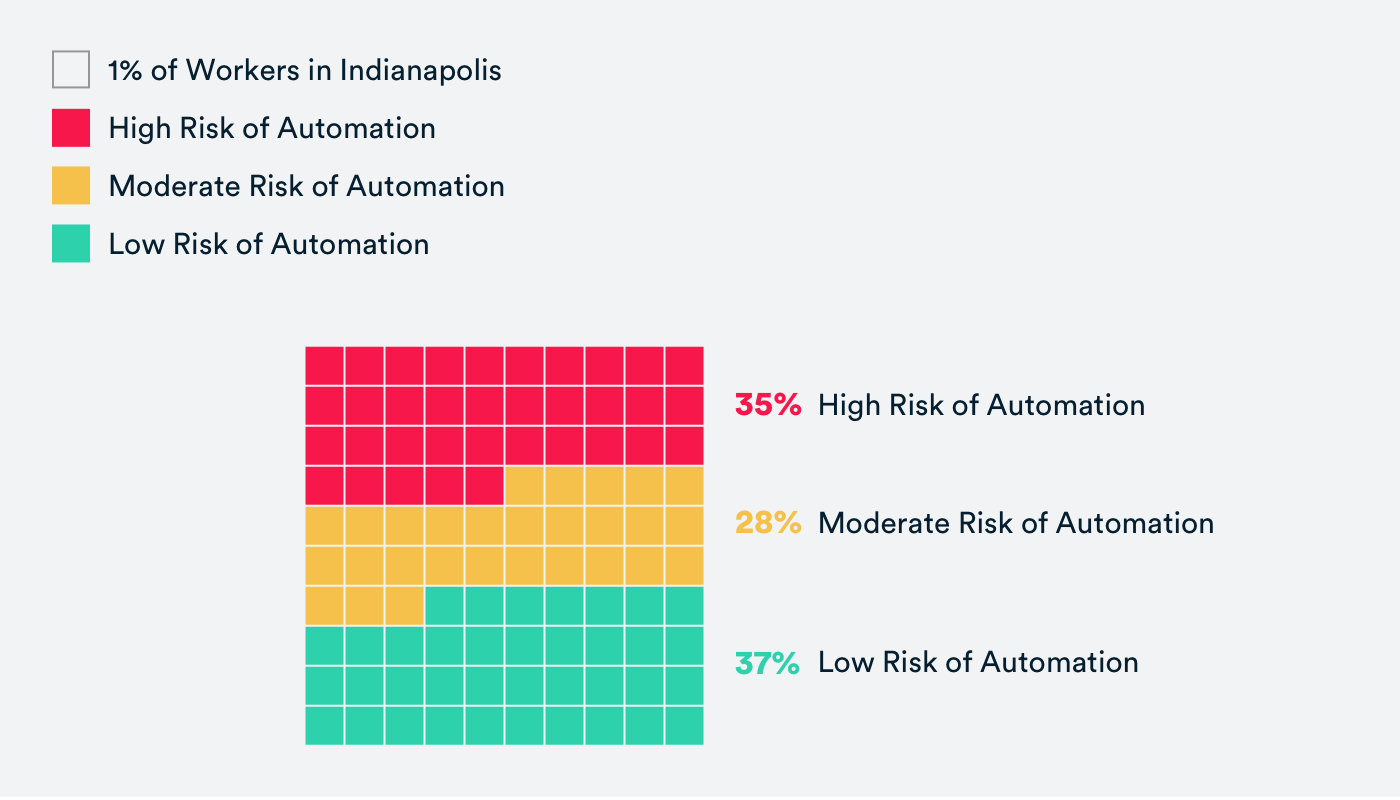
In the Indianapolis-Carmel-Anderson metro area, 337,900 people are employed in occupations that are at high risk of automation—35 percent of total jobs. Another 272,760 jobs (28 percent of total jobs) are at moderate risk of automation. Only a little more than a third (37 percent) are at low risk.
Which Workers in Indianapolis Are Most Vulnerable to Automation?
Workers with less education
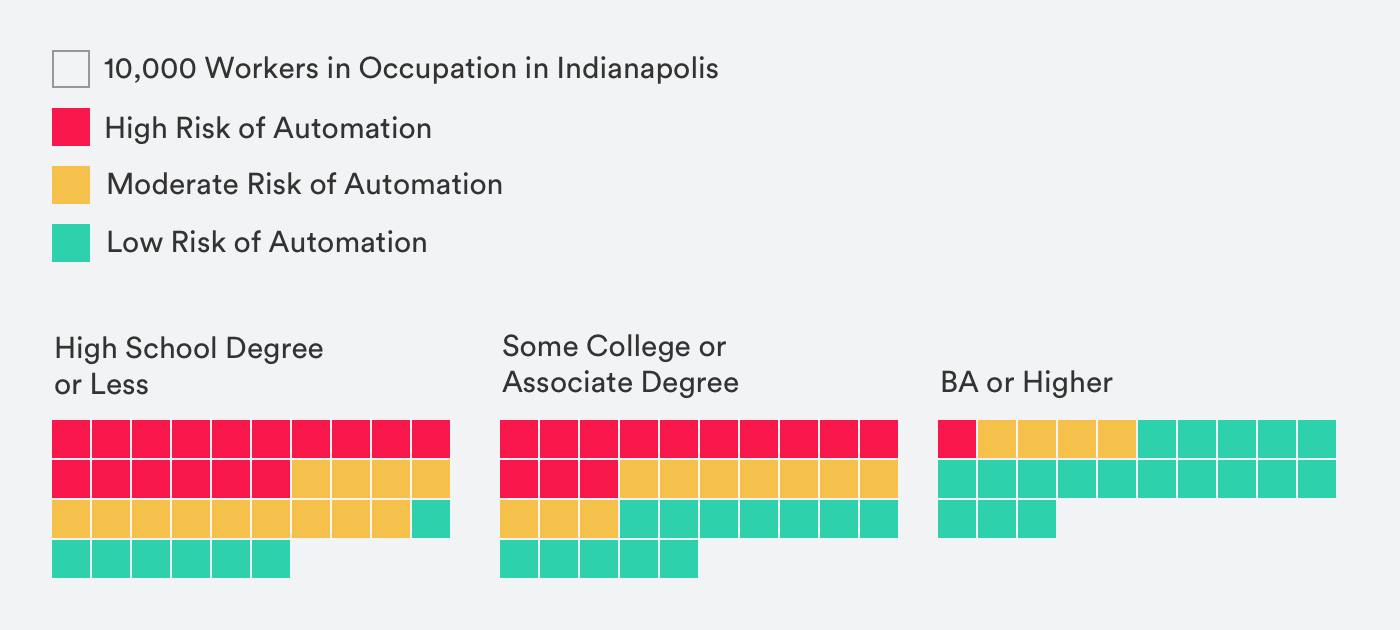
Among workers, the least educated workers are at greatest risk of automation. This is especially true of workers with a high school degree or less, who comprise 47 percent of the workers at high risk of automation in Indianapolis and just 19 percent of workers at low risk. Those numbers are flipped for low-risk jobs: 49 percent of workers in low-risk occupations have a BA or higher, while just 19 percent have a high school degree or less.
Workers who earn the least money
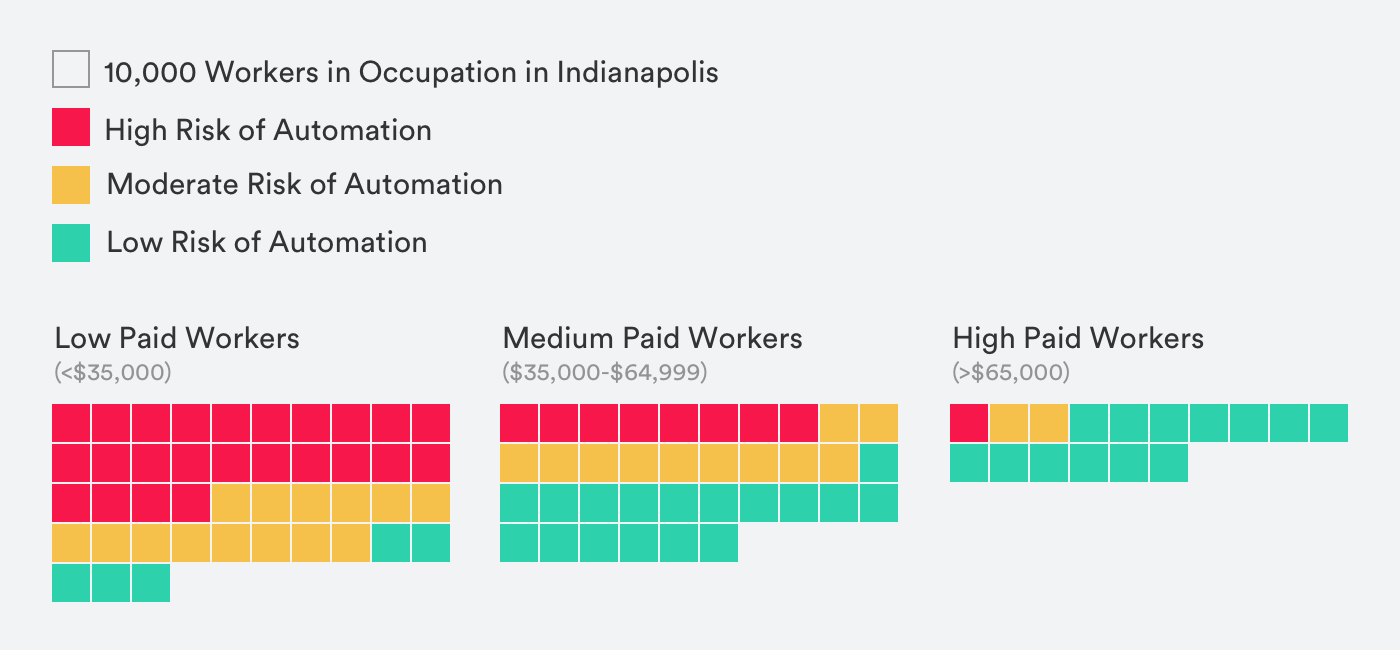
The jobs at high risk of automation are nearly half as well paid, on average, as the jobs at low risk of automation. The average annual salary of workers in the more than 130 jobs that are at high risk of automation is $31,085. Meanwhile, the average salary of the workers in the more than 250 jobs that are at low risk of automation is $66,803—more than double that of the high-risk workers.
Women
The high risk occupations in Indianapolis disproportionately employ women. Applying national averages of women employed across occupations, women constitute 55 percent of workers in high risk occupations in Indianapolis. When the high risk category includes the occupation “laborers and freight, stock and material movers, hand,” which is the largest occupation in the Indianapolis region and is exactly at the border of high and medium risk (85 percent risk of automation), women still constitute just over half (51 percent) of the workers at high risk of occupation. Women dominate in many food and retail-related industries that are especially high risk. For instance:
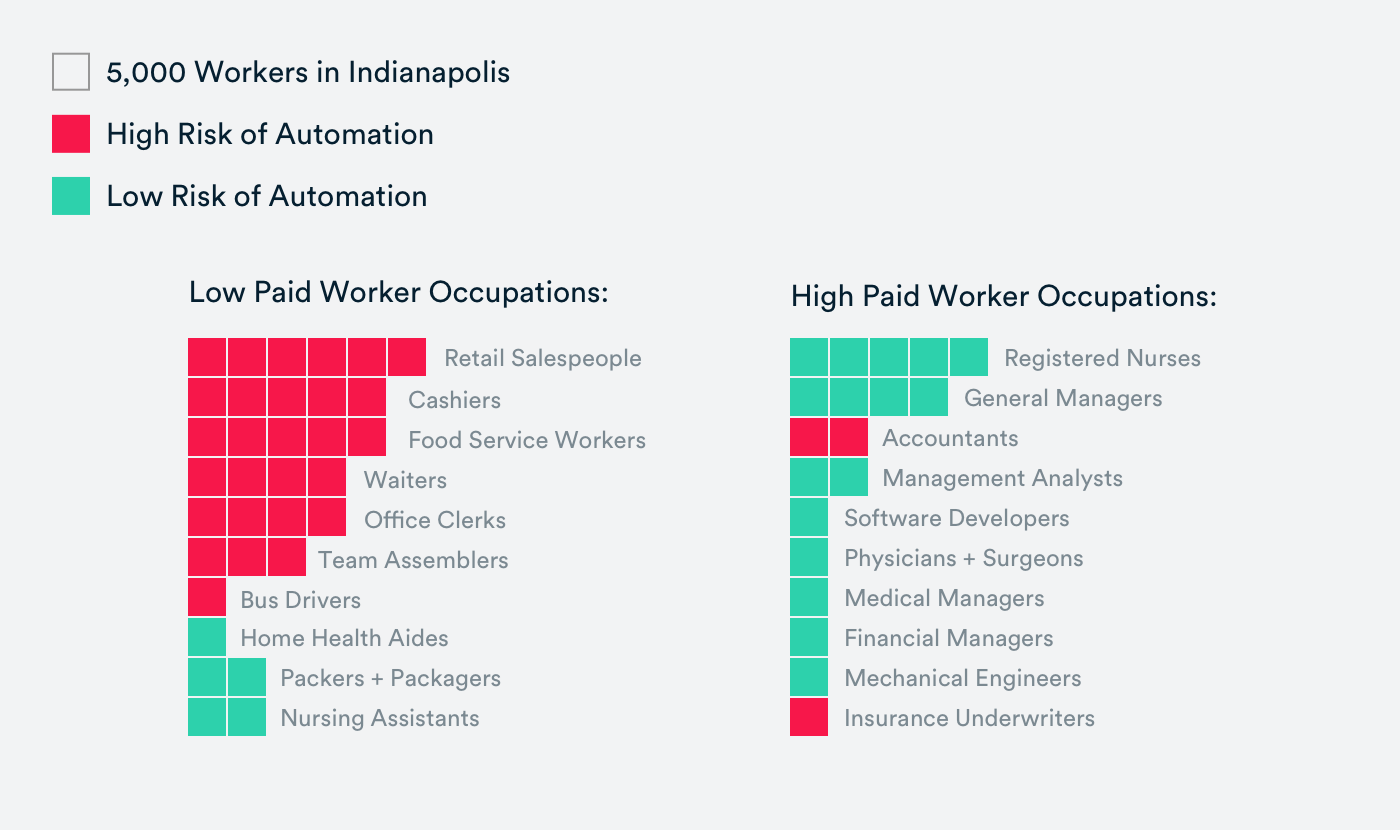
- Cashiers: Over 22,000 people in Indianapolis worked as a cashier – a job with a 97 percent risk of automation. Nationally, 73 percent of cashier jobs were held by women.
- Waiters and waitresses. Just under 19,000 people in Indianapolis worked as a waiter or waitress, which has a 94 percent risk of automation. Nationally, 70 percent of those jobs were held by women.
- Office clerks: More than 18,000 people in Indianapolis worked as office clerks – an occupation with a 96 percent risk of automation. Nationally, 83 percent of those positions were held by women.
- Secretaries and administrative assistants: More than 12,000 people worked as secretaries and administrative assistants in Indianapolis, which carry a 96 percent risk of automation. Nationally, 95 percent of those positions were held by women.
Occupations at Highest and Least Risk
The Largest Occupations Most at Risk
Of the 50 occupations that employ the most people in the Indianapolis metro area (totaling just over half of all workers), the following 18 occupations are the most at risk of automation.
| Pay Scale | OCCUPATION | # of people employed, 2016 | Average salary, 2016 |
|---|---|---|---|
| Retail Salespersons | 30,250 | $24,960 | |
| Combined Food Preparation and Serving Workers, Including Fast Food | 23,890 | $18,530 | |
| Cashiers | 22,760 | $19,670 | |
| Waiters and Waitresses | 18,900 | $22,240 | |
| Low paid <$35k | Office Clerks, General | 18,490 | $32,770 |
| Team Assemblers | 13,100 | $27,770 | |
| Cooks, Restaurant | 8,820 | $23,590 | |
| Shipping, Receiving, and Traffic Clerks | 8,120 | $28,700 | |
| Food Preparation Workers | 8,100 | $20,540 | |
| Industrial Truck and Tractor Operators | 6,090 | $32,740 | |
| Receptionists and Information Clerks | 6,020 | $29,280 | |
| Driver/Sales Workers | 5,460 | $23,790 | |
| Bus Drivers, School or Special Client | 5,410 | $25,530 | |
| Landscaping and Groundskeeping Workers | 5,380 | $26,170 | |
| Construction Laborers | 5,300 | $38,990 | |
| Middle Paid | Secretaries and Administrative Assistants, Except Legal, Medical, and Executive | 12,490 | $35,060 |
| ($35k - $65k) | Bookkeeping, Accounting, and Auditing Clerks | 10,570 | $40,450 |
| High paid > $65k | Accountants and Auditors | 9,200 | $69,420 |
Largest Occupations Least at Risk
Of the 50 occupations that employ the most people in the Indianapolis metro area (or about half of all workers), the following 18 occupations have a low risk of automation.
| Pay Scale | OCCUPATION | # of people employed, 2016 | 2016 average salary |
|---|---|---|---|
| Packers and Packagers, Hand | 9,910 | $22,880 | |
| Low paid (<$35k) | Nursing Assistants | 8,770 | $26,130 |
| Home Health Aides | 5,190 | $23,360 | |
| First-Line Supervisors of Office and Administrative Support Workers | 10,430 | $56,880 | |
| First-Line Supervisors of Retail Sales Workers | 8,390 | $43,130 | |
| Elementary School Teachers, Except Special Education | 8,150 | $50,880 | |
| Middle paid ($35k - $65k) | Sales Representatives, Services, All Other | 7,230 | $58,450 |
| Business Operations Specialists, All Other | 6,690 | $64,360 | |
| Secondary School Teachers, Except Special and Career/Technical Education | 5,760 | $54,560 | |
| Human Resources Specialists | 5,200 | $57,360 | |
| Licensed Practical and Licensed Vocational Nurses | 4,880 | $42,690 | |
| Computer User Support Specialists | 4,850 | $54,400 | |
| Registered Nurses | 23,640 | $63,340 | |
| Management Analysts | 6,740 | $76,030 | |
| High paid ( $65k - $90k) | Managers, All Other | 5,690 | $73,400 |
| Software Developers, Applications | 5,470 | $83,530 | |
| Top paid > $90k | General and Operations Managers | 17,600 | $107,990 |
| Physicians and Surgeons, All Other | 5,250 | $215,140 |
Top 50 Occupations by Number of People Employed
| OCCUPATION | # of people employed, 2016 | Risk level | Mean salary, 2016 |
|---|---|---|---|
| Laborers and Freight, Stock, and Material Movers, Hand | 34,190 | Medium Risk | $28,630 |
| Retail Salespersons | 30,250 | High Risk | $24,960 |
| Combined Food Preparation and Serving Workers, Including Fast Food | 23,890 | High Risk | $18,530 |
| Registered Nurses | 23,640 | Low Risk | $63,340 |
| Cashiers | 22,760 | High Risk | $19,670 |
| Customer Service Representatives | 22,470 | Medium Risk | $37,350 |
| Waiters and Waitresses | 18,900 | High Risk | $22,240 |
| Heavy and Tractor-Trailer Truck Drivers | 18,730 | Medium Risk | $48,970 |
| Office Clerks, General | 18,490 | High Risk | $32,770 |
| General and Operations Managers | 17,600 | Low Risk | $107,990 |
| Janitors and Cleaners, Except Maids and Housekeeping Cleaners | 14,660 | Medium Risk | $24,630 |
| Team Assemblers | 13,100 | High Risk | $27,770 |
| Secretaries and Administrative Assistants, Except Legal, Medical, and Executive | 12,490 | High Risk | $35,060 |
| Stock Clerks and Order Fillers | 12,350 | Medium Risk | $26,400 |
| Sales Representatives, Wholesale and Manufacturing, Except Technical and Scientific Products | 11,370 | Medium Risk | $72,680 |
| Bookkeeping, Accounting, and Auditing Clerks | 10,570 | High Risk | $40,450 |
| First-Line Supervisors of Office and Administrative Support Workers | 10,430 | Low Risk | $56,880 |
| Maintenance and Repair Workers, General | 10,000 | Medium Risk | $39,200 |
| Packers and Packagers, Hand | 9,910 | Low Risk | $22,880 |
| Accountants and Auditors | 9,200 | High Risk | $69,420 |
| Cooks, Restaurant | 8,820 | High Risk | $23,590 |
| Nursing Assistants | 8,770 | Low Risk | $26,130 |
| First-Line Supervisors of Retail Sales Workers | 8,390 | Low Risk | $43,130 |
| Personal Care Aides | 8,250 | Medium Risk | $21,210 |
| Elementary School Teachers, Except Special Education | 8,150 | Low Risk | $50,880 |
| Shipping, Receiving, and Traffic Clerks | 8,120 | High Risk | $28,700 |
| Food Preparation Workers | 8,100 | High Risk | $20,540 |
| Security Guards | 8,060 | Medium Risk | $25,200 |
| First-Line Supervisors of Food Preparation and Serving Workers | 7,240 | Medium Risk | $32,790 |
| Sales Representatives, Services, All Other | 7,230 | Low Risk | $58,450 |
| Teacher Assistants | 6,900 | Medium Risk | $23,940 |
| Management Analysts | 6,740 | Low Risk | $76,030 |
| Business Operations Specialists, All Other | 6,690 | Low Risk | $64,360 |
| Light Truck or Delivery Services Drivers | 6,550 | Medium Risk | $33,410 |
| Industrial Truck and Tractor Operators | 6,090 | High Risk | $32,740 |
| Receptionists and Information Clerks | 6,020 | High Risk | $29,280 |
| Maids and Housekeeping Cleaners | 5,760 | Medium Risk | $21,410 |
| Secondary School Teachers, Except Special and Career/Technical Education | 5,760 | Low Risk | $54,560 |
| Managers, All Other | 5,690 | Low Risk | $73,400 |
| Software Developers, Applications | 5,470 | Low Risk | $83,530 |
| Driver/Sales Workers | 5,460 | High Risk | $23,790 |
| Bus Drivers, School or Special Client | 5,410 | High Risk | $25,530 |
| Landscaping and Groundskeeping Workers | 5,380 | High Risk | $26,170 |
| Construction Laborers | 5,300 | High Risk | $38,990 |
| Physicians and Surgeons, All Other | 5,250 | Low Risk | $215,140 |
| Human Resources Specialists | 5,200 | Low Risk | $57,360 |
| Home Health Aides | 5,190 | Low Risk | $23,360 |
| Carpenters | 4,980 | Medium Risk | $44,490 |
| Licensed Practical and Licensed Vocational Nurses | 4,880 | Low Risk | $42,690 |
| Computer User Support Specialists | 4,850 | Low Risk | $54,400 |
How Does Indianapolis Differ From the U.S. Average?
Overall, the risk of automation facing workers in the Indianapolis region is exactly on par with the rate of risk across the U.S. workforce overall.
Looking more closely at specific occupational groups within the economy, there are some pockets of greater vulnerability and greater resilience.
Ways the Indianapolis area workforce is more resilient to automation than the nation overall
- Management, business and finance have a low risk of automation. As a percent of employment, Indianapolis’s population has 10 percent more workers in management positions than the national average, and 10 percent more workers in business and financial operations, both of which carry a low risk of automation.
- Compared to the national average, Indianapolis has 17 percent more workers in healthcare practitioner and technician positions, such as pediatrician or audiologists. These healthcare positions have a low risk of automation.
Ways the Indianapolis area workforce is more vulnerable to automation than the national overall
A far greater share of Indianapolis’s workforce is employed in transportation and material moving than the rest of the country. Indianapolis has 46 percent more of these jobs compared to the U.S. overall. This overall group of occupations has a medium risk overall, and includes several occupations with a high risk of automation including several types of drivers.
Indianapolis area employees are less well-represented in certain low-risk occupational groups than the national average. For instance, education, training and library occupations are at very low risk of automation. Indianapolis has 34 percent fewer workers in these occupations than the national average. Nationally, 73 percent of those positions are held by women. Thus, compared to the rest of the country, Indianapolis has significantly fewer low-risk jobs in education that overwhelmingly employ women.
Data and Methodology
What Do We Mean by Automation and Risk of Automation?
In our analysis, the rankings of automation risk describe the technical feasibility that an occupation can be computerized or automated with start-of-the-art technology available today. This data comes from Burning Glass Technologies, and is derived largely from a well known 2013 study from two researchers at Oxford, Carl Benedikt Frey and Michael A. Osborn. To calculate the automation risk, the Oxford researchers evaluated the ability of computers to perform the underlying tasks associated with the given occupation.
- “High risk” occupations are the top quartile of risk, with at least 85 percent risk of automation for a given occupation.
- “Medium risk” occupations are in the second quartile of risk, between 50 percent and 85 percent risk of automation for a given occupation.
- “Low risk” occupations are in the bottom two quartiles, with less than 50 percent risk.
A few key caveats are important to consider when interpreting the data.
First, the rankings are not a probability that a given job will actually be automated. Because a job or task can technically be done by a computer does not mean that it will. A range of legal, logistical, business, financial, political, and social factors could lower the real rate at which businesses and employers adopt technology and automate functions. Moreover, predictions about technology have a relatively high degree of uncertainty.
Second, jobs that have some tasks that can technically be automated will not necessarily be displaced. Instead, the nature of many jobs will change—in some cases, dramatically—but will not be eliminated. (McKinsey estimates that just 5 percent of jobs will be outright eliminated, but that half of job tasks could be automated.) The implication of this change is the need for workers in at risk occupations to continuously upskill to keep pace with the changing requirements of their occupation.
Finally, while technology and automation will displace some jobs and change others, new jobs will also be created and other jobs will expand. Our analysis does not capture the impact of projected job creation.
Notes on the Data
- The data on automation potential comes from Burning Glass Technologies, which is derived largely from a well known 2013 study from two researchers at Oxford, Carl Benedikt Frey and Michael A. Osborn, titled “The Future of Employment: How Susceptible are Jobs to Computerisation?”
- Occupational and wage data for the Indianapolis metropolitan area is from the Bureau of Labor Statistics and covers the period from January 1, 2017 to December 31, 2017. The geographic area spans Indianapolis, counties.
- Data on national averages of women in occupations comes from the Bureau of Labor Statistics.
- Data on education levels of employed individuals comes from the American Community Survey (ACS) five-year estimates (2011 – 2015).
More About the Authors