Ben Miller
Former Higher Education Research Director, Education Policy Program
$29,400 is a lot of money. Forty percent of working-age adults earn less than that in a year. It is nearly 80 percent of the average income for a young adult in the United States. For bachelor’s degree graduates who leave college with loan debt, it is also the average tab they can expect to pay back over the next few decades.

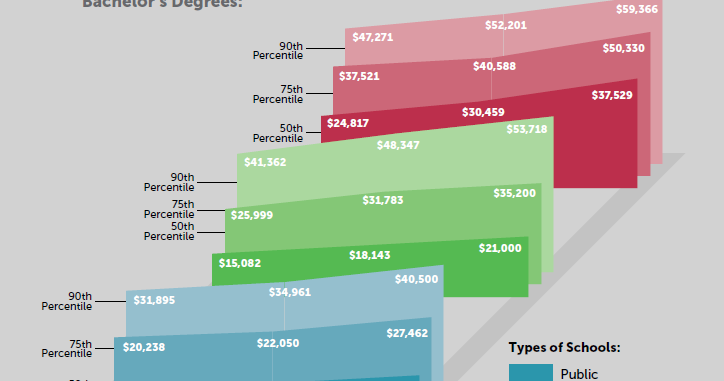
The $29,400 figure is from the latest release of the quadrennial National Postsecondary Student Aid Study (NPSAS), a national survey of student financial aid conducted by the U.S. Department of Education. The most recent iteration of the study, which was released in fall 2013, presents a predictably dire picture of college students in the 2011-12 academic year—nearly 70 percent of students who graduated with a bachelor’s degree in 2012 took out debt for their education (above), and those with loans owed $29,400 on average (below). That represents an increase of nearly 20 percent in real terms over just four years. And it is a record high in both the percentage borrowing and average amount owed.

However, topline numbers only provide a limited snapshot of underlying trends. In reality, students pursuing different types of credentials, and attending different public and private institutions, experience greatly varying levels of debt. Moreover, aggregate debt figures can mask or exaggerate variation at the extremes of the data.
Today, New America is releasing “The Student Debt Review,” which looks at the cumulative loan debt (both public and private) taken on by students who graduated[1. This report focuses only on students that earned a certificate, associate degree, or bachelor’s degree in the NPSAS administration year. Whether a student completed is not verified by transcript data. Instead, it is based upon either self-reported information or sometimes institutional records indicating that the student already has or is expected to earn a credential in the NPSAS administration year. As a result, it is possible that students may say they are going to graduate but in fact not end up doing so or that a student ends up graduating who did not indicate that they would. The rate at which actual completion status differs from the reported status is not known. When NCES attempted to check the completion status of reported bachelor’s degree graduates from the 2007-08 NPSAS it found that 83.6 percent of those who said they graduated had done so, 5.9 percent had not, and 10.5 percent did not have any transcript data to verify the accuracy of their claim. None of the estimates have been adjusted to account for possible differences in reported versus actual completion.] from college in the last three NPSAS administrations (2011-12, 2007-08, 2003-04). It presents charts laying out how the rate and amounts of student loan debt have changed over the past eight years, breaking the data down to look at specific types of credentials and institutions attended.
The “Student Debt Review” finds that there were gradual, across-the-board growth in student debts across different institutions and credentials between 2003-04 and 2007-08, and much faster increases in borrowing between 2007-08 and 2011-12. It also finds, in that time period, that the number of undergraduate students with debt increased from 1.6 million to 2.4 million, and that the typical bachelor’s degree completer with student debts now pays approximately $79 more every month. Finally, it shows especially rapid rises in student debt at private for-profit colleges: bachelor’s degree graduates at these institutions, for instance, now pay $95 more each month than their peers in 2003-04, and $153 more than students earning the same credential at public colleges (below).


To learn more, go ahead and read the whole report.
Former Higher Education Research Director, Education Policy Program