Lisa Guernsey
Senior Director, Birth to 12th Grade Policy; Co-Founder and Director, Learning Sciences Exchange
Educators Try New Tools at Pittsburgh Humanities+Tech Event
Walking into Carnegie Library of Pittsburgh-Main in Oakland, with its high ceilings, arched windows, and wood paneling, you can’t help but feel a connection to days past, when visitors to the library sat in hushed silence and leafed through old books. But on a Saturday last month, that history merged with modern models of learning emerging from brightly lit screens, data visualizations, interactive maps, and new ways of searching for knowledge.
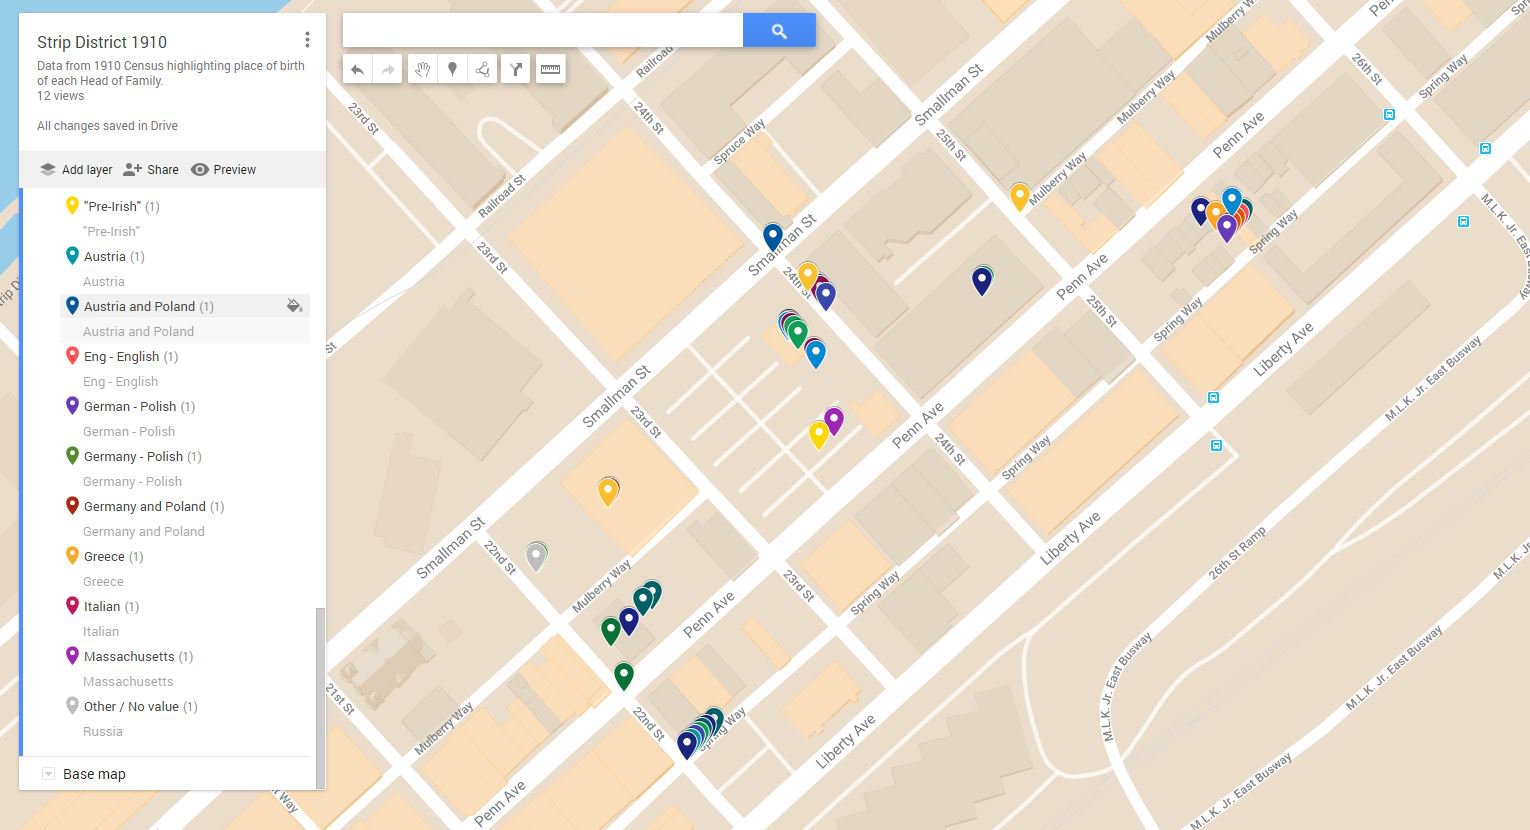
The Library was the site of a special workshop, Neighborhood Stories: Looking Into the Past to Map the Future, designed to introduce educators across the region to techniques for taking advantage of digital maps while simultaneously taking stock of history. On the screen at the front of the room was a street map of Pittsburgh, populated with dropped pins that represented the addresses of individual households. Each address was a data point collected during the 1910 U.S. Census, with different colors depicting different countries of origin for the heads of households. In just one neighborhood, for example, pinpoints depicted Austria, Ireland, Poland, Scotland, and Italy.
Amanda McAllen, school and teacher coordinator at the Senator Heinz History Center, demonstrated how students, with teachers’ guidance, could use Google mapping software and data from digitally scanned copies of old Census documents to visualize the various nationalities and ethnicities that shaped their city more than 100 years ago. “You can see,” McAllen said, pointing to the map (see screenshot above), “we have a kaleidoscope of colors popping up here.”
The workshop was the second in a series of events, Overcoming Obstacles to Connection: A Humanities+Tech Approach, run by New America and local partners in Pittsburgh and the Southwestern Pennsylvania region. The October 5 event was held in partnership with Carnegie Library of PIttsburgh to accompany the annual Historic Pittsburgh Fair. In addition to the Heinz History Center, it also featured the CREATE Lab at Carnegie Mellon University and the National Humanities Center. The goal: to use maps not just to teach geography but to help students see relationships between people, places, and time in their own neighborhoods and in the wider world.
“Geospatial thinking is more than a dot on a map,” said Andy Mink, vice president for education programs at the National Humanities Center, who displayed maps of all kinds (including a trade map, right, from the U.K. National Archives titled Indian Nations between South Carolina and Mississippi River, c. 1725 ) as part of a keynote address over lunch. “Maps tell stories.”
Another map on display that morning was from EarthTime, an open-source data visualization and mapping program developed by the CREATE Lab. Ryan Hoffman, a project manager for the Lab, showed how EarthTime can help students visualize how landscapes are changing as a result of floods or water shortages (such as the shrinking of Lake Mead near Las Vegas) or how layers of data on refugee migration shows the effect of the war in Syria. “We want to encourage teachers to use this and take an inquiry-based approach,” Hoffman said. The idea is that students cannot help but ask: “What is happening here?”
Later in the workshop, Sunanna Chand, director of Remake Learning, a Pittsburgh-based organization dedicated to “igniting engaging, relevant, and equitable learning practices,” took the concept of digital mapping to yet another level. She started by giving the audience a deeper look at the connections within the Remake Learning Network, such a Remake Learning’s Maker Spaces Map and its Rural Remake Learning network. Chand said that the organization’s goal is to “not just make these networks open but to be more inclusive, intentionally.” Her remarks helped to lay bare a question that existed throughout the day: Who is not on the map? And why? She ended her remarks by asking educators and interested community members to help: “What are some things you still don’t see in our storytelling?”
The question matched a broader set of questions being asked throughout the Humanities+Tech event series, which was designed to create ways for people across the region to hear different perspectives on the role of technology in their lives, while simultaneously helping to connect programs that harness the power of the humanities to promote more thoughtful, inclusive tech use. The series (using the hashtag #connectedconversations) started in July with an event at the Falk Laboratory School, titled Learning Power: Examining the Future Of Education Amid Automation and Artificial Intelligence. That event provided attendees a chance to jot down their thoughts about the promise and pitfalls of different types of digital media in learning environments. Attendees could also speak their mind on video, and some of their ideas come through in this video of clips captured by local students working with Steeltown Entertainment, another partner in the Humanities+Tech project. Steeltown also captured educators’ thoughts after the mapping workshop and those videos will be posted in the coming months.
The next event is Crafting Pathways: Makers and the Future of Work in Appalachia, and will focus on the vital role of artisans and makers as cultural hallmarks and economic engines of rural communities in the region. The event will be held in partnership with Remake Learning’s Rural Network and West Virginia University on December 4 from 11:30am-1:30pm in Morgantown on the West Virginia University campus. Learn about the economic argument for makers, how makers are actually well-positioned to thrive in a rapidly changing future of work, and how policy can better support craft manufacturing. Registration is now open.
Resources highlighted at the October 5 Neighborhood Stories event:
Additional resources noted by participants:
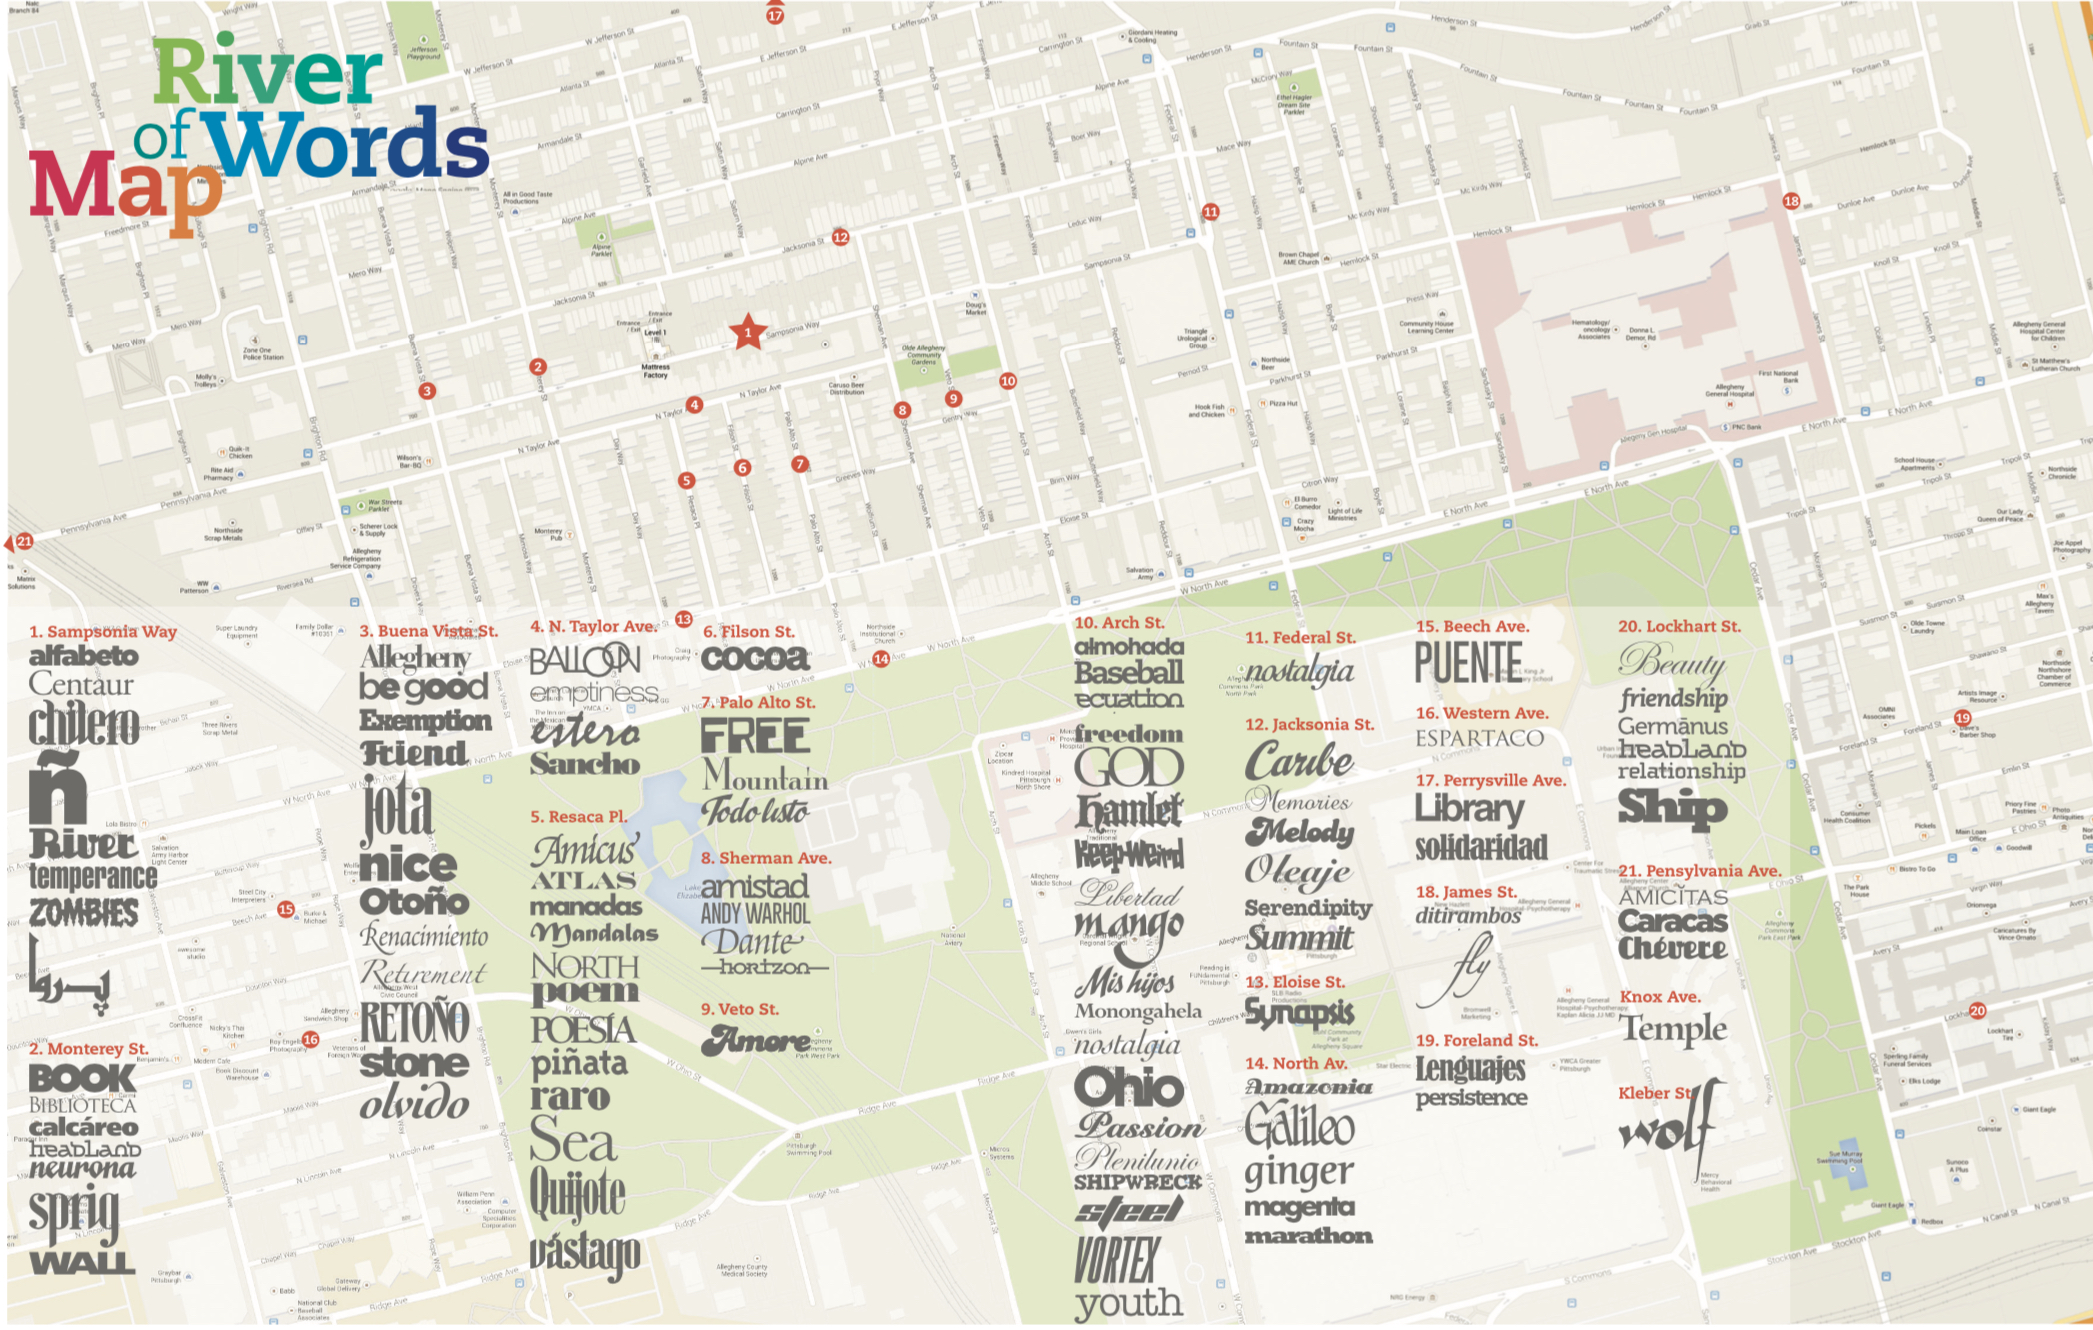
Also of note: In the weeks after the event, New America Fellow Deborah Fallows wrote in The Atlantic about yet another map that is activating the imagination of Pittsburgh residents: a map of a public art project by artist Israel Centeno called River of Words, in which residents are enlisted to help paint words of all kinds on doorways and fences across the city. The words are ones that, Fallows wrote, “held some special meaning for Pittsburgh and his evolving experience there.”
Enjoy what you read? Subscribe to our newsletter to receive updates on what’s new in Education Policy!
Senior Director, Birth to 12th Grade Policy; Co-Founder and Director, Learning Sciences Exchange