Varying Degrees 2018
Table of Contents
- Executive Summary
- Explore the Data
- Introduction
- Americans believe well-paying jobs require education after high school.
- Americans believe education after high school creates opportunities.
- Americans want change in higher education.
- Americans believe public colleges and universities are worth the cost but feel more mixed about private and for-profit colleges and universities.
- Regardless of demographic, Americans like their local colleges and universities.
- Americans support workforce-based programs such as apprenticeships.
- Americans believe higher education is a public benefit and that the government should do more to make it affordable.
- Perception versus reality
- North Carolina
- Institutional Profile: Elon University
- Apprenticeship Program Profile: Siemens Charlotte
Acknowledgments
For 2019 data see here.
For 2017 data see here.
This work was made stronger by the insights and knowledge of an advisory board of researchers and higher-education experts:
- Beth Akers, Manhattan Institute
- Erin Knepler, NORC at the University of Chicago
- Jee Hang Lee, Association of Community College Trustees
- Nick Lee, Bill & Melinda Gates Foundation
- Deborah Santiago, Excelencia in Education
- Ariel Ventura-Lazo, George Mason University
- Maeve Ward, Bill & Melinda Gates Foundation
- Jaime Zapata, GMMB
The authors would also like to thank the practitioners who graciously shared success stories, particularly Orkhan Patsiyev, Roger Collins, and Dr. Rodney Parks.
Varying Degrees was funded by the Bill & Melinda Gates Foundation. New America thanks the Foundation for its support.
Downloads
Executive Summary
For 2019 data see here.
For 2017 data see here.
After years of economic growth following the Great Recession, people still feel anxious about the economy and see higher education as essential for improving personal financial circumstances. While New America’s second annual survey about perceptions on higher education shows that Americans believe pursuing education beyond high school is important for career growth and economic security, they still feel that higher education is not fine the way it is, and that government should do more to make it affordable.
Varying Degrees 2018: New America’s Second Annual Survey on Higher Education surveyed 1,600 Americans ages 18 and older to better understand their perceptions of higher education, economic mobility, and government funding. Like last year, the survey shows unifying themes, as well as differences across various demographics when it comes to the value of education beyond high school in today’s economy and the government’s role in funding this education. We pay particular attention to the similarities and differences of opinion among Republicans, Democrats, and Independents in this election year.
Our top findings include:
- Americans believe well-paying jobs require education after high school. Less than half (48 percent) believe there are well-paying jobs that do not require education after high school.
- Americans believe education after high school creates opportunities. Most Americans (80 percent) believe there are more opportunities for those who pursue education after high school versus only 14 percent who say there is more opportunity for those who pursue work right away.
- Americans want change in higher education. Like last year, only one in four Americans believes that higher education is fine the way it is.
- Americans believe public colleges and universities are worth the cost but feel mixed about private and for-profit colleges and universities. A majority of Americans say community colleges and public four-year colleges and universities are worth the cost (81 percent and 65 percent, respectively). Whereas only about two in five Americans believe that private (44 percent) and for-profit (40 percent) colleges and universities are worth the cost.
- Regardless of demographics, Americans like their local colleges and universities. Four out of five (81 percent) have a positive view of the higher education institutions near them.
- Americans support workforce-based programs such as apprenticeship. There is wide agreement (90 percent) that apprenticeships and skills training programs prepare students for a good standard of living.
- Americans believe higher education is a public benefit and that the government should do more to make it affordable. A majority (60 percent) believe government should spend tax dollars on higher education because it is good for society, compared with 27 percent who say students should fund it because higher education is a personal benefit. Over three-quarters of Americans think state and federal government should spend more tax revenue on higher education to make it more affordable.
Methodology
These findings come from an Ipsos dual frame landline/cell phone poll conducted between January 18, 2018 and February 8, 2018. A sample of 1,000 adults, aged 18 and over, from the continental United States, Alaska, and Hawaii were randomly selected and interviewed in English or Spanish; half of respondents were reached on a cell phone. There were oversamples of 150 African Americans, Hispanic Americans, Asian Americans, and residents of North Carolina, respectively, for a total sample size of 1,600.1
All sample surveys and polls may be subject to sources of error, including, but not limited to, coverage error and measurement error. Based on the sample size (+/-3.0), common assumptions about the distribution of the underlying population, and potential design effect (+/-1.3), our poll has a margin of error of plus or minus 4.3 percentage points for all respondents.
Citations
- Oversampling is a process by which certain demographic quotas are increased to shed light on subpopulations that would be too small to accurately report representative findings for that group. The North Carolina oversample was not included in the overall sample size to prevent biasing the national results. For more about oversampling, see Andrew Mercer, “Oversampling is Used to Study Small Groups, Not Bias Poll Results,” FactTank: News in the Number [blog], October 25, 2016, source">www.pewresearch.org/fact-tank/2016/10/25/oversampling-is-used-to-study-small-groups-not-bias-poll-results/.
Explore the Data
Varying Degrees: New America’s Annual Survey on Higher Education surveys 1,600 Americans ages 18 and older to better understand their perceptions of and knowledge about higher education and economic mobility. The survey shows unifying themes as well as differences across age, gender, generation, region, and socioeconomic status when it comes to the value of a college education, who is responsible for student success, the ideal role of government, and the goal of higher education.
Error: Data visualization bundle URL missing.
Introduction
This midterm election year, with many members of Congress retiring and President Trump’s approval ratings among the lowest of any modern president at this point in his tenure, it is clear that change is coming.1 Once the votes are counted, members of Congress, both new and longtime members, will be tasked with updating signature pieces of legislation. Since it has been 10 years since the last reauthorization of Higher Education Act, the law that governs most federal higher-education policy including financial aid, its reauthorization is likely to be high on the priority list.
How Americans feel about higher education will help inform policy and funding decisions that affect current and prospective college students and their families. This is why nationally representative survey data focused on higher education are so important. New America’s own survey data this year show that only one in four Americans thinks higher education is fine the way it is, indicating that higher education, for a variety of reasons—from concerns about affordability to quality of education to employment outcomes—is not delivering on its promise.
In terms of American sentiment by political party identification, a lot of headlines have been made from recent survey data that show Republicans in particular feel negatively about higher education. According to a survey from Pew, over half of Republicans (58 percent) believe higher education is having a negative impact on the way things are going in this country, compared with 19 percent of Democrats.2 A survey from Gallup showed that two-thirds of Republicans only had some or very little confidence in higher education, compared with 43 percent of Democrats who felt that way.3
Are Republicans souring on higher education? The answer is more mixed than headlines would have people believe. Our data show that a slight majority of Republicans (52 percent) believes students should fund their own higher education because it is a personal benefit compared with 76 percent of Democrats who believe government should spend tax revenue on higher education because it is good for society. However, approximately three out of five Republicans are comfortable with their taxes going to support higher education. And although Pew data showed that Republicans believe higher education is having a negative impact on the way things are going in this country, New America’s data show that 78 percent of Republicans feel positive about the colleges and universities located near them.
Although New America’s survey explores opinions across multiple demographics and year-over-year changes, these data by party identification are important for understanding higher education in an election year. They shed light on the similarities and differences among Democrats, Republicans, and Independents on their thoughts and feelings about the value of higher education and how it should be funded.
Citations
- Historical approval ratings beginning with President Truman can be viewed on FiveThirtyEight. FiveThirtyEight currently calculates a net approval rating for President Trump that it revises depending on each poll's quality, recency, sample size and partisan lean. For more information, visit Nate Silver, “How Popular/Unpopular is Donald Trump?” FiveThirtyEight, updated April 27, 2018, source">source.
- Pew Research Center, “Sharp Partisan Divisions in Views of National Institutions,” July 10, 2017.
- Frank Newport and Brian Busteed, “Why Are Republicans Down on Higher Ed?” Gallup, August 16, 2017.
Americans believe well-paying jobs require education after high school.
Less than half agree (48 percent) that there are lots of well-paying jobs that do not require education after high school. This year, we asked half the sample if there are well-paying jobs that do not require education after high school, and the other half if there are well-paying jobs that do not require college. When the idea of higher education is narrowed to just college, people are more likely to agree (57 percent) that there are well-paying jobs that do not require college. In other words, higher education is seen as beneficial, but that education does not have to be college.
Error: Data visualization bundle URL missing.
Error: Data visualization bundle URL missing.
Findings by Party Identification
Republicans, regardless of how the question is asked, believe there are lots of well-paying jobs that do not require education after high school. Two-thirds of Republicans believe there are lots of well-paying jobs that do not require college (68 percent) compared with 51 percent of Democrats and 53 percent of Independents. A majority of Republicans (61 percent) also believe there are lots of well-paying jobs that do not require education after high school, compared with only 40 percent of Democrats and 48 percent of Independents.
Error: Data visualization bundle URL missing.
Error: Data visualization bundle URL missing.
Other Findings
By Race and Ethnicity
Fifty-seven percent of African American respondents and 62 percent of Hispanic respondents believe that there are well-paying jobs that do not require college. When the scope of the question was expanded to ask whether there are well-paying jobs that do not require education after high school, only 40 percent of African American respondents and 47 percent of Hispanic respondents agreed, a significant drop. The magnitude of the drop from last year’s survey for white respondents (which fell from 60 percent to 52 percent) and Asian American respondents (from 45 percent to 43 percent) was not as large.
Error: Data visualization bundle URL missing.
Error: Data visualization bundle URL missing.
By Generation
Phrasing the question differently does not change how Millennials think about the job prospects for people without any sort of postsecondary education.1 Approximately 49 percent of Millennials agree that there are lots of well-paying jobs that do not require college and a similar share, 52 percent, believe that many well-paying jobs are available without education after high school.
Generation X respondents and Baby Boomers, on the other hand, are significantly less likely to believe there are well-paying jobs without any education after high school than when the question is narrowed to ask about “jobs that do not require college.”
Error: Data visualization bundle URL missing.
Citations
- For the purposes of this analysis, the age breakdown by generation is as follows: Generation Z includes 18- to 23-year-olds, Millennials include 24- to 38-year-olds, Generation X includes 39- to 53-year-olds, Baby Boomers include 54- to 72-year-olds, and the Silent Generation includes those over 72.
Americans believe education after high school creates opportunities.
Most Americans (80 percent) believe there are more opportunities for those who pursue education after high school, versus only 14 percent who say there are more opportunities for those who pursue work right away.
Error: Data visualization bundle URL missing.
Further evidence of the importance of a college credential: 63 percent believe that it is harder to be successful without a higher education degree. When focusing on bachelor’s degrees (also known as four-year degrees), nearly three in four (73 percent) of Americans agree that if you have a bachelor’s degree, you are paid more for the same job than those who do not have a bachelor’s degree. Two-thirds of Americans (66 percent) believe there is a limit to how much people without a bachelor’s degree are able to grow in their careers.
Error: Data visualization bundle URL missing.
Error: Data visualization bundle URL missing.
Error: Data visualization bundle URL missing.
Findings by Party Identification
Regardless of party affiliation, pursuing education after high school is seen as the better path. However, Democrats (83 percent) are slightly more likely than Republicans (77 percent) to believe there are more opportunities for those who pursue education after high school.
Error: Data visualization bundle URL missing.
While Republicans and Democrats feel that it is harder to be successful without a college degree, only a slight majority of Republicans (52 percent) believe this to be the case compared with 72 percent of Democrats.
Error: Data visualization bundle URL missing.
Perhaps reflecting the fact that Democrats think it is harder to be successful without a degree, they feel more strongly than Republicans do about the value of a bachelor’s degree for career growth and opportunity. While a majority of Republicans still think a bachelor’s degree opens doors (62 percent), Democrats (70 percent) have a stronger belief that there is a limit to how much people without a bachelor’s degree are able to grow in their careers.
Regardless of party identification, Democrats (76 percent), Republicans (71 percent), and Independents (71 percent) all believe that if you do have a bachelor’s degree, you are paid more for the same job than those who do not have one.
Error: Data visualization bundle URL missing.
Error: Data visualization bundle URL missing.
Other Findings
By Educational Attainment
The majority of people across all levels of educational attainment believe that those with bachelor’s degrees are paid more in the same job than those without. But people with only high school degrees or less are the least likely to think that is the case: only 68 percent agree, compared with 75 percent of people with some college, 74 percent of people with undergraduate degrees, and 76 percent of people with graduate degrees.1
Error: Data visualization bundle URL missing.
Citations
- For the purposes of this survey, “undergraduate degree” attainment corresponds to those with an associate or bachelor’s degree. “Some college” refers to those with some college credits and/or vocational, trade, or technical training. “Graduate degree” includes some postgraduate work or a postgraduate degree.
Americans want change in higher education.
Like last year, only one in four (25 percent) Americans believes that higher education is fine the way it is. This year New America followed up with an open-ended question to gauge why Americans do not think higher education is fine the way it is. The top three response categories were: college is too expensive and hard to access (38 percent); there is always room for improvement (12 percent); and college should be free for everyone/equal access for all (12 percent).1
Error: Data visualization bundle URL missing.
Error: Data visualization bundle URL missing.
Compared with last year’s survey, slightly more Americans believe that everyone has a decent chance of getting into a good college (47 percent versus 41 percent in 2017). Fewer (but still a majority) believe that most students will see a return on investment (72 percent versus 79 percent in 2017).
Error: Data visualization bundle URL missing.
Error: Data visualization bundle URL missing.
Americans feel mixed on exactly what is more valuable during a student’s time enrolled in higher education: the education received inside the classroom or the experiences received outside the classroom. Nearly half (47 percent) say it is the experiences outside the classroom, with 35 percent saying it is the education received in the classroom. Sixteen percent say it is both.2
Error: Data visualization bundle URL missing.
Findings by Party Identification
Regardless of party, only about one in four believes higher education is fine the way it is. The top three reasons Democrats believe higher education is not fine the way it is because it is too expensive and hard to access (42 percent); it should be free/equal access for all (13 percent); and there is always room for improvement (12 percent). For Republicans, the top three reasons are: it is too expensive and hard to access (33 percent); there is always room for improvement (12 percent); and professors and instructors are not doing their jobs or educating students (11 percent).
Error: Data visualization bundle URL missing.
About half of polled Republicans (54 percent) believe that everyone has a decent chance of getting into a good college compared with only 41 percent of Democrats who believe this to be the case. Democrats are more likely to believe that most who enroll in higher education will see a return on investment, but two-thirds of Republicans also believe this to be the case (76 percent of Democrats versus 68 percent of Republicans).
Error: Data visualization bundle URL missing.
Error: Data visualization bundle URL missing.
Half of Republicans (51 percent) are more likely to believe experiences outside the classroom are more important than the education received inside the classroom compared with Democrats (45 percent).
Error: Data visualization bundle URL missing.
Other Notable Findings
By Educational Attainment
A significant share of respondents with graduate degrees volunteers that experience outside the classroom and the education received in the classroom are equally important (25 percent).
Respondents at all other levels of educational attainment say they value the experiential component of higher education more than the in-class component.
Error: Data visualization bundle URL missing.
By Generation
Among all generations, Millennials are the least likely to think that higher education is fine the way it is. Only 19 percent of Millennials are fine with the current state of higher education, followed by Generation Z (22 percent) and Generation X (24 percent). The Silent Generation and Boomers, on the other hand, seem to have a slightly more positive view of higher education but still little agreement that the current system is fine the way it is (34 percent and 28 percent agree, respectively).
Error: Data visualization bundle URL missing.
Older and younger generations are divergent in their opinions of the experiential and in-class components of higher education. The older the generation, the more likely respondents are to value the education received in the classroom. Only 27 percent of Generation Z agree that education received in the classroom is more important than the experience outside classroom, whereas 47 percent of the Silent Generation believe so. On the other hand, the younger the generation, the more likely respondents are to say they value experience outside classroom. Around 30 percent of the Silent Generation think the experience outside the classroom is more important than within, and that share increases consistently with each younger generation; approximately three in five (61 percent) of Generation Z respondents agree that experience outside the classroom is more important.
Error: Data visualization bundle URL missing.
Citations
- The open-ended nature of this question allowed for multiple responses so percentages do not sum to 100. The responses to these questions were coded and the categories were developed from the common themes of responses.
- This was a forced choice question: respondents were only given two options with which to respond. Saying “both” was a volunteered response.
Americans believe public colleges and universities are worth the cost but feel more mixed about private and for-profit colleges and universities.
Like last year, a majority of Americans say community colleges and public four-year colleges and universities are worth the cost (81 percent and 65 percent, respectively). They do not think this is the case for private nonprofit and for-profit colleges and universities (44 percent and 40 percent, respectively).
Error: Data visualization bundle URL missing.
A majority of Americans believe that colleges and universities in the public sector are for people like them, similar to last year, but they believe this to be the case more for four-year public colleges and universities (74 percent for public four-year colleges and universities versus 69 percent for public two-year colleges). Slightly less than a majority think that private colleges and universities are for them (49 percent); and just over two in five (44 percent) believe for-profit institutions are for people like them.
Error: Data visualization bundle URL missing.
A majority of all Americans believe all sectors of higher education (public, private nonprofit, and private for-profit) contribute to a strong American workforce and prepare people to be successful. However, Americans believe this more with respect to the public sector than with the private for- or nonprofit sectors.
Error: Data visualization bundle URL missing.
Error: Data visualization bundle URL missing.
Findings by Party Identification
Most Democrats and Republicans believe that public colleges and universities are worth the cost, though Republicans (59 percent) are less likely to believe this to be the case for four-year public colleges and universities than Democrats (69 percent). Less than half of Democrats and Republicans believe private nonprofit and for-profit institutions are worth the cost, though Democrats are more likely to believe that private nonprofit institutions are worth the cost (49 percent versus 36 percent of Republicans).
Error: Data visualization bundle URL missing.
Regardless of party identification, Democrats and Republicans see public sector schools as being for people like them. A slight majority of Democrats (52 percent) believe that private nonprofit colleges and universities are also for people like them, compared with 45 percent of Republicans. Republicans are more likely to say for-profit institutions are for people like them, but it is still a minority of respondents (47 percent of Republicans versus 42 percent of Democrats).
Error: Data visualization bundle URL missing.
Regardless of party identification, Americans believe all sectors of higher education contribute to a strong American workforce. A majority also believe all sectors prepare people to be successful and happy in life, with one exception: only 46 percent of Independents believe this is the case for for-profit institutions.
Error: Data visualization bundle URL missing.
Error: Data visualization bundle URL missing.
Other Findings
By Race and Ethnicity
African American and Hispanic respondents are more likely to see for-profit colleges favorably than their white and Asian peers. African American respondents are the only ones to believe in the majority that for-profit colleges and universities are for people like them (56 percent). African American and Hispanic respondents are more likely to believe for-profits contribute to a strong American workforce and are worth the cost.
Error: Data visualization bundle URL missing.
Error: Data visualization bundle URL missing.
Error: Data visualization bundle URL missing.
By Educational Attainment
Those with a high school education or less and those with some college education have more favorable opinions of for-profit colleges than those with a college degree. More than two out of five (45 percent) people with a high school diploma or less think that for-profit colleges are for people like them, and 46 percent agree that for-profit colleges are worth the cost. For people with some college, half think that for-profit colleges are for people like them, and 43 percent agree that for-profit colleges are worth the cost. Sixty percent of those with a high school education or less and 54 percent of those with some college agree that for-profit colleges prepare people to be successful and happy in life.
Error: Data visualization bundle URL missing.
Error: Data visualization bundle URL missing.
Error: Data visualization bundle URL missing.
By Generation
All generations highly favor public institutions, especially public two-year community colleges. On average more than 80 percent of respondents across all generations think community colleges are worth the cost. Even though those from younger generations are slightly less likely to think that community colleges prepare people to be successful and happy in life (63 percent of Generation Z and 67 percent of Millennials), they are more likely than some from older generations to believe that community colleges are for people like them (71 percent of Generation Z and 72 percent of Millennials).
Error: Data visualization bundle URL missing.
Error: Data visualization bundle URL missing.
Error: Data visualization bundle URL missing.
Regardless of demographic, Americans like their local colleges and universities.
Even though only one in four believes higher education is fine the way it is, when asked about their local colleges and universities, 81 percent of Americans have a positive view of the higher education institutions near them.
Error: Data visualization bundle URL missing.
Findings by Party Identification
Despite survey data from Pew and Gallup that showed Republicans feel negatively about “higher education” this is more likely related to the institution of college than for the specific colleges and universities located near them. Regardless of party identification, people like their local colleges and universities. While Republicans (78 percent) are less likely to say this than Democrats (84 percent), there is strong agreement.
Error: Data visualization bundle URL missing.
Americans support workforce-based programs such as apprenticeships.
This year a new question was asked about favorability towards apprenticeship and skills training programs. It is especially important to gauge the favorability of this educational pathway as more attention has been paid by the president and policymakers to developing these programs. There is wide agreement (90 percent, with 53 percent strongly agreeing) that apprenticeships and skills training programs, many of which take place on community college campuses, prepare students for a good standard of living.
Error: Data visualization bundle URL missing.
Findings by Party Identification
There is wide agreement across all party identifications that apprenticeship and skills training programs prepare students for a good standard of living.
Error: Data visualization bundle URL missing.
Americans believe higher education is a public benefit and that the government should do more to make it affordable.
A majority of Americans (60 percent) believe government should fund higher education because it is good for society, compared with 27 percent who say students should fund it because it is a personal benefit.
Error: Data visualization bundle URL missing.
Perhaps as indication of the fact that a majority of Americans think that higher education is good for society, over three-quarters of them (77 percent) are comfortable with their own tax dollars going to support it. Over three-quarters also agree that state (78 percent) and federal (77 percent) government should spend more tax revenue on higher education to make it more affordable.
Error: Data visualization bundle URL missing.
Error: Data visualization bundle URL missing.
Error: Data visualization bundle URL missing.
Findings by Party Identification
There is a notable divergence in views between Democrats and Republicans on whether government should fund higher education because it is good for society or whether individuals should fund it because it is a personal benefit. A solid majority of Democrats (76 percent) sees it as a good for society, worthy of government investment, whereas about half of Republicans (52 percent) see it as a personal benefit that should be financed with individual investments.
Error: Data visualization bundle URL missing.
Regardless of party identification, a majority is comfortable with their own taxes being spent on higher education. However, there is over a 20-point spread in the opinions of Democrats (85 percent) and Republicans (63 percent).
Error: Data visualization bundle URL missing.
Democrats strongly agree that state (91 percent) and federal (92 percent) government should spend more tax dollars on higher education to make it more affordable. While Republicans are much less likely to agree that state (57 percent) and the federal government (54 percent) should spend taxpayer dollars on higher education, a majority of Republicans still agree.
Error: Data visualization bundle URL missing.
Error: Data visualization bundle URL missing.
Other Findings
By Race and Ethnicity
African Americans are much more likely than other racial and ethnic groups to see higher education as a good for society (77 percent) than as a personal benefit. Perhaps for this reason, they are also the most likely to believe that the federal government needs to spend more on higher education to make it affordable (91 percent), followed by Hispanic respondents (84 percent), and Asian American respondents (82 percent). While white respondents are decidedly less likely to agree that state (72 percent) or the federal government (71 percent) should spend more tax dollars to make higher education affordable, they are still highly supportive of these measures overall.
Error: Data visualization bundle URL missing.
Error: Data visualization bundle URL missing.
Error: Data visualization bundle URL missing.
By Educational Attainment
Even though a high percentage of people with high school degrees or less agree about having their tax dollars going to support higher education, they are the least likely among all groups of educational attainment to feel comfortable with the idea: 69 percent of these respondents agree, compared with 76 percent of those with some college, 80 percent of those with undergraduate degrees, and 82 percent of those with graduate degrees.
Error: Data visualization bundle URL missing.
By Generation
Generation Z is the most likely (80 percent) to believe that tax dollars should go to higher education because of its benefits for society, compared with 60 percent of Millennials, 57 percent of Generation X respondents, 58 percent of Baby Boomers and 57 percent of the Silent Generation.
Generation Z is also the most likely to feel comfortable having their taxes supporting higher education (87 percent), and to want to see more spending from state and federal (86 percent for both) government to make higher education more affordable.
Error: Data visualization bundle URL missing.
Error: Data visualization bundle URL missing.
Error: Data visualization bundle URL missing.
Error: Data visualization bundle URL missing.
Perception versus reality
Most people who go to college finish with a degree
Perception
45 percent of Americans believe most people who go to college finish with a degree.
Error: Data visualization bundle URL missing.
Reality
Without better data, it is difficult to answer this question definitively. We do know that about 60 percent of full-time, first-time students at four-year institutions completed a bachelor’s or equivalent degree within six years, and that 33 percent of full-time, first-time students at two-year institutions completed a credential within three years.
While some research suggests that just over half of students complete a certificate or college degree within six years, it is difficult to get a true picture of national graduation rate data. Because of a federal ban on collecting comprehensive, student-level data and a decades-old graduation rate definition established by Congress, the Department of Education collects data on graduation rates only for first-time, full-time students. The growing ranks of part-time students and transfer students are, therefore, not included in the graduation rates that colleges and universities report, nor are students who transfer from a two-year institution to a four-year college to complete their degrees. Recent bipartisan legislation in both the House and the Senate, called the College Transparency Act, would establish a secure, privacy-protected data network to answer this college completion question, among many others.
The Department of Education’s graduation rate definition measures the share of those first-time, full-time students who graduate within 150 percent of the expected time to completion. Those data reveal that graduation rates are too low among both two- and four-year institutions, and that they vary significantly across institutions—suggesting academic supports for students and educational quality are not the same at all schools. Accurate measures of graduation are especially critical for students to understand, given how important college completion is to ultimate post-college success. For example, adults with degrees have lower rates of unemployment and higher wages than those with only a high school diploma, and borrowers who drop out before earning a degree are three times more likely to default on their loans. Given how important college completion is to ultimate post-college success—adults with degrees have lower rates of unemployment and higher wages than those with only a high school diploma, and borrowers who drop out before earning a degree are three times more likely to default on their loans—accurate measures of graduation are especially critical for students to understand.
Students pay the majority of the costs (tuition, room & board, etc.) involved in their higher education
Perception
70 percent of Americans believe students pay the majority of costs involved in higher education.
Error: Data visualization bundle URL missing.
Reality
Dependent students pay 32.8 percent of costs at two-year colleges, 51.1 percent at public four-year colleges, and 74.5 percent at private four-year colleges.
Source: Jason Delisle, Shifting Burdens: How Changes in Financial Aid Affected What Students and Families Paid for College from 1996 to 2012 (Washington, DC: New America, April 2016).
Error: Data visualization bundle URL missing.
Whatever the reason, rising costs across the board have not necessarily translated to students paying for a greater share of their education. For students attending public institutions, most pay about half of the total costs of their education, while those at community colleges pay less than one-third. In percentage terms, the share of education costs paid by students, regardless of institution type, has either declined or stayed relatively constant between 1996 and 2012.
While many sources of aid flow directly to students, others are distributed to the schools they attend or through tax deductions and credits, making these financial supports less visible to students and the general public. At the same time, tuition costs have continued to increase, making it tempting to attribute this to declining government support. In some cases, this may be true. However, it is also the case that the costs of providing higher education are increasing across the board—meaning that even if total government resources expand, students and families may still have to contribute more.
A 2016 study by New America evaluated the share of funding from all potential sources with respect to the total costs of providing education, including institutional expenditures and student living costs. Our analysis found that while per-student funding has dropped at the state level, federal aid has more than offset this decline, particularly for low- and middle-income students. Yet in inflation-adjusted dollar terms, students and their parents are still paying more than they were 20 years ago.
The reasons for this increase are hotly debated. Many have argued that one reason is the increased availability of federal financial aid. Somewhat paradoxically, this reasoning contends that additional federal resources—such as Pell Grants and student loans—coupled with the well-publicized economic returns of a college degree, have enabled institutions to raise their prices in response. Others have suggested that costs have increased for less pernicious reasons: because the cost of hiring and retaining faculty and administrative staff has grown, with no comparable savings from the use of online and other innovative delivery models. In such a scenario, even as federal grants and tax credits increase, it may not be enough to keep pace with the higher costs of providing education. Still others say the rise of luxury amenities increases living costs at many of the most expensive private schools.
Government currently pays less than half the costs associated with higher education
Perception
59 percent of Americans believe government pays less than half of costs involved in higher education.
Error: Data visualization bundle URL missing.
Reality
Government sources make up about 65.2 percent of costs at two-year colleges, 41.8 percent of costs at public four-year colleges, and 13.6 percent at private four-year colleges.
Source: Jason Delisle, Shifting Burdens: How Changes in Financial Aid Affected What Students and Families Paid for College from 1996 to 2012 (Washington, DC: New America, April 2016).
Error: Data visualization bundle URL missing.
Last year, 59 percent of Americans believed that government pays less than half the costs associated with higher education. This year, the number of respondents who believe government pays less than half the costs increased to 64 percent, a significant difference.
The reality is that government sources make up about 65.2 percent of costs at two-year colleges, 41.8 percent of costs at public four-year colleges, and 13.6 percent at private four-year colleges.
There are more students in two-year associate degree and technical programs than there are in four-year bachelor's degree programs
Perception
50 percent of Americans believe there are more students in two-year and technical programs than there are in four-year bachelor degree programs.
Error: Data visualization bundle URL missing.
Reality
Error: Data visualization bundle URL missing.
Half of Americans think that there are more students in two-year and technical programs than there are in four-year, bachelor’s programs. In fact, approximately 40 percent of undergraduates in America enroll in either a public or private four-year institution, around 38 percent in a public two-year, and 13 percent in a for-profit. (Source: NPSAS:12)
Table 1:
| School Designation | Percent of Students Who Attend |
|---|---|
| Public four-year | 28.4% |
| Private four-year | 11.7% |
| Public two-year | 38.1% |
| For-profit | 12.8% |
| Two or more | 9.0% |
The average college student is 20 years old
Perception
64 percent of Americans believe the average college student is 20 years old.
Error: Data visualization bundle URL missing.
Reality
Error: Data visualization bundle URL missing.
The average college student is 26.4 years old. Even though the majority of undergraduates in the U.S. are less than 24, one in five college students today are 30 years old or more.
People who complete an apprenticeship earn an average starting wage of $50,000 year
Perception
46 percent of Americans believe that those who complete an apprenticeship program earn an average starting wage of $50,000.
Error: Data visualization bundle URL missing.
Reality
According to the Department of Labor, the average apprenticeship graduate earns $50,000 a year. While a little less than half of Americans got this right, when asked whether apprenticeships and skills-training programs prepare students for a good standard of living, a large majority (90 percent) believe they do. This should not be a surprise: Apprentices are more likely to be employed than traditional graduates of higher education, they make higher starting salaries, and they have little to no education debt. But currently there is only a tiny number of apprentices compared with the total number of students enrolled in higher education. Connecting apprenticeships more tightly to our education system can help scale these programs.
New America’s previous survey work also found that the American public widely supports investment in apprenticeships. Eighty-three percent of respondents believe government funding for apprenticeships should be increased. And that support crosses party lines. Ninety-three percent of Democrats and 73 percent of Republicans favor additional spending on these programs. A majority of respondents also believe that an apprenticeship is the best way to prepare for a career.
North Carolina
North Carolina is narrowly split among Democrats, Republicans, and Independents. It is a “purple” state, one that swings back and forth between the parties it elects for key positions both nationally and statewide. In 2016, for example, North Carolina voters sent Trump to the White House and Democrat Roy Cooper to the governor’s office, both at thin margins.
North Carolina is also known for its strong system of public higher education, from its flagship campus—the University of North Carolina at Chapel Hill—to its highly regarded regional comprehensive and community colleges. It is home to many innovative postsecondary programs such as multiple registered apprenticeships for youth and adults, and Early College High Schools where high school students have an opportunity to earn an associate degree while also earning their high school diploma.
Given the well-known higher education system in place in North Carolina and its role as a swing state, New America oversampled North Carolinians this year to have a better understanding of their thoughts about higher education and whether they differ from those nationwide. North Carolina could be a bellwether on higher education policy, given its mix of demographics.
North Carolina residents are less likely to believe there are well-paying jobs that do not require college.
Slightly fewer North Carolinians (51 percent) believe that there are lots of “well-paying jobs” that do not require college, compared with 57 percent nationwide. Similar to Americans nationwide, broadening the concept of college to include any education beyond high school causes the opinions of North Carolina residents to go down, but only slightly, to 49 percent.
Error: Data visualization bundle URL missing.
Error: Data visualization bundle URL missing.
North Carolinians think higher education is a requirement for career growth.
Similar to Americans nationwide, more than four out of five North Carolina residents (85 percent) believe there are more opportunities for those who pursue education after high school instead of pursuing work right away.
Error: Data visualization bundle URL missing.
Just like Americans nationwide, nearly three in five (63 percent) North Carolina residents believe that it is harder to be successful without a higher education degree. They also believe that if you have a bachelor’s degree (also known as a four-year degree), you are paid more for the same job than those who do not have a bachelor’s degree (74 percent versus 73 percent nationwide). And more than two-thirds (69 percent) believe there is a limit to how much people without a bachelor’s degree are able to grow in their careers, tracking with American sentiments nationwide (66 percent).
Error: Data visualization bundle URL missing.
Error: Data visualization bundle URL missing.
Error: Data visualization bundle URL missing.
A majority of North Carolinians think higher education needs to change.
Only one in four North Carolinians believes higher education is fine the way it is. The top reason given? One-third believe college is too expensive, which inhibits access. Just over two in five North Carolina residents believe that all Americans have a decent chance of getting into a good college.
Error: Data visualization bundle URL missing.
Error: Data visualization bundle URL missing.
Like Americans nationwide, North Carolina residents believe public colleges and universities are worth the cost, but feel more mixed about private and for-profit colleges and universities.
Just like Americans nationwide, a majority of North Carolina residents say public two-year community colleges and public four-year colleges and universities are worth the cost (88 percent and 65 percent, respectively). They do not think this is the case for private nonprofit four-year and for-profit colleges and universities (37 percent for both).
Error: Data visualization bundle URL missing.
A majority of North Carolinians believe that public sector schools are for people in “my situation:” 75 percent say community colleges and public four-year colleges and universities are for people like them. Slightly less than half think that private colleges and universities are for them (44 percent); fewer than two in five (38 percent) believe for-profit institutions are for people like them.
Error: Data visualization bundle URL missing.
A majority of North Carolinians believe all sectors of higher education contribute to a strong American workforce and prepare people to be successful. However, they believe this more for the public sector than for the private for-profit or nonprofit sectors. Perhaps as evidence of their well-regarded public higher-education system, North Carolinians have a strong belief that community colleges contribute to a strong American workforce (94 percent versus 83 percent nationwide) and prepare people to be successful and happy in life (78 percent versus 69 percent nationwide).
Error: Data visualization bundle URL missing.
Error: Data visualization bundle URL missing.
North Carolina residents have favorable views of their local colleges and universities.
Nationwide, 81 percent of Americans have a positive view of the colleges and universities near them. In North Carolina, that sentiment is stronger. Nearly nine in 10 (87 percent) North Carolina residents have a positive view of the institutions located near them, a significant difference.
Error: Data visualization bundle URL missing.
There is strong support for workforce-based programs such as apprenticeship.
Like Americans nationwide, there is wide agreement (93 percent of North Carolinians) that apprenticeships and skills training programs prepare students for a good standard of living.
Error: Data visualization bundle URL missing.
North Carolina residents believe higher education is a public benefit and that the government should do more to make it affordable.
More North Carolina residents (49 percent) believe the government should spend tax revenue on higher education because it is a good for society than believe students should fund it because it is a personal benefit (33 percent). North Carolinians' view of government funding is significantly different—and less positive—from Americans across the country, 60 percent of whom are more likely to say the government should fund higher education because it is a good for society. However, their view of student financing is comparable to national views; fewer than one-third (27 percent) of Americans believe students should be primarily responsible because higher education is a personal benefit.
Error: Data visualization bundle URL missing.
Perhaps as indication of the fact that a near majority of North Carolinians think that higher education is a good for society, 79 percent are comfortable with their own tax dollars going to support it. Three-quarters of North Carolinians think the state (75 percent) and federal (74 percent) government should spend more tax revenue on higher education to make it more affordable.
Error: Data visualization bundle URL missing.
Error: Data visualization bundle URL missing.
Error: Data visualization bundle URL missing.
Institutional Profile: Elon University
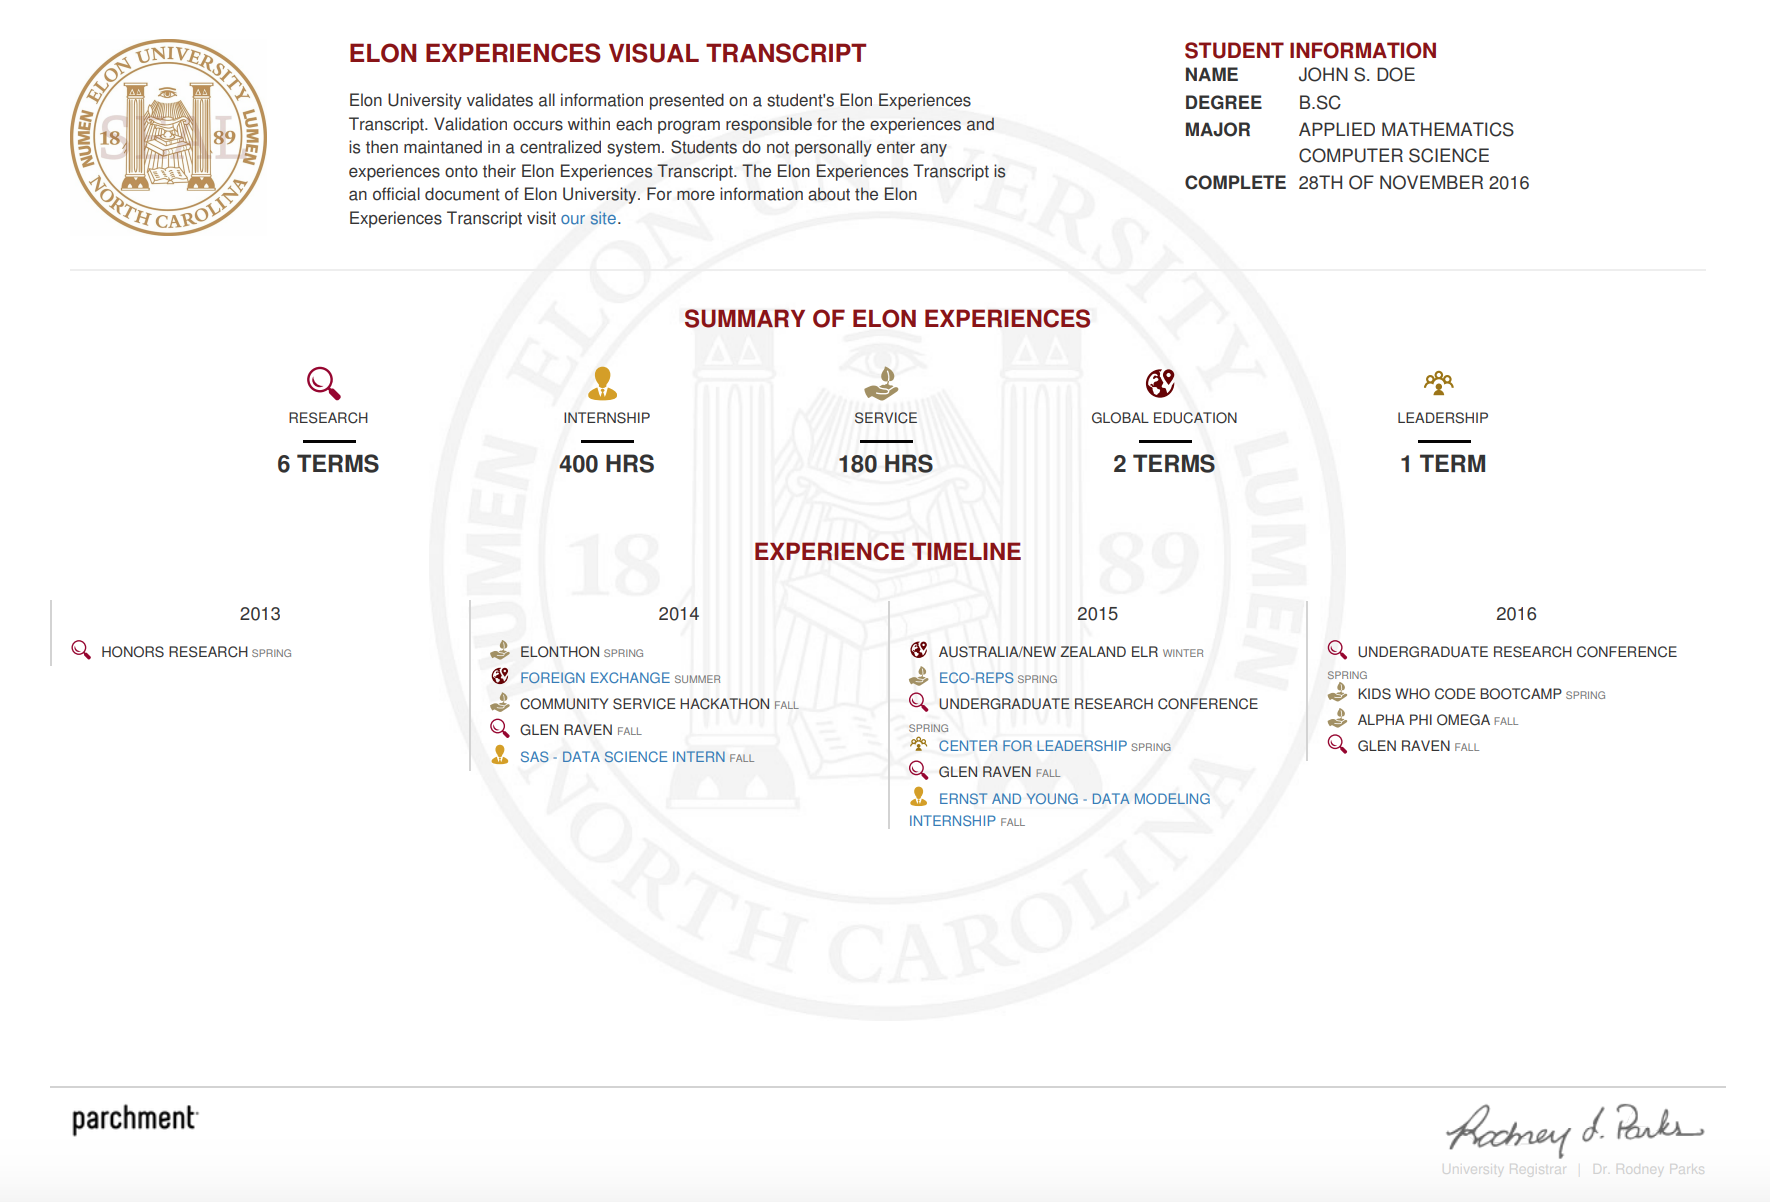
When University Registrar Dr. Rodney Parks started at Elon University in 2013, the university had already been producing Elon Experience Transcripts (EETs) for 19 years. These EETs documented student experiences outside the classroom, such as internships and study abroad programs. But the document was only loosely tied to the school’s official academic transcript, and it was produced out of the student affairs office. This meant that, despite being a great resource, few students knew it existed—and even fewer (an average of 12 students per year) requested it.
How could the university bring awareness to the experiential transcript and encourage students to talk about the value of their time at Elon beyond the classroom? Dr. Parks, and the development team that would soon transform Elon’s experiential transcript, knew that the answer started with merging it with the official academic transcript—which meant moving the experience transcript to the office of the registrar. But the changes, and their vision of what EETs could be, did not end there.
They envisioned a digital transcript that was both visually appealing and more robust than the current experiential transcripts, and that captured and validated more details of students’ co-curricular activities. They imagined a document that would give students a holistic summary of their Elon experience to use to market themselves to prospective employers and share on social media. In 2016, through a partnership with Lumina Foundation, the American Association of Collegiate Registrars and Admissions Officers (AACRAO), and NASPA – Student Affairs Administrators in Higher Education, they were able to bring the vision to fruition.
Today, 2,000 students per year—over a third of the university’s annual transcript production—request Elon’s Visual Experience Transcript (Visual EXP). Today, Elon’s Visual EXP is requested by 2,000 students per year, over a third of Elon’s annual transcript production. Putting each transcript together is a true team effort, with several departments (including the university’s service learning and community engagement, research, career services, and student affairs offices) collecting, validating, and submitting more detail on co-curricular experiences than the original EET did. The Visual EXP has made Elon one of the pioneers in the “beyond the transcript” space.
But the Visual EXP is also an important example of what higher education needs to do to continue to show that it is a comprehensive investment that is worth the cost. Varying Degrees 2018: New America’s Second Annual Survey on Higher Education asked Americans which experiences in higher education are more important: those that occur outside the classroom or those inside the classroom. Americans were more likely to say that experiences outside the classroom are more important than within (47 percent versus 35 percent; 15 percent said both). The breakdown shows that Americans see the value of college as more than taking classes and maintaining a good GPA.
According to Dr. Parks, students know this better than anyone. “The students themselves appreciate the ability to tell their full Elon story. …[They] have been real vocal about telling us that we should be capturing even more than we’re capturing.”
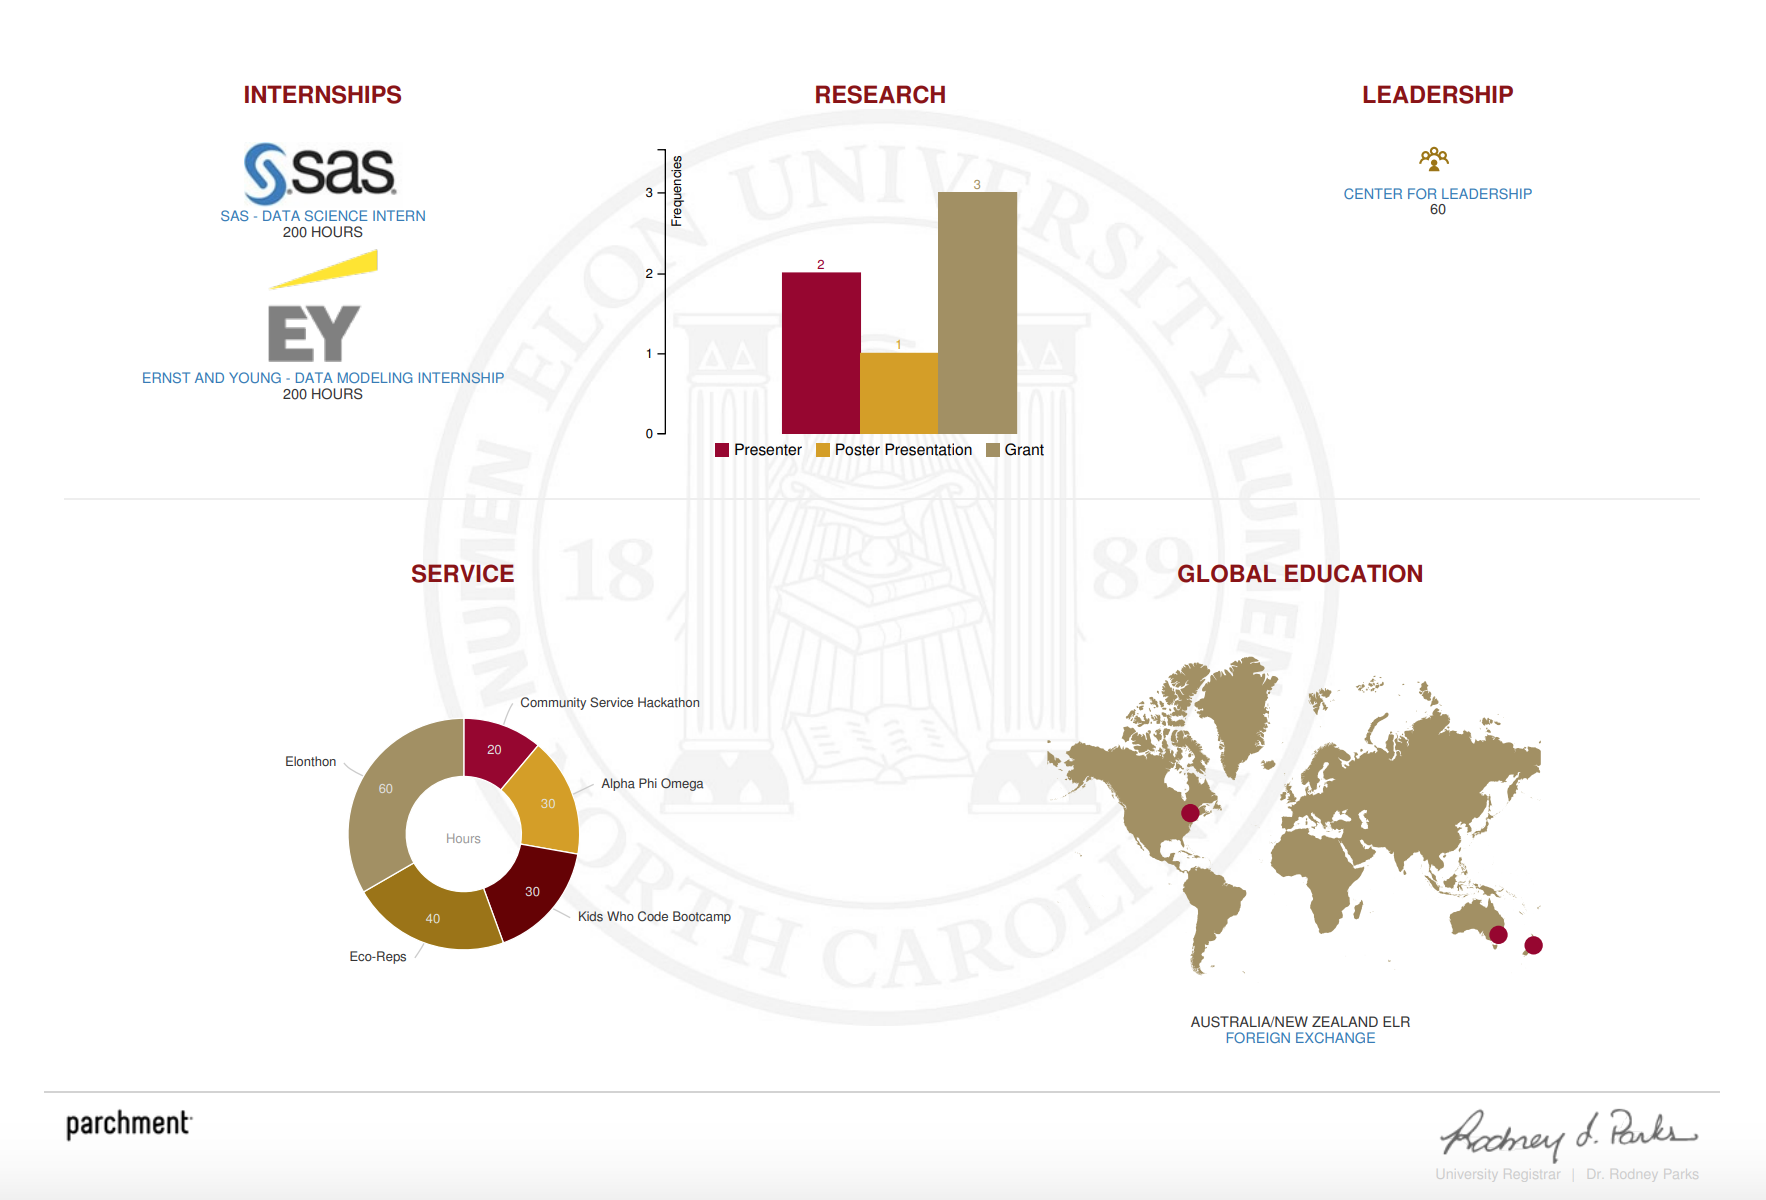
At present, the Visual EXP presents co-curricular activity along five categories: research, internship, service, global education, and leadership. The first page provides a summary of experiences by the number of terms or total hours a student has spent focused in each category, as well as a timeline that details when the student participated in specific activities by year. The second page goes into more detail, organizing co-curricular experiences by the category they fall under, while including titles, relevant links to research, internships, study-abroad products, and other additional information.
The format is especially suited to allow students to market the full suite of their college experience and accomplishments, and prospective employers are among the grateful. According to a research survey of employers conducted by Elon in partnership with ACCRAO, 86 percent of employers and students agreed that “experiential transcripts paint a more favorable picture of a job applicant than traditional transcripts do,” and 74 percent agreed that an enhanced transcript “caused them to view the applicant/candidate more favorably.”
Despite what the Visual EXP already logs and its favorability among students and employers, Dr. Parks and his team are not done thinking through ways to build out the transcript. They want to further blend the Visual EXP with the four-year plan advising model, offering experiential advising on top of academic advising. They are also considering what the data analytics from the Visual EXPs can tell them about what it takes for students to be successful at Elon, and to use that to inform practices and resources.
“It’s provided a whole new level of metrics to see the level of engagement based on varying demographics,” said Dr. Parks. “It’s helped us begin to look at first-year programs and refocus them in a way that students are getting the most out of them and being retained at the highest levels.”
Apprenticeship Program Profile: Siemens Charlotte
In 2011 when Siemens could not find enough qualified workers for its newly opened gas turbine factory in Charlotte, the company started the apprenticeship program—which is now one of the more than 550 registered apprenticeship programs in North Carolina. Applying to the apprenticeship at Siemens is no less competitive than applying to a top-tier college. “It’s not that you apply and get in,” said Orkhan Patsiyev, a fourth-year apprentice at the program. After four selection rounds, which include transcript screening, aptitude tests, orientation, and pre-apprenticeship—only four to eight candidates are offered the apprentice positions from an original pool of more than 100 applicants.
Once through the selection process, apprentices at Siemens are paid and receive on-the-job training in mechatronics and machining. At the same time, apprentices work toward an associate degree in machining or engineering technology at a community college nearby, with the full cost of attendance paid by Siemens. Once they successfully complete the program, apprentices are hired as full-time employees and can work at any Siemens location in the U.S., with a starting wage at around $55,000 (which is on par with median family income in America). Most importantly, completion of the program comes with no student debt.
This is why Mr. Patsiyev decided to apply for the program, instead of going to college to study mechanical engineering as he originally planned. “I wanted to go to the apprenticeship, where I get hands-on experience, get a two-year degree in machining, which I could [use] to study engineering later, when I’ve already had a full-time job at the company that I want to work,” he said. “That kind of makes me change my mind.”
The apprenticeship at Siemens involves 8,000 hours of training in total during four years. Apprentices spend most of that time (6,400 hours) at the factory, where they are paired with mentors, who are tenured machinists or maintenance workers at the factory. The apprentices work alongside with the mentors, who show them how to run a machine correctly and safely and answer their questions about the process. “Within the first year, I learned a lot, because we got one of the best mentors,” said Mr. Patsiyev. Even as a fourth year student who knows more about machining compared to when he first started, Mr. Patsiyev said that he still turns to his mentors whenever anything comes up. At the end of each year, the mentors provide feedback on the progress of each apprentice to the apprenticeship coordinator.
Apprentices spend the remaining 1,600 hours at Central Piedmont Community College, where they take classes toward an associate degree in either machining or engineering technology over three and a half years. Apart from these technical classes, they can take some optional customized training programs at the college, such as business etiquette and public speaking, at the expense of the company.
“The beauty of Central Piedmont is that they’re flexible with us, and they understand the industry’s needs to a point where they can modify their [curricula] and substitute courses that actually meet the businesses’ needs,” said Roger Collins, apprenticeship manager at Siemens and an apprentice graduate himself.
For Mr. Patsiyev, every semester is different. This semester he spends four days at school (some of which are split between school and work), and only one full day at work. Unlike other apprentices in the program, he has also taken it upon himself to pursue more classes in mechanical engineering, apart from the required classes by the program, with an aim to get a higher degree in the field later. Juggling between school and work can be challenging, but the program can be flexible with time if the apprentices need more time to study. They also hire tutors for those who fall behind in class, and they pay for the time apprentices spend in the classroom. “If I’m at Central Piedmont Community College from 8 o’clock to 4 o’clock, they would pay me from 8 to 4,” said Mr. Patsiyev.
The program recruits from three different groups: high school students, students from machining and mechatronics programs at local community colleges, and veterans. Half of them come from North Carolina, the other half from South Carolina. Since it is hard to have somebody relocate to Charlotte just for the apprenticeship program and the local response is already sufficient, the program currently does not need to recruit nationally. Recruiting more female students is still a challenge, given the nature of manufacturing work; but according to Mr. Collins, the interest from young, female students is growing. In fact, among three apprentices graduating from the first class of the program, two were female. Mr. Collins also shared that he had invited two young, female candidates to join the pre-apprenticeship this summer, the final round of the selection process.
It costs the program more than $180,000 to train an apprentice from beginning to finish; this includes salaries paid to the apprentices, plus the tuition and fees for the associate degree. This is indeed a significant financial investment for any employer and an obstacle for scaling the program. But, cost is “the obstacle and the solution,” said Mr. Collins. “Whatever costs involved, [the apprentices] pay that back, a lot of time, within the confines of the program.” He said, with a higher level of education and organized on-the-job training, apprentices can become more productive at work within two and a half years. “They pay for themselves before they even graduate from the program.”
So far the program has graduated more than 16 apprentices, 70 percent of whom stayed and now work at Siemens. “Our model and the model that we adapted from have been utilized, not just in the state of North Carolina with many other programs, but also throughout the United States,” said Mr. Collins. It is his plan to expand the apprenticeship to two more occupations, welding and nondestructive engineering, in the short term, and eventually, he said, “to nearly every job we have at Siemens, not just technical jobs.”
After Mr. Patsiyev graduates from the apprenticeship this August, he plans to stay and work at Siemens as a machinist. “I want to work for the company as long as I can,” he said. Once everything is settled down with the full-time job, he wants to further his study of mechanical engineering to earn a bachelor’s degree at a four-year university, where some of the credits he has taken at Central Piedmont are transferable.
“The manufacturing world gets very technologically advanced,” he said. “That’s something you have to keep up; you can’t be old-school. You have to learn every day. Just like being a doctor, you have to always teach yourself a new technology.”
More About the Authors

Sophie Nguyen
Senior Policy Manager, Higher Education
Rachel Fishman
Director, Higher Education