Phase Zero: China’s Natural Security
Abstract
In its 2018 National Defense Strategy, the U.S. government identified global competition between “great powers” as a trend that will shape the twenty-first century. This factsheet looks at a specific aspect of that competition: China’s natural security. The Phase Zero project at New America defines "natural security" as the intersection of prosperity, security, and natural resources, a condition of reliable, affordable, and sustainable access to sufficient natural resources for short and long-term stability and prosperity. This report looks at agriculture, energy, metals and minerals, and water. There is also a brief section considering how climate change will be a cross-cutting shaping factor.
This report is drawn from an ongoing Phase Zero research initiative, in partnership with the Joint Global Change Research Institute, which is analyzing how climate change may affect China’s natural security and shape the country’s strategic choices in the coming decades.
Introduction
In its 2018 National Defense Strategy, the U.S. government identified global competition between “great powers” as a trend that will shape the twenty-first century.1 This factsheet looks at a specific aspect of that competition: China’s natural security. The Phase Zero project at New America defines natural security as the intersection of prosperity, security, and natural resources, a condition of reliable, affordable, and sustainable access to sufficient natural resources for short and long-term stability and prosperity. “Phase Zero,” the focus of the project, is a U.S. defense planning concept referring to a time before there’s armed conflict, when it’s still possible to shape the strategic landscape.
This report is drawn from an ongoing Phase Zero research initiative, in partnership with the Joint Global Change Research Institute, which looks at how climate change may affect China’s natural security and shape the country’s strategic choices in the coming decades. The methodology for the natural security rankings map, as well as complementary military and soft power rankings, can be downloaded here. Altogether, these composite rankings include more than 40 indicators, ranging from arms imports to bilateral trade to cultural investments, such as “Confucius Institutes.”
Citations
- United States Department of Defense, “Summary of the 2018 National Defense Strategy of The United States of America: Sharpening the American Military’s Competitive Edge,” (2018), available at source.
The Natural Security Map
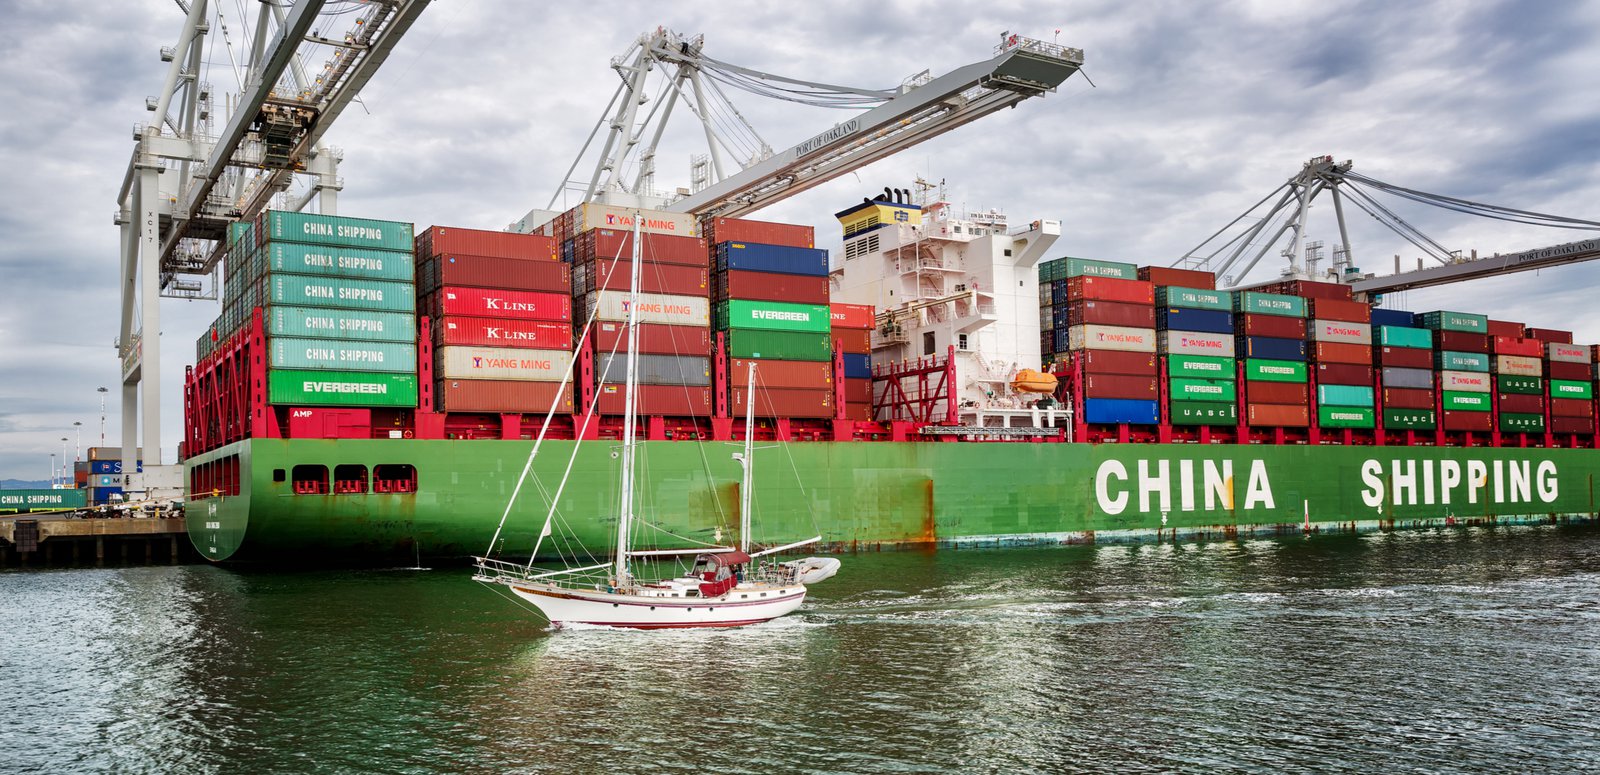
China has the second largest economy in the world, supporting a population of around 1.4 billion people. According to the government of China, the country’s economic growth lifts some 14 million people out of poverty every year.1 It takes considerable natural resources to drive and sustain all of that growth—from energy, to metals and minerals, to food and water—and China depends on extraction and production at home and global trade in goods and services to meet its needs.
The above map ranks nations in order of importance to China’s natural security with a composite score, based on a range of variables, including hydrocarbon and critical mineral reserves, China’s import dependencies, and the relative criticality of certain resources to the country’s economy. On the map, the reddest countries and highest scores are China’s most significant natural security partners; grey means there is no data or no assigned rating. Separately from the map, for purposes of comparison, the Phase Zero team looked at a range of military and soft power indicators, as well. In some cases, China’s military-to-military and soft power ties complement its resource relationships, and in other cases, they reflect a strategic focus on countries in its own region, such as Pakistan or Thailand, regardless of resource wealth. The top focal points for China’s soft power tend to be the world’s largest economies.
The natural security map suggests that two of America’s most important allies and trade partners are also top natural security partners for China: Australia and Canada. Reflecting both its mineral wealth and proximity, Australia is number one in the natural security rankings, with robust bilateral trade in fuel (natural gas and coal) and non-fuel minerals (especially zirconium, lithium, and manganese). China has considerable investments in Australia’s metals sector ($32 billion from 2005 to 2018), as well as energy and agriculture. Australia is fifth in the list of military-to-military ties with China, and fourth as a soft power target. Likewise, Canada’s position as number four in the rankings reflects the country’s mineral and agricultural wealth, with China’s largest investment being in the Canadian energy sector (more than $41 billion from 2005 to 2018).
The United States ranks second in importance for China’s natural security (Phase Zero has a forthcoming report looking at U.S. natural security, as well). Moreover, the United States is third in military-to-military relationships, and first as a soft power target for China. Note that the data are all drawn from 2003-2018, however, and do not reflect new tariffs and other recent bilateral tensions.
Another key observation from the map is that Russia, which the United States identifies as a great power competitor, is also high in China’s natural security rankings. This wide-ranging resource relationship, spanning energy, metals, and agriculture, undergirds a growing strategic partnership between China and Russia. Some of this resource trade and commerce, such as China’s investment in Russia’s energy sector—more than $19 billion from 2005 to 2018—suggests long-term commitments, given the infrastructure involved.
Many resource-rich nations are arguably key battlegrounds for what the U.S. government has termed the “competitive space,” or competition between nations for strategic advantage. This can translate to military alliances (such as NATO), trade and investment agreements (such as the Belt and Road Initiative), or other bilateral or multilateral forms of geopolitical influence.
China and the United States are courting a range of countries within this competitive space, including a number in the Western Hemisphere that are important for China’s natural security. In fact, Brazil is third in importance for China’s overall natural security and in some ways may be more important than Australia or the United States, given the concentration of certain digital age resources in Brazil (e.g. niobium). China also invests in Brazil’s energy, agriculture, and metals sectors, and Brazil is ninth in line for China’s soft power engagement.
Likewise, Chile supplies 22 percent of the lithium China consumes, which is especially significant for the manufacture of batteries, including for electric vehicles, a Chinese priority.2 Kazakhstan and Indonesia are important geostrategic locations, as well as resource suppliers, which China recognizes in a number of ways, including through the Belt and Road Initiative. For example, China invested almost $18 billion in Kazakhstan’s energy sector from 2003 to 2018, and gets a significant proportion of its nickel ores, a key industrial and information age material, from Indonesia.
China’s Resources at a Glance
Metals and Minerals
China is a leading global producer of minerals and metals. While the United States is also a significant producer, it is import dependent on China for a number of minerals critical to digital age civilian and military technology (see, for example, the “What’s in a Cell Phone?” chart below). At the same time, while China exported more than $24 billion in 2017 in non-ferrous, specialty, and precious metals, the country also imported $159 billion of those resources. These imports come from a wide range of countries, though more than $60 billion (or almost 40 percent) originate in Australia, South Africa, Chile, Peru, and the United States.
In addition to mineral imports, China invests directly in the mining sector of other countries (an estimated $140 billion between 2005 and 2018), particularly in steel and aluminium in Australia and copper in Peru.1
Agriculture
In 2013, President Xi Jinping declared that “the rice bowl of the Chinese people must be held firmly in our own hands.”2 China has indeed dramatically increased the domestic production of staple crops, though the quest for self-sufficiency has generally required significant water and other inputs, such as fertilizer and pesticides, given the relative paucity of arable land in China. In addition, the rapid rate of urbanization and changing dietary patterns3 (toward higher consumption of red meat4, for example) are now driving an increase in imports.5 Imports of soybean, a main ingredient in cattle and livestock feed, are indicative of this trend. Although imports of food today make up a relatively small part of China’s domestic consumption, some of the suppliers can be quite concentrated: in 2017, for example, Ukraine supplied 40 percent of China’s imported maize and New Zealand provided over 50 percent of China’s imported dairy products.6 In addition to importing agricultural goods, China acquires farmland7 and directly invests in agriculture in other countries, an estimated $82 billion8 between January 2006 and May 2018. In 2017, for example, China National Chemical (ChemChina) purchased a 98 percent share of the Swiss pesticide and seed giant, Syngenta, for $43 billion.9
China and Phosphorus
Although the natural security map does not include phosphorus, given some limitations in the available data, phosphorus is a crucial input for agricultural fertilizers. While world resources are plentiful, the price volatility of phosphate rock (jumping 900 percent10 between 2007 and 2008, for example), combined with its geographic concentration, introduce some concerns about supply security. Although Morocco and the Western Sahara are home to the majority of the world’s phosphate rock (75 percent of known reserves), China is actually the world’s leading producer, producing 144 million tons in 2017, compared to Morocco’s 33 million tons.11 Indeed, China is a net exporter of phosphate rock and the world’s leading exporter of phosphatic fertilizers. The United States currently meets much of its demand for phosphatic fertilizers with domestic production, but is nonetheless among the top global importers, as well. Industry analysts project world consumption will increase by approximately 3.5 million tons by 2022, with Africa, India, and South America accounting for the majority of the increase.12
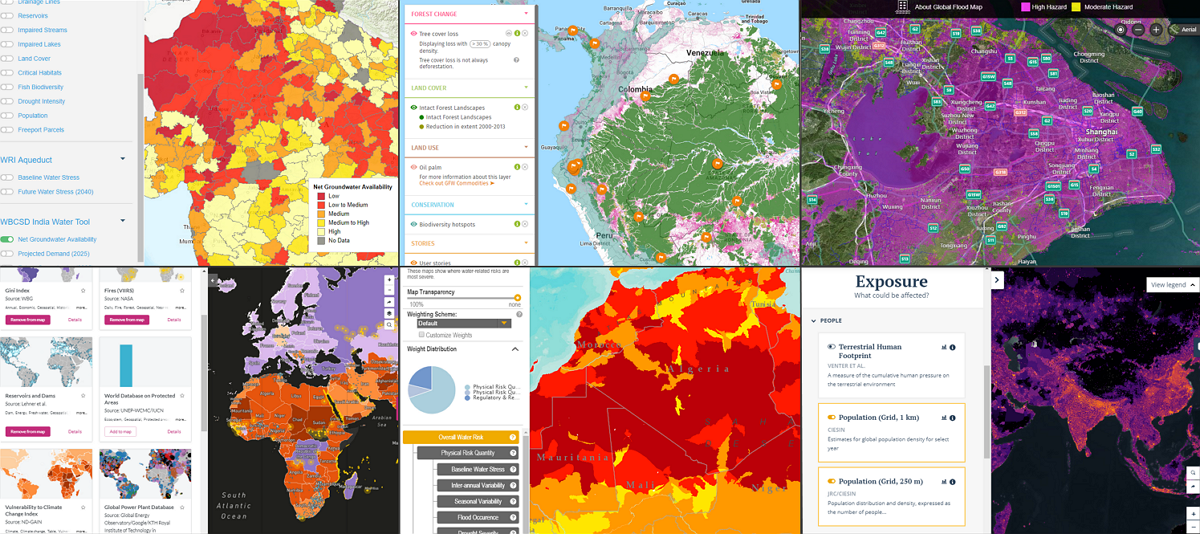
Water
China accounts for about 6 percent of the world’s fresh water and 20 percent of the global population, with annual water shortages exceeding 50 billion cubic meters.13 In other words, the demand for water is outpacing supply, which is exacerbated by pollution and the uneven regional distribution of resources. Northern China14, for example, is home to roughly 47 percent of the population and contains 65 percent of China’s arable land, yet accounts for only 20 percent of water that is naturally available.15 Water availability and quality issues are particularly acute in regions of China that are rapidly urbanizing, including Beijing.16 Agriculture accounts for roughly 62 percent of water use in China, and through over-application of fertilizer and pesticides, it accounts for significant water pollution, too.17
Energy
China is the world’s largest energy consumer, with a portfolio that is at once diverse and concentrated in terms of both energy supplies and suppliers. Almost two-thirds of China’s primary energy consumption is coal, accounting for half of all global coal use. The country also accounts for 46 percent of global coal production, with 13 percent of the world’s proven coal reserves.18 It is nonetheless the world’s largest importer of coal, as well, with Australia and Indonesia as the lead suppliers. When it comes to oil, China has surpassed the United States as the world’s largest consumer and importer, and is dependent on imports for around 60 percent of oil consumption.19 Although China has more than a dozen suppliers of oil, it relies heavily on Russia, Angola, and the Persian Gulf. Natural gas only accounts for about 7 percent of China’s primary energy consumption, but both production and imports are growing fast, with Turkmenistan, Australia, and Oman as the biggest suppliers. Likewise, China is seeing fast growth in renewable energy but from a low base, about 3 percent of China’s primary energy consumption today.20 At the same time, China is an important driver in the global adoption of renewables, accounting for 36 percent of worldwide growth.21 The country has invested extensively in a range of energy projects in other countries, including in the United States, totaling around $365 billion from 2005 to 2018.22
Today, China is fundamentally energy insecure, given its high reliance on imports and the underlying difficulty of quick substitution, when it comes to energy consumption. China is vulnerable to market forces, disruptions as a result of civil unrest or natural disasters in the supply chain, or deliberate manipulation, through sanctions or other economic tools and weapons, although the country does have a strategic stockpile to mitigate these risks. Nonetheless, the overwhelming reliance on fossil fuels is not only a present-day source of insecurity, it also contributes to China’s long-term vulnerability to climate change.
Citations
- American Enterprise Institute and Heritage Foundation, Chinese investment dataset – China Global Investment Tracker (CGIT), available at source.
- Lu Rucai, “Better Environment, Better Life in the Countryside – Expounding China’s Central Rural Work Conference,” China Today, 03 March 2015, available at source.
- Suwei Jiang and Richard Ferguson, “China’s Agricultural Challenges: Road to be Travelled,” PriceWaterhouseCoopers (PWC), October 2015, available at source.
- United Kingdom Ministry of Defence, “Global Strategic Trends: The Future Starts Today,” Sixth ed., (2018), available at source.
- Fred Gale, James Hansen, and Michael Jewison, “China’s Growing Demand for Agricultural Imports,” United States Department of Agriculture, February 2015, available at source.
- Chatham House: The Royal Institute of International Affairs, Resource Trade.Earth, available at source.
- Elizabeth Gooch and Fred Gale, “China’s Foreign Agricultural Investments,” United States Department of Agriculture, April 2018, available at source; For a compilation of China’s overseas acquisitions of farmland see “Overseas large-scale farmland acquisitions for food production made by Chinese companies since 2006,” GRAIN, available at source.
- Ibid, footnote 4.
- Ibid.
- Markus HeckenMüller, Daiju Narita, and Gernot Klepper, “Global Availability of Phosphorus and its Implications for Global Food Supply: An Economic Overview,” Kiel Institute for the World Economy, January 2014, available at source.
- United States Department of the Interior, United States Geological Survey, “Mineral Commodity Summaries 2018,” USGS, 31 January 2018, available at source.
- Ibid.
- Global Water Partnership, “China’s Water Resources Management Challenge: The ‘Three Red Lines,’” GWP (2015), available at source.
- Yong Jiang, “China’s Water Security: Current Status, Emerging Challenges and Future Prospects,” Environmental Science & Policy 54: pp. 106-125, (2015), available at source.
- Jian Xie et al., “Addressing China’s Water Scarcity: Recommendations for Selected Water Resource Management Issues,” The World Bank (2009), available at source.
- Xian Cheng et al., “Identification of Regional Water Resources Stress Based on Water Quantity and Quality: A Case Study in a Rapid Urbanizing Region of China,” Journal of Cleaner Production 209: pp. 216-223, (1 February 2019), available at source.
- China Water Risk, “Agriculture — important global producer but #1 water user & polluter,” CWR (2018), available at source.
- BP Statistical Review of World Energy (June 2018), available at source.
- United States Energy Information Administration (EIA), “China Surpassed the United States as the World’s Largest Crude Oil Importer in 2017,” EIA (5 February 2018), available at source.
- Ibid.
- China Power Project, “How is China’s Energy Footprint Changing?” Center for Strategic and International Studies (CSIS), available at source.
- Ibid, footnote 4.
Looking Ahead: Climate Change
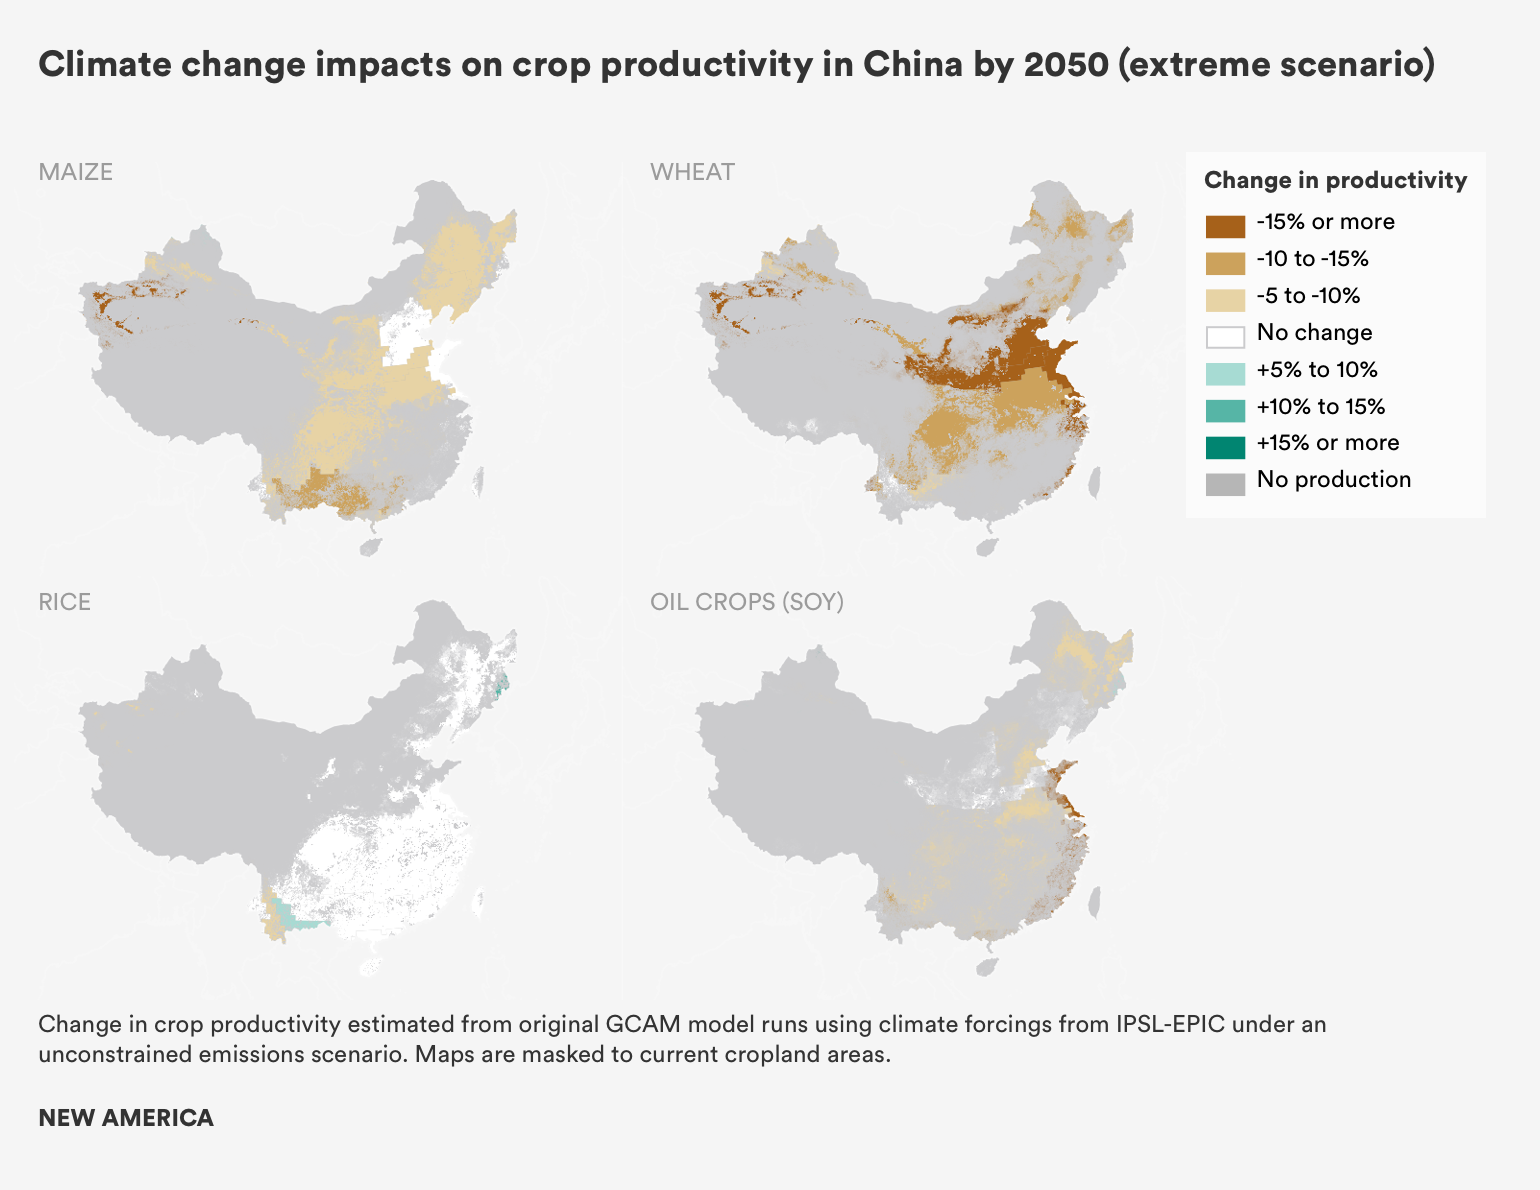
Climate change poses significant challenges for China’s future natural security, across all categories.1 This map, for example, is drawn from forthcoming research by Phase Zero and the Joint Global Change Research Institute, which looks at how climate change may affect China’s agricultural production. In this scenario, with a business-as-usual level of greenhouse gas emissions (i.e., no significant reduction or increase over the current trend), China may see significant decreases in production of wheat, rice, and root crops by 2050.
Today, the country is the number one contributor to global greenhouse gas emissions, more than the United States, Europe, and Japan combined.2 On the other hand, China’s per capita emissions are less than half those of the United States. The high total emissions reflect China’s economic growth and the size of the population, but also an overwhelming reliance on coal and a swiftly-growing transportation sector.3 Even with the country’s ambitious plans for promoting low- and no-carbon fuels, China’s demand for fossil fuels is likely to remain high to mid-century, with significant environmental, human health, geopolitical, and market implications. China’s commitment to increasing its use of renewable energy and electric vehicles also implies more demand for the critical minerals these technologies require, such as lithium, tellurium, niobium, nickel, and cobalt.4
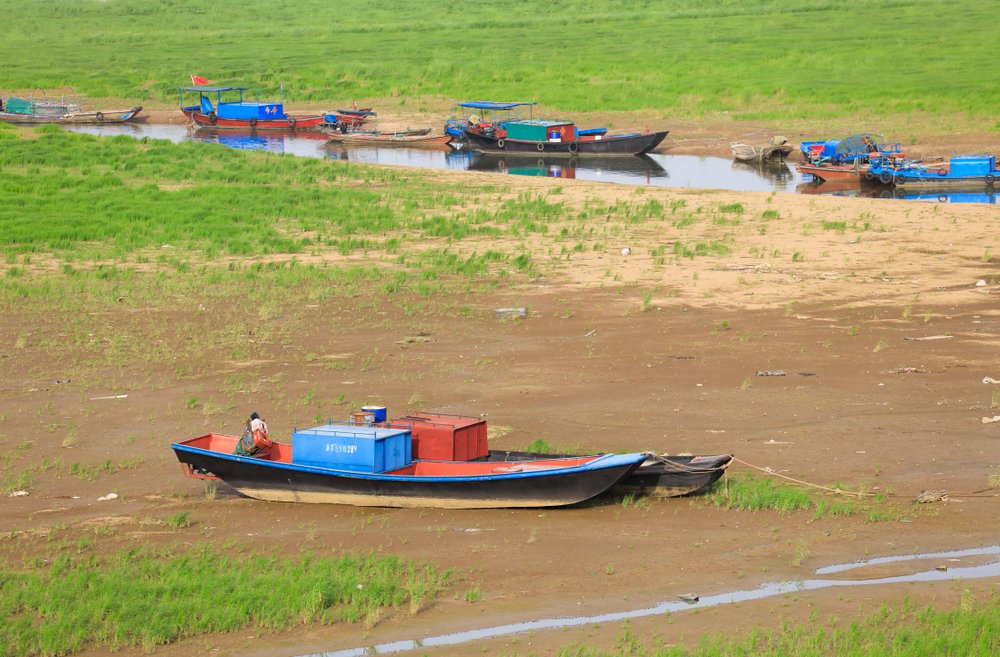
humphrey / Shutterstock
Climate change will have a range of impacts in China, given the size of the country (it is comparable in size to the United States) and in ecosystems that vary from desert to rainforest.5 Projected effects include more high heat days, shifts in precipitation patterns, sea level rise along the coasts, glacier melt, and more frequent or severe extreme weather events.6 The results of these changes may include more floods and droughts, saltwater intrusion into freshwater and productive land, and more frequent or more severe sudden onset natural disasters, such as cyclones.7 There will be consequences for agriculture, water, thermal and hydroelectric energy generation, human health, and disaster recovery. In addition, if China succeeds in cutting its greenhouse gas emissions, it will need to shift its primary energy mix away from coal, but it may become more reliant on other resources, as noted above. Indeed, a global transition away from fossil fuels, along with the ongoing information revolution, will generally increase demand for these materials, which is likely to increase international competition for both terrestrial and ocean bed mineral resources.
Citations
- National Intelligence Council (NIC), “China: Impact of Climate Change to 2030,” NIC Special Report (April 2009), available at source.
- United States Environmental Protection Agency (EPA), “Greenhouse Gas Emissions,” EPA, available at source.
- International Energy Agency (IEA), “World Energy Outlook to 2017: China,” IEA (14 November 2017), available at source.
- International Energy Agency (IEA), “China 13th Renewable Energy Development Five Year Plan (2016-2020),” IEA (01 June 2018), available at source.
- Jingyun Fang et al., “Climate Change, Human Impacts, and Carbon Sequestration in China,” PNAS 115, no. 16: pp. 4015-4020, (17 April 2018), available at source.
- Li Y et al., “Projecting Future Climate Change Impacts on Heat-related Mortality in Large Urban Areas in China,” Environmental Research 163: pp. 171-185, (May 2018), available at source.
- Chris Sall, “Climate Trends and Impacts in China,” The World Bank (September 2013), available at source.
A Brief Note on Methodology
To better understand the relationship between China’s natural resources and strategic priorities, the Phase Zero project team identified 42 key indicators. These indicators measure China’s engagement with the world in various units, ranging from the dollar value of investments to the number of Confucius Institutes in a country, and are the most current data available for each category. The list has the potential to be iterative, as we find new relevant data and update some data. The team started building a matrix with countries China has publicly identified as important partners, such as participants in the Belt and Road Initiative, and then expanded to 180 countries, as trade and other data pointed to the importance of additional countries.
The Phase Zero team then sorted certain indicators into three bins: (1) Resources; (2) Military-to-Military (Mil-Mil); and (3) Soft Power. The resource ranking map reflects only the first bin: Resources.
The values of the indicators within each bin are scored on linear scales of 1-10. For the Resources bin, the indicators are not only significant in of themselves, but also in relative terms. China, for example, has 101 suppliers of oil, but Russia supplies more than 14 percent of that oil, and Saudi Arabia almost 12 percent. We developed weighted Resources rankings to reflect the relative scale and scope of these resource relationships. Phase Zero took all of the indicators related to natural resources into account in ranking the countries in order of importance to China’s resource security. This is a composite index based off of the data available.
The full methodology document can be downloaded here.
More About the Authors

Wyatt Scott