Varying Degrees 2021
Abstract
Varying Degrees 2021: New America’s Fifth Annual Survey on Higher Education interviewed 2,620 Americans ages 18 and older to better understand their perceptions of education after high school, including oversamples of Black, Latinx, Asian Americans, current undergraduate students, and student loan borrowers. It provides important trend data to judge how attitudes about the value of education after high school, how it’s funded, and how it should be held accountable have changed over the past five years, particularly since the COVID-19 pandemic. This year we pay particular attention to the pivot to online education and the response of colleges and universities during the COVID-19 crisis. We also focus on President Biden’s education after high school policy priorities.
Acknowledgments
Varying Degrees was funded by the Bill & Melinda Gates Foundation. New America thanks the foundation for its support. The findings and conclusions contained within are those of the authors and do not necessarily reflect positions or policies of the Foundation.
The authors would like to thank Stephen Burd for editing, Sabrina Detlef for her copyediting support, and Riker Pasterkiewicz, Julie Brosnan, Fabio Murgia, Joe Wilkes, and Naomi Mourduch Toubman for their communication and data visualization support.
Downloads
Varying Degrees 2021 Questionnaire
Varying Degrees 2021 Data File
NORC Card General Population
NORC Card Student Loan Borrower Oversample
NORC Card Current Undergraduates Oversample
General Population 2021 Banner Tables Set 1
General Population 2021 Banner Tables Set 2
General Population Banner Tables Set 3
Codebook
Student Loan Oversample Banner Table 1
Student Loan Oversample Banner Table 2
Student Loan Oversample Banner Table 3
Preface
What a year it has been. The nation grappled with a public health crisis unlike anything seen since the 1918 flu pandemic. The result has been millions of infections nationwide and nearly 600,000 deaths domestically, catapulting COVID-19 into the top three causes of death in America.1 To prevent our medical system from being overwhelmed, the economy was put on ice in spring 2020 and has been slowly thawing ever since with inequitable recovery—the “haves” continue to prosper, while the “have nots” are struggling to keep food on the table and roofs over their heads.2
The public health and economic crisis were not the only upheaval Americans faced. Over the spring and summer, the murders of George Floyd and Breonna Taylor at the hands of police sparked major national and worldwide racial justice protests. Right in front of New America’s office, steps from the White House, protesters took to the streets and were violently disbanded by armed officers. Meanwhile, we were working remotely on Varying Degrees, our annual survey about higher education in America.
In November 2020, Americans headed to the polls. Despite the Trump administration’s best efforts to undermine the election with unsubstantiated allegations of voter fraud, President Biden was declared the winner. The decisive win, however, did not stop the mass proliferation of conspiracy theories, often instigated by President Trump himself, and a coordinated effort to prevent vote certifications in several states, which culminated in the deadly insurrection on the nation’s Capitol in January.
America has a lot of healing to do. President Biden and Congress hit the ground running, promising vaccination for all eligible adults starting last month in April and passing relief bills. However, the nation continues to grapple with a racial reckoning long overdue.
Meanwhile, colleges and universities have enrolled millions of students, educated them mostly online, and struggled to meet their basic needs in one of the most difficult years in the history of modern higher education. Enrollments suffered, with an overall decline of 4.4 percent year over year, and a more precipitous and alarming 10 percent decline at community colleges.3 Most campuses had to deal with losses in revenues due to dips in enrollment, reductions in auxiliary revenues, and the costs of dealing with the pandemic. Some institutions are just hanging on, in hopes that the academic year 2021–2022 will be more similar to 2019–2020. Many were forced to lay off staff and faculty along with consolidating or cutting academic programs.
Last year, the data collection for Varying Degrees occurred right before the full weight of the pandemic hit, turning all our lives upside down. One year later, our data collection happened at what we hope is a turning point of this crisis. The results this year show that in many ways, even though the pandemic turned our lives upside down, it did not greatly change Americans' views about education after high school on most questions.
Varying Degrees turns five just as we enter what we hope is a new normal. We now have five years of data, and thus an understanding of the impact national events have had on the opinions of Americans about education after high school. We have seen two presidential elections, a global pandemic, economic recovery and recession and recovery again, midterm elections, culture wars on campus, and a racial reckoning.
As the health crisis winds down and we enter a new phase of economic recovery—one that will rely on millions of students entering or returning to colleges and universities—it will be vital that we understand America’s perceptions of the value of educational opportunities after high school, how these opportunities are funded, and how we hold institutions accountable for this investment.
Citations
- Rachel Treisman, “CDC: COVID-19 Was 3rd-Leading Cause of Death in 2020, People of Color Hit Hardest,” March 31, 2021, NPR,source
- Rani Molla and Emily Stewart, “America’s Deeply Unequal Economic Recovery, Explained in 7 Charts,” February 5, 2021, Vox, source
- National Student Clearinghouse Research Center, “COVID-19: Stay Informed with the Latest Enrollment Information,” March 11, 2021, source
Executive Summary
Varying Degrees is New America’s nationally representative annual survey on how Americans feel about educational opportunities after high school.1 This year marks its fifth anniversary. We now have five years of trend data that show that Americans believe in the value of education after high school, that they want it to be more adequately funded by state and federal governments, and that colleges should be held accountable for that investment. Looking over our data over five tumultuous years—in which we saw two challenging presidential elections, including an insurrection; a global pandemic; economic recovery and recession; culture wars on campus; and a nationwide racial reckoning—it is remarkable how little fundamental beliefs about education after high school have changed. As in previous years of the survey, we focus on the general population overall, and highlight findings based on political party identification and other demographics.
Even though many Americans have maintained consistency in their views about educational opportunities after high school, there are signs from some questions that this past year, in all its particularities, has revealed some simmering pessimism. In early 2020, 69 percent of Americans said that colleges and universities were having a positive effect on the way things were going. Just one year later, that view has fallen to 58 percent.
The past year has been incredibly difficult in the lives of all Americans. As we begin to recover from the pandemic and the economic recession, educational opportunities after high school will be important to economic recovery and the undertaking of a new normal in this country. President Biden and a new Democratic Congress are looking to tackle some of the most difficult issues facing students and borrowers: affordability and loan forgiveness, funding, accountability, and the impact of COVID-19.
Our key findings this year:
- Education after high school continues to offer a good return on investment and prepares a strong American workforce. Approximately three in four Americans believe that higher education offers a good return on investment, and about 80 percent believe that public colleges and universities prepare a strong American workforce.
- The quality of online education, however, is questionable compared to in-person instruction and should be less expensive. Over half (61 percent), believe that the quality of online education is worse than in-person instruction, and four in five Americans believe online programs should be less expensive than in-person programs.
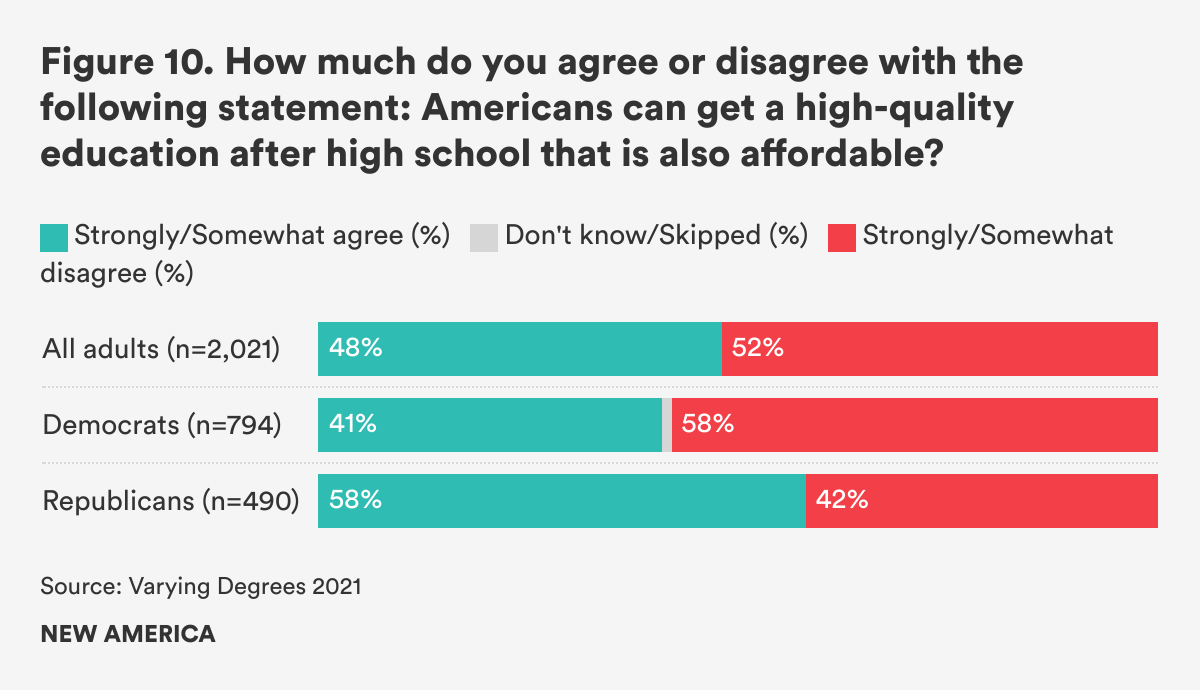
- Americans are mixed about whether students have affordable access to education after high school. Americans are divided on whether someone can get a high-quality education after high school that is also affordable (48 percent agree).
- Americans want colleges to be transparent about their outcomes, and they want them to be held accountable for taxpayer investment. Overwhelmingly, 93 percent of Americans say it is important for institutions to provide publicly-available data on student outcomes.
- Americans believe President Biden and Congress should prioritize free community college when it comes to higher education policy. While no one policy of those listed were prioritized by the majority of Americans, two in five Americans (41 percent) backed some form of tuition-free college (either two- or four-years) as the most important priority.
- A majority of Americans think that those colleges and universities that decided to hold in-person classes fall 2020 made the right decision. Just over half (57 percent) of Americans believe that it was the right decision for some colleges to bring back students for in-person learning for the 2020–21 academic year.
- Americans do not believe standardized test scores should figure prominently in admissions decisions. Approximately 66 percent of Americans agreed with the decision of many colleges and universities to go test blind or test optional this year. Only 7 percent of those who agreed with going test optional this year want standardized test scores to be a critical piece of information in admissions decisions moving forward.
- Americans widely support discharging student loan debt for those students who attended schools that misrepresented their programs or outcomes. A majority of Americans (79 percent), across party lines, agree that borrowers should have their student debt canceled if their college or university misrepresented information about their programs of study or student outcomes.
Citations
- See methodology in the appendix.
Findings
Varying Degrees 2021: New America’s Fifth Annual Survey on Higher Education interviewed 2,620 Americans ages 18 and older to better understand their perceptions of education after high school, including oversamples of Black, Latinx, Asian Americans, current undergraduate students, and student loan borrowers.1 It provides important trend data to judge how attitudes about the value of education after high school, how it’s funded, and how it should be held accountable have changed over the past five years, particularly since the COVID-19 pandemic. This year we pay particular attention to the pivot to online education and the response of colleges and universities during the COVID-19 crisis. We also focus on President Biden’s education after high school policy priorities.
Value
Overall, Americans continue to believe in the value of educational opportunities after high school. Although three in five Americans believe that well-paying and stable jobs are easily accessible to people with just a high school diploma or GED (General Educational Development), only one in five would feel comfortable recommending that their child or a close family member end their education after receiving a high school diploma. Moreover, 76 percent believe higher education offers a good return on investment.
In a new question this year, we asked what the highest level of education respondents would recommend their child or close family member to pursue. Only 19 percent of Americans feel comfortable recommending a close family member or their child to receive only a high school diploma. But the majority of Americans are interested in their children pursuing an education after high school. Most Americans, 63 percent, want their relative to pursue a bachelor's degree or above. About 26 percent would feel comfortable recommending a child or close family member pursue up to a bachelor's degree, 14 percent recommend a master's degree, and 23 percent would feel comfortable advising them to pursue a doctoral or professional degree. Approximately 10 percent recommend stopping at an associate degree, and 7 percent at a technical certificate. (See Figure 1.)
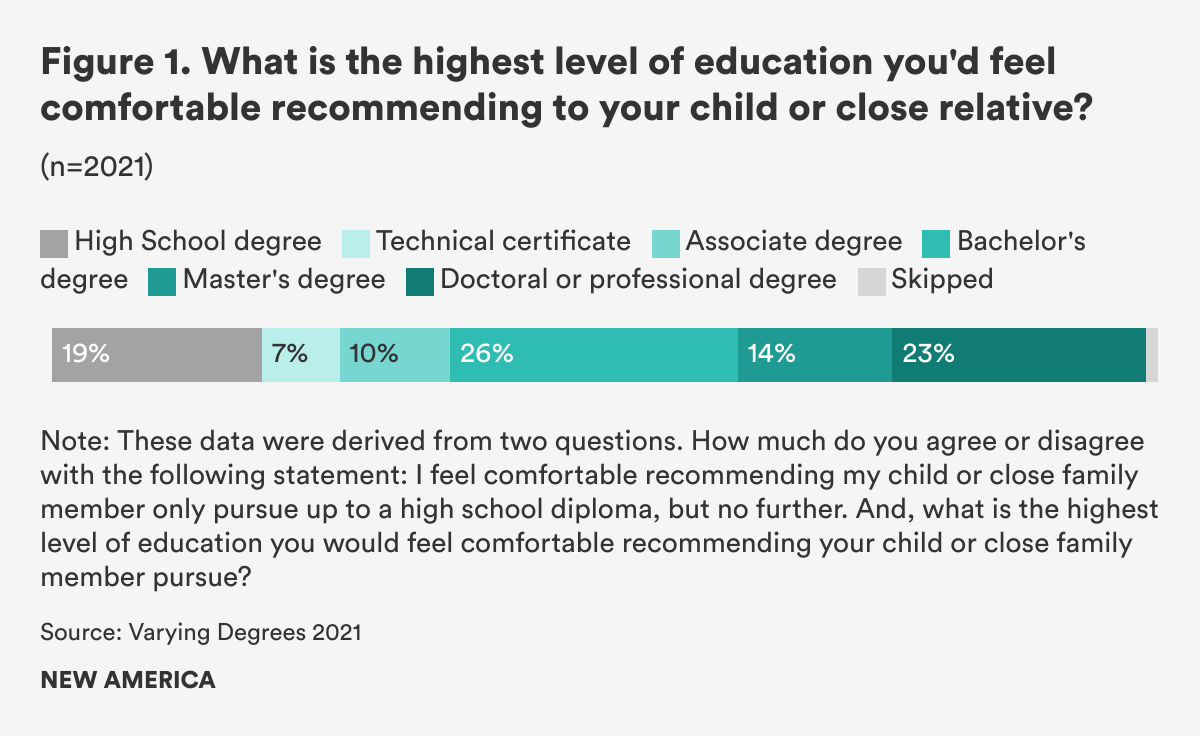
Republicans were more likely than Democrats to consider a high school diploma sufficient, by 23 to 15 percent. Of those who recommend not stopping at a high school diploma, nearly 80 percent of both Democrats and Republicans recommend a bachelor’s or beyond for their child or close family member. Approximately 20 percent of both Democrats and Republicans would be okay recommending an associate or technical certificate as the highest level of education for their child or close family member to pursue.
Education After High School Offers Strong Return on Investment
Approximately three in four Americans believe that an education beyond high school offers a good return on investment for student—this number has largely remained the same since we first started collecting data on this question five years ago. While both Democrats and Republicans believe that an education beyond high school offers a good return on investment, there is a significant statistical difference in how widely those beliefs are shared within each group. Overall, 81 percent of Democrats believe that education beyond high school offers a good return on investment, compared to 75 percent of Republicans. (See Figure 2.)
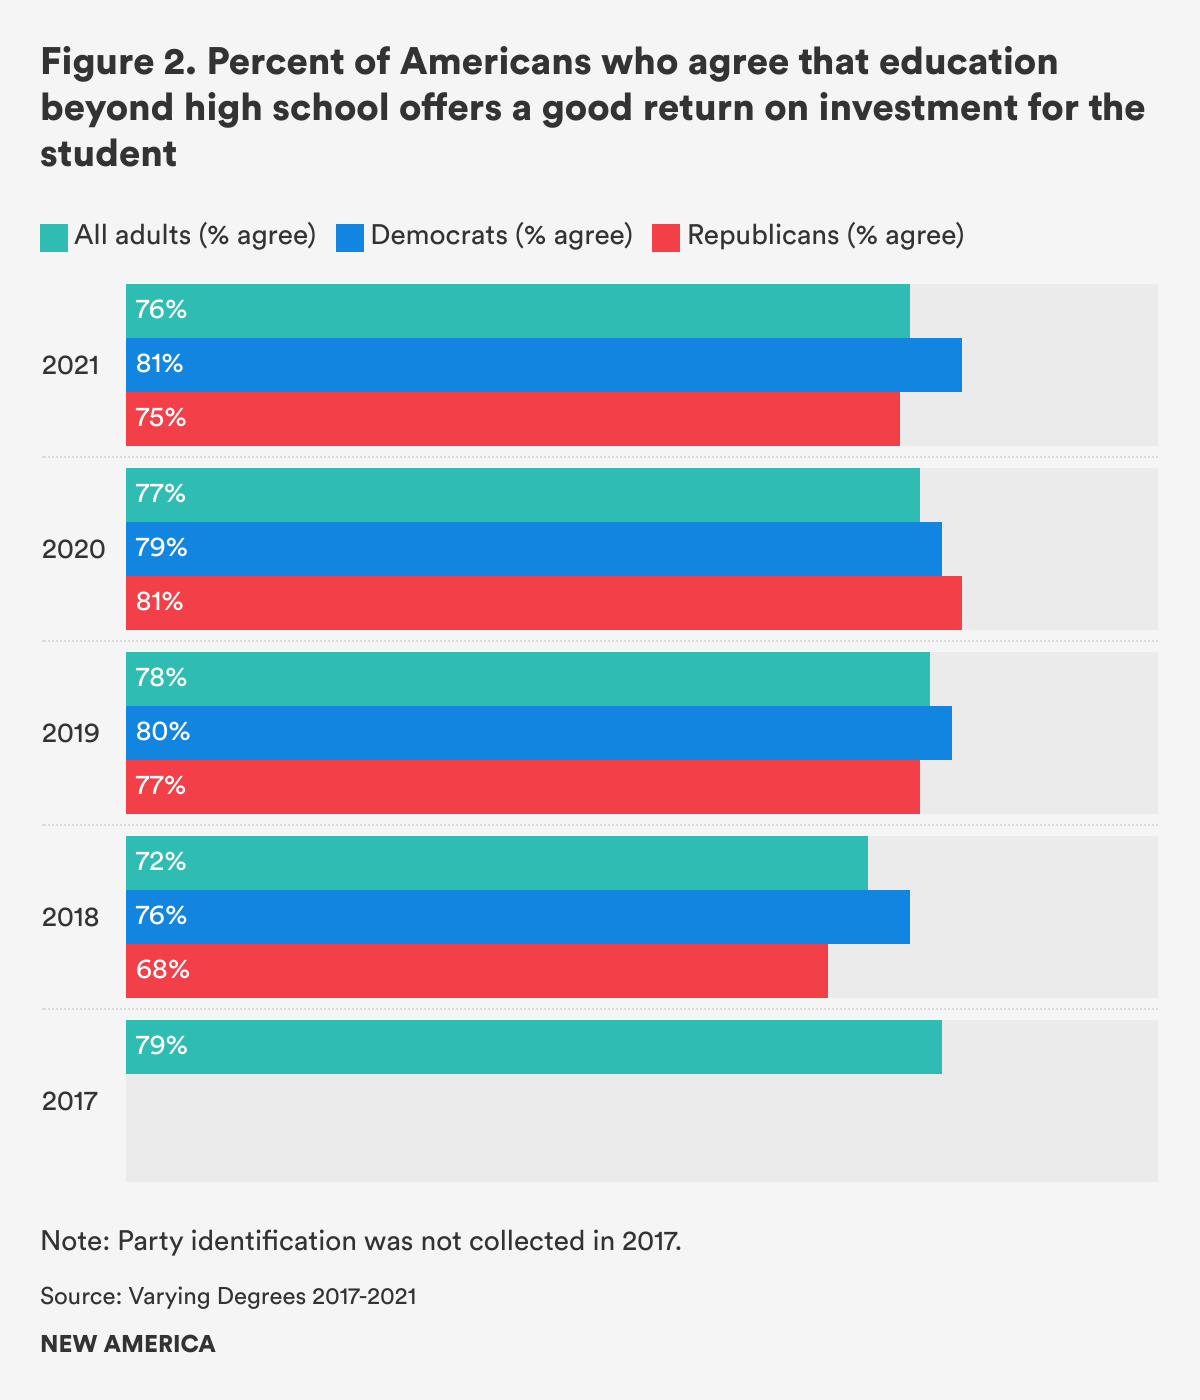
We saw demographic differences among generation and race. Most Baby Boomers agreed that education beyond high school offers a good return on investment (82 percent), compared to Generation Z (72 percent) and Millennials (68 percent).2 Latinx (81 percent) and Asian (82 percent) respondents agreed at higher rates than their Black (74 percent) or white (75 percent) counterparts.
Colleges & Universities Leading America in a Positive Direction
Last year, we adopted a question from a survey conducted by the Pew Research Center about whether colleges and universities are having a positive or negative effect on the way things are going in the country today with wildly different results. In New America’s survey last year, Americans felt much more positive than they did the year before in the Pew survey with the effect of colleges and universities (Pew found 50 percent answered favorably in 2019, compared with New America’s 69 percent in 2020).3 This year, Americans’ positive views of colleges and universities have dropped by over 10 percentage points: 58 percent believe that colleges and universities have a positive effect on the way things are going in this country. (See Figure 3.)
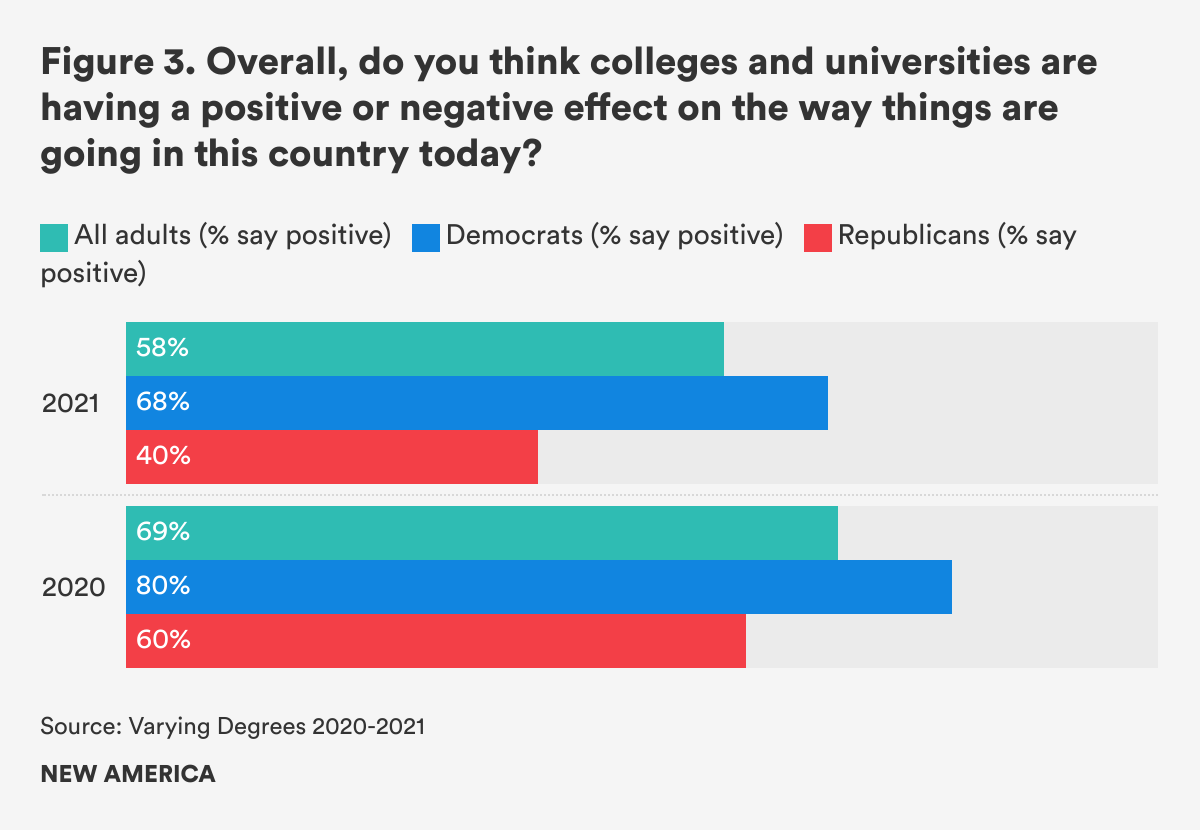
There is a strong and significant partisan divide on this question. Nearly seven in 10 Democrats believe colleges and universities have a positive effect, while only four in 10 Republicans agree.
Higher Education Sectors Contribute to a Strong Workforce: Public & Minority-serving Institutions are Worth the Cost
Roughly eight in 10 Americans believe that community colleges and public four-year colleges contribute to a strong American workforce, and three-quarters feel the same way private nonprofit colleges and universities. A majority of Americans also believe that both minority-serving institutions (72 percent) (for example, an Historically Black College or University, Hispanic-Serving Institution, or Tribal College or University) and for-profit colleges and universities (60 percent) contribute to a strong American workforce. (See Figure 4.)
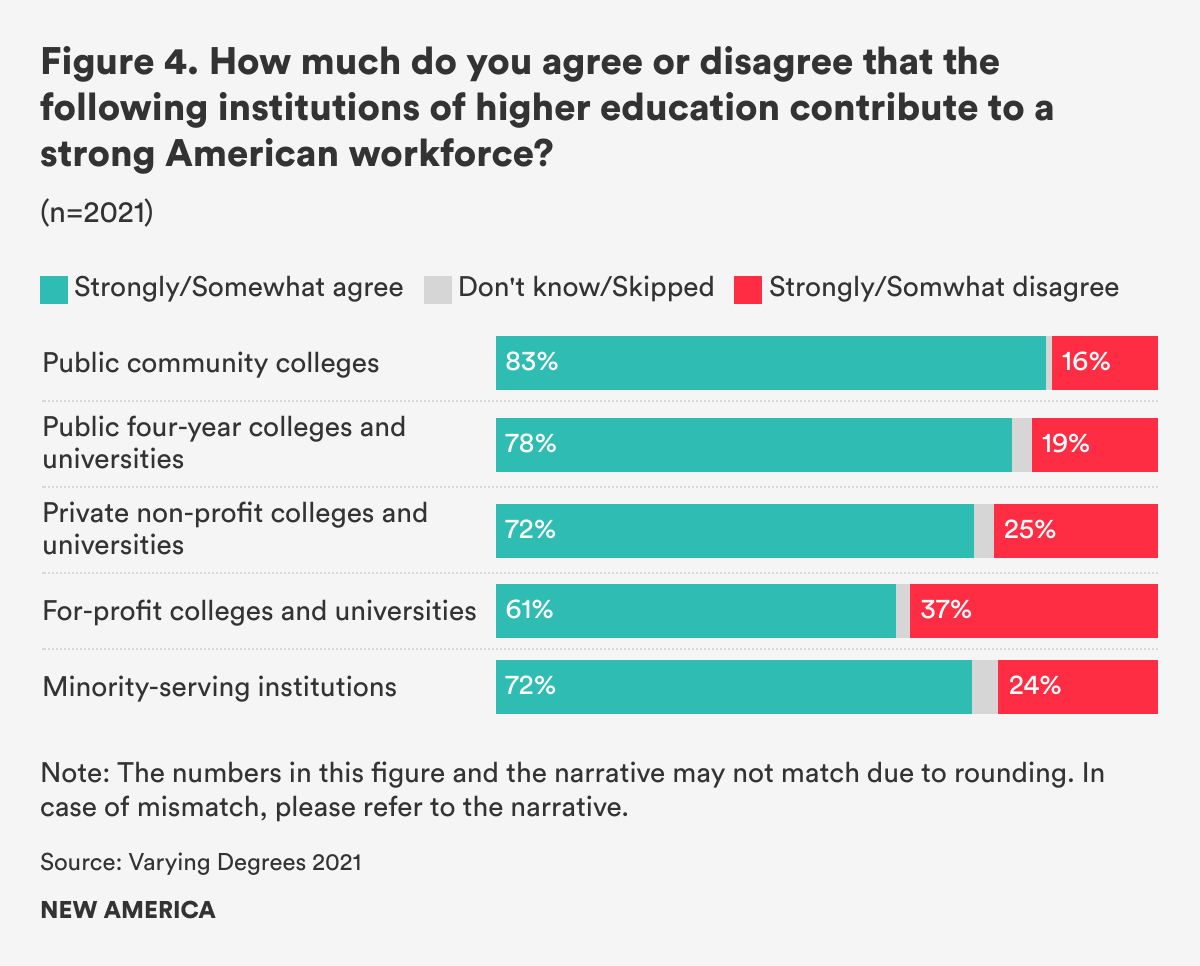
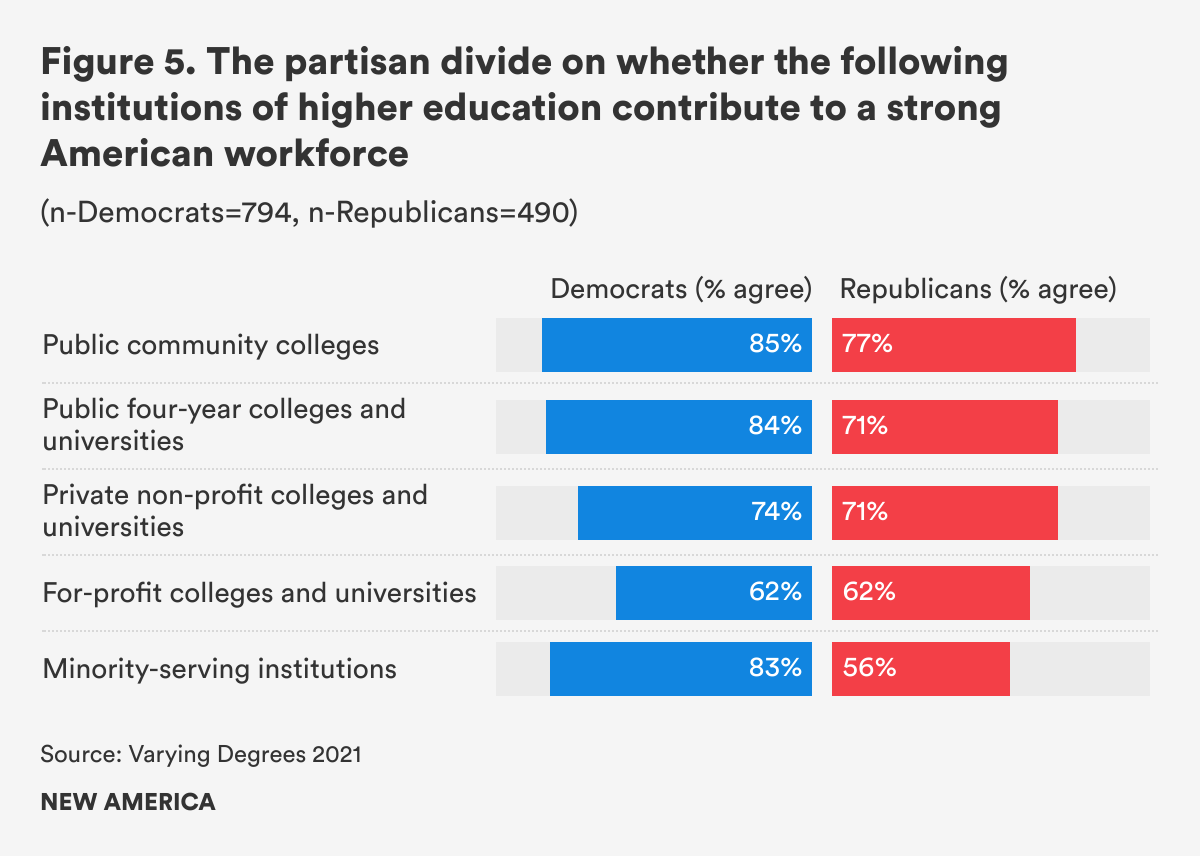
There were differences in between Democrats and Republicans in how widely the groups felt various sectors contribute to a strong American workforce, but a majority of respondents from each political party still agreed that all types of higher education contribute to a strong workforce. (See Figure 5.)
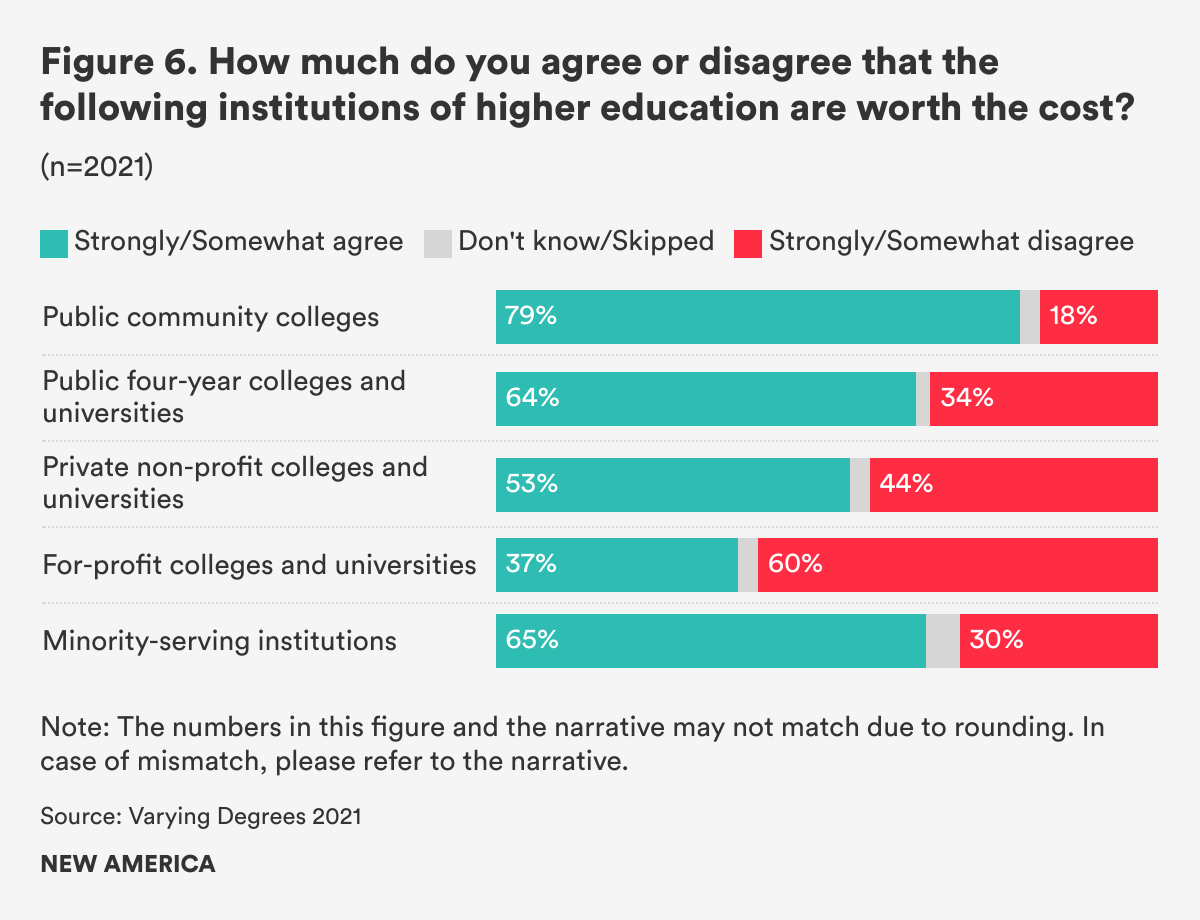
A majority of Americans believe public, private nonprofit, and minority-serving institutions (MSIs) are worth the cost, but the precise level of support varies by institutional type. Community colleges pick up the most support, with 80 percent of Americans saying they are worth the cost. Nearly two-thirds say that public four-year colleges and MSIs are worth the cost. Meanwhile, a slight majority (54 percent) agree that private nonprofit colleges are worth the cost.
The majority of Americans, however, do not believe for-profit institutions are worth the cost. Only 37 percent of Americans say that for-profit institutions are worth the cost, an almost 10 percentage point decline from how they responded in 2019. (See Figure 6.)
Democrats and Republicans both agree that public, nonprofit, and MSIs are worth the cost, though Democrats agree at higher rates. A strong majority of both parties (85 percent of Democrats and 71 percent of Republicans) agree that public community colleges are worth the cost. Some other sectors had fairly strong support from Democrats compared to Republicans: 69 percent of Democrats agree that public, four-year institutions are worth the cost, compared to 56 percent of Republicans; 77 percent of Democrats believe MSIs are worth the cost, compared to 53 percent of Republicans; and 55 percent of Democrats agree private nonprofits are worth the cost, compared to 52 percent of Republicans. Neither Democrats nor Republicans think the for-profit sector is worth the cost (40 percent and 37 percent, respectively).
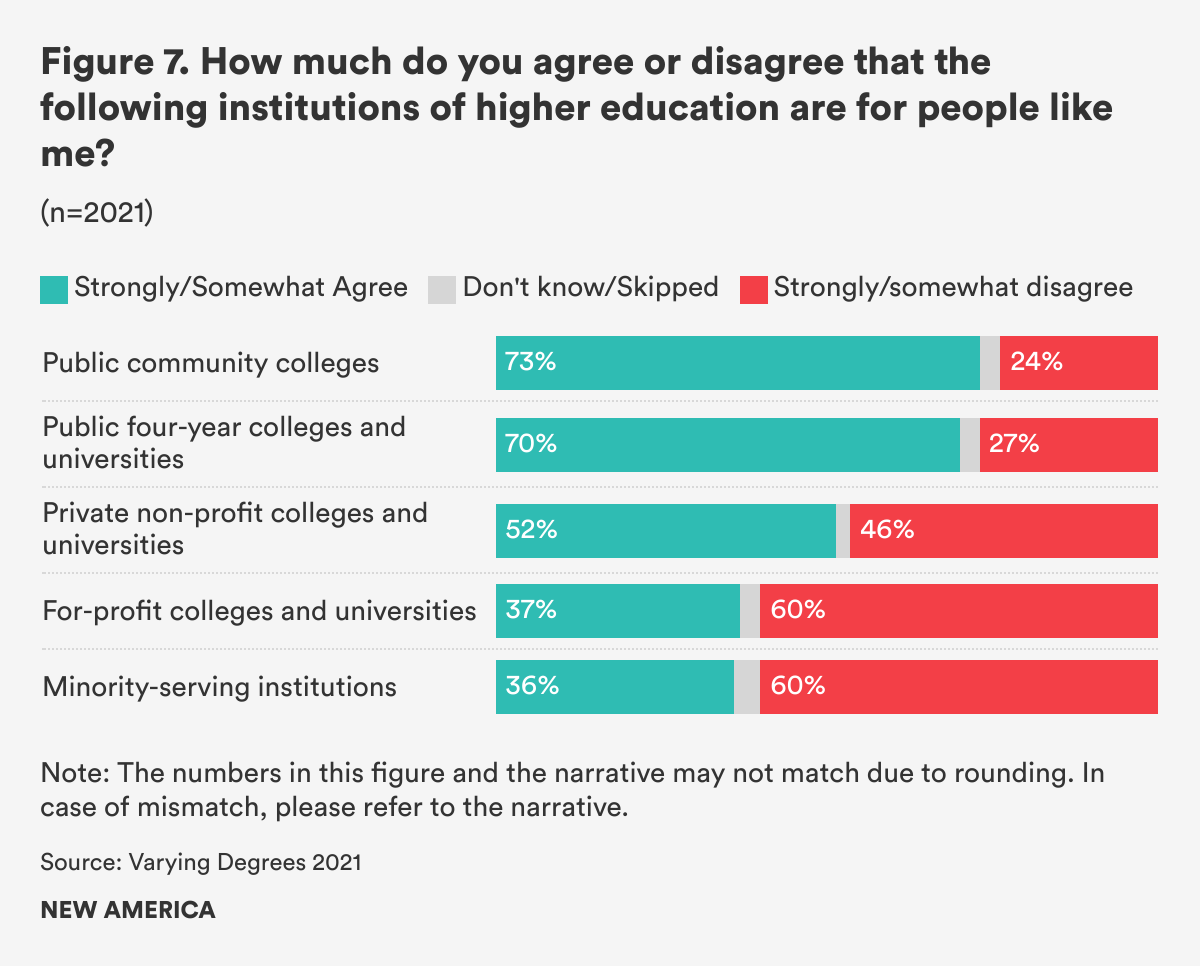
About 70 percent of Americans believe that public two-year and four-year colleges are for people like them, and over half (51 percent) believe that private nonprofit colleges and universities are as well. However, only a little more than a third of Americans say MSIs (36 percent) or for-profit colleges (37 percent) are for people like them. (See Figure 7.)
Democrats and Republicans felt similarly that public two-year (76 and 68 percent, respectively), public four-year (73 and 64 percent), and private nonprofit institutions (51 and 52 percent) are for people like them. They also both agree at lower levels that private for-profit institutions are for people like them (39 and 38 percent). Democrats and Republicans diverge in their belief that MSIs are for people like them (48 versus 22 percent).
Online Education Offers Questionable Quality, Should Cost Less
This year, given the pivot most colleges and universities made to provide classes online due to the pandemic, we asked new questions focused on online learning. Approximately 61 percent of Americans believe the quality of online instruction is worse than in-person instruction, and four in five believe that education beyond high school that is traditionally online should be less expensive than in-person education. (See Figure 8.)
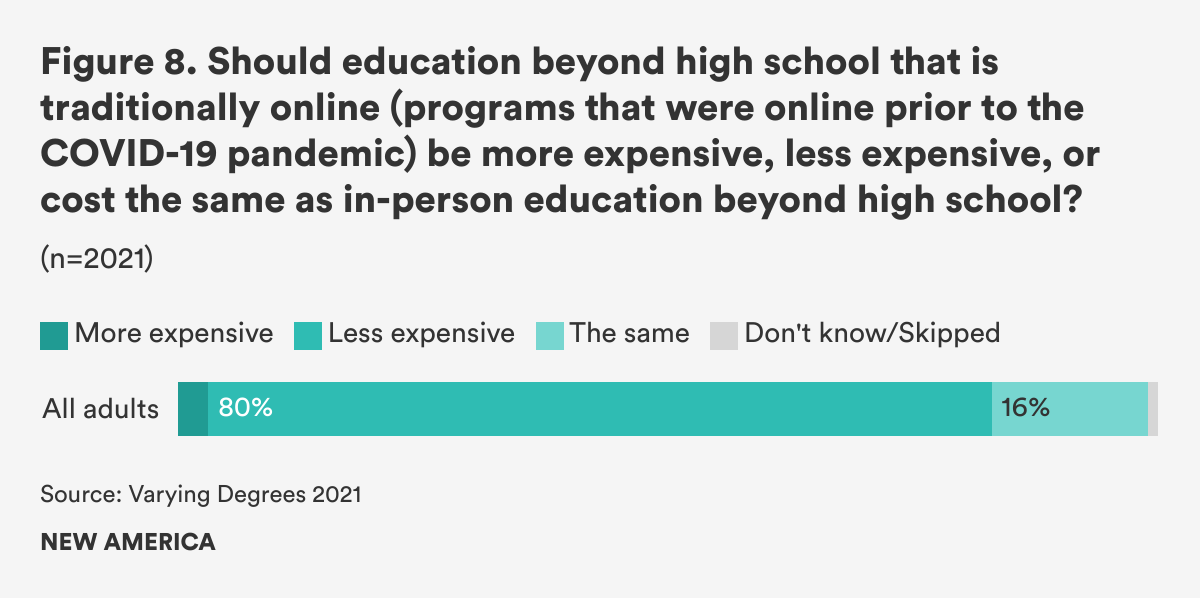
A slightly higher percentage of Republicans (69 percent) than Democrats (61 percent) believe that the quality of online education is worse than in-person instruction. And a strong majority of Americans in both parties believe that online education should cost less than in-person instruction (84 percent of Republicans, 79 percent of Democrats).
Funding
Although it has been a tough year for Americans, one that had the opportunity to sway their opinions on a variety of subjects, they still believe in the value of education after high school as strongly as they did before the pandemic. But with the economy in recession, Americans are deeply concerned not only about the price of a degree, but also with how educational opportunities after high school should be funded.
Only about a third of Americans (35 percent) agree that higher education in America is fine the way it is, the same percentage who said so last year. Over the past five years, Americans’ opinion on higher education has been slightly improving (in 2017, only 26 percent were satisfied with the state of higher education), but our annual surveys have consistently shown that Americans believe higher education needs to change, mostly that it needs to be more affordable.4 (See Figure 9.)
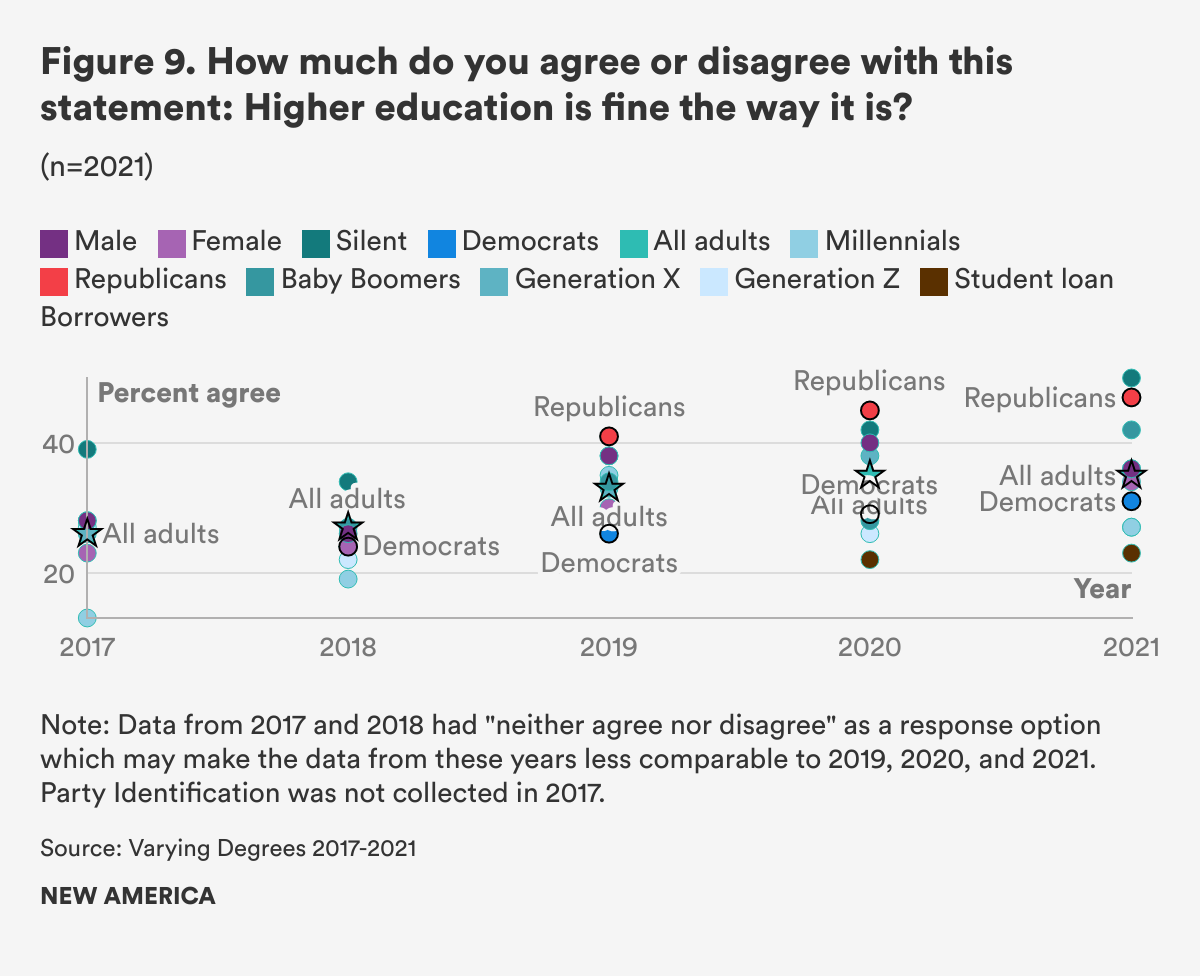
Americans' satisfaction with the current state of higher education vary based on various demographic factors. A significantly larger share of Republicans (47 percent) believe higher education is fine the way it is than Democrats (31 percent). Younger Americans are less satisfied with higher education as it is than their older peers are. Both the youngest generations—Generation Z and Millennials—express lower rates of satisfaction (27 percent) than Baby Boomers (42 percent) and the Silent Generation (50 percent). Student loan borrowers (23 percent) also express less satisfaction with higher education than non-borrowers (39 percent).
Mixed Feelings about Affordability
Similar to the past two years, Americans are divided on whether someone can get a high-quality education after high school that is affordable: 48 percent agree. Democrats and Republicans disagree on the issue. Only 41 percent of Democrats believe that Americans can get a high-quality education after high school that is affordable, compared to 58 percent of Republicans. (See Figure 10.)
Government Must Spend Money on Education after High School
When it comes to who should fund higher education—the government because it is good for society or students because they personally benefit—a majority of Americans believe the burden should should fall on government, though there was a statistically significant decline this year (57 percent in 2021 versus 63 percent in 2020). (See Figure 11.)
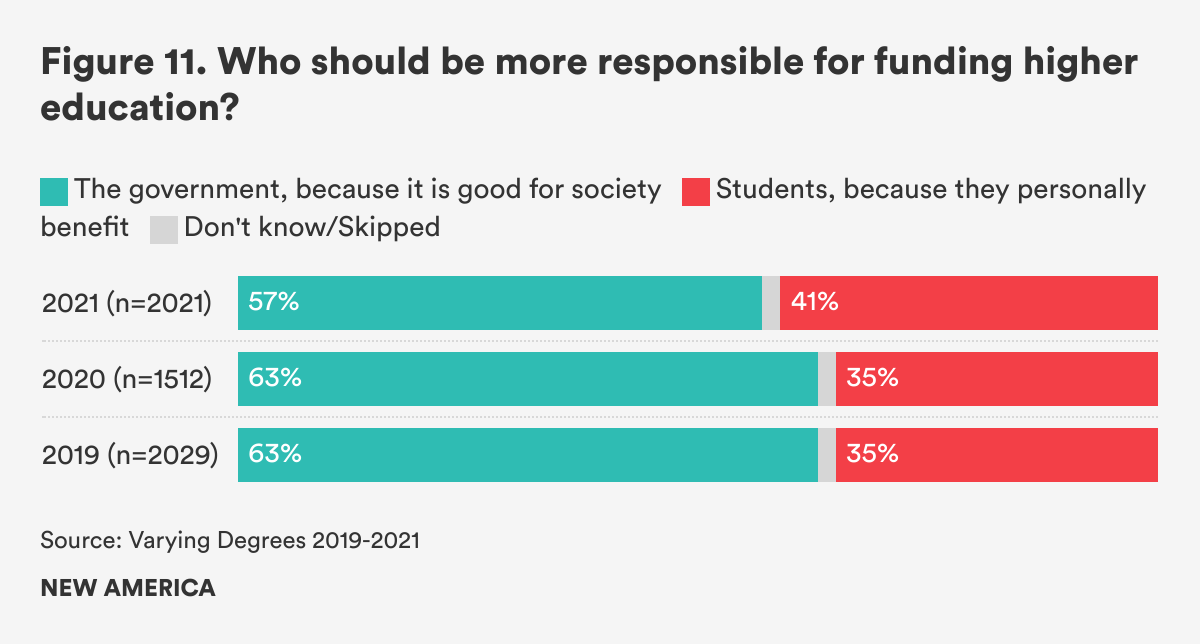
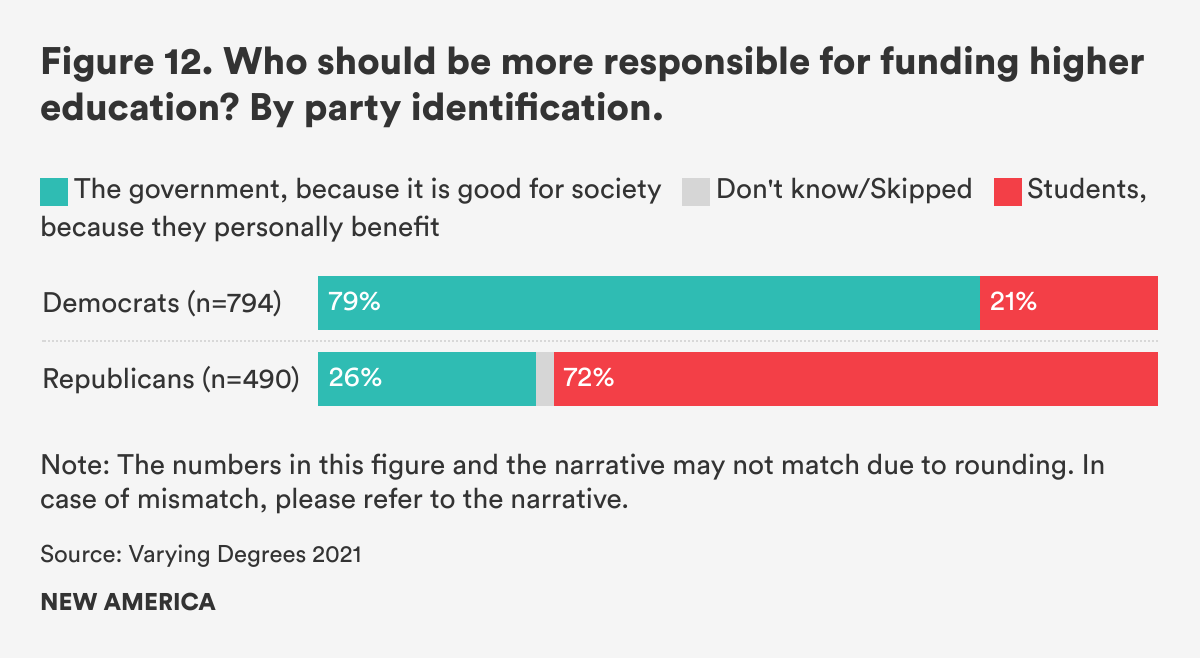
Democrats and Republicans are deeply divided over this question. More than three-quarters of Democrats (78 percent) believe the government should fund higher education because it is good for society. Meanwhile, 72 percent of Republicans say students should fund education beyond high school because they personally benefit. (See Figure 12.)
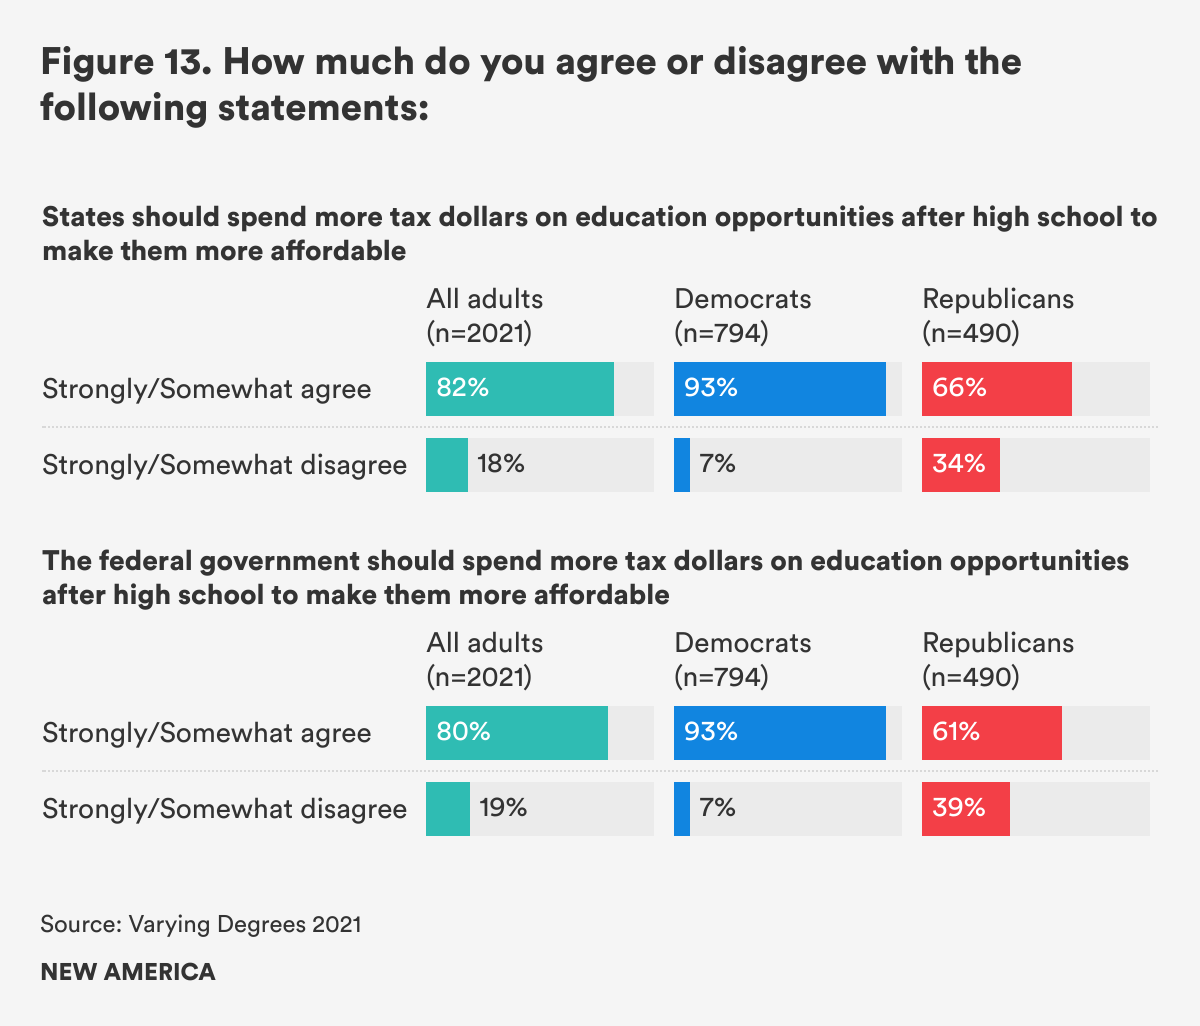
Even though the share of Americans saying that the government should fund higher education because it is good for society is in decline, four out of five still believe that both the federal government and states should spend more tax dollars than they currently do on educational opportunities after high school to make them more affordable.
A majority of both Democrats and Republicans agree that federal and state governments should spend a greater amount of tax dollars on educational opportunities after high school, although broader support is found among Democrats. More than nine out of 10 Democrats feel that both federal (93 percent) and state governments (93 percent) should spend more, while a little more than six in 10 of Republicans agree (61 percent) that the federal government should spend more and about two-thirds of them say that states should spend additional tax dollars as well. (See Figure 13.)
Public Colleges and Universities worth the Investment and are Underfunded
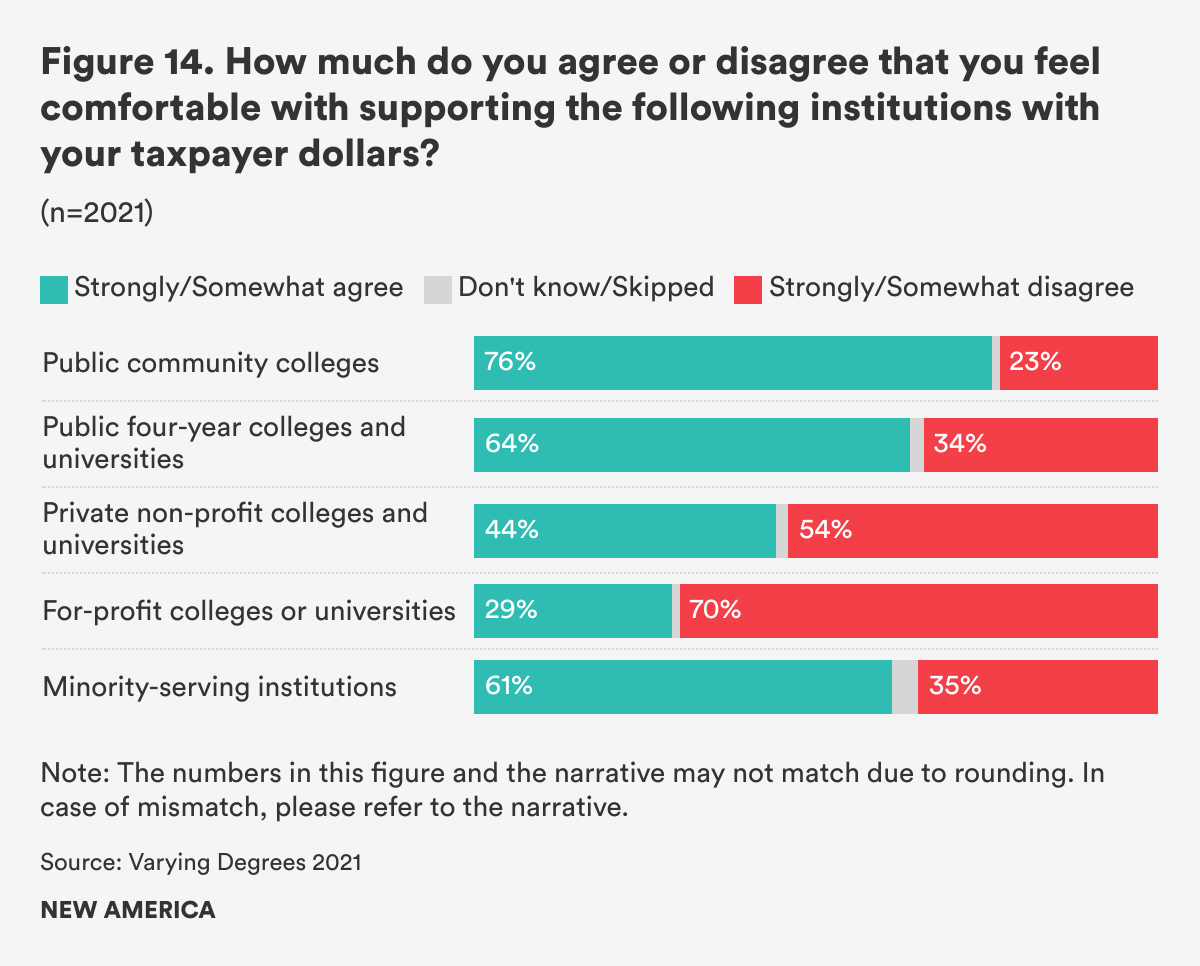
While Americans are positive about spending more taxpayer dollars on higher education to make it more affordable, they have strong opinions about which institutions should receive government subsidy. The only institutional types that a majority of Americans are comfortable supporting with taxpayer dollars are public colleges and universities and minority-serving institutions. Overall, 75 percent of Americans agree with spending their taxpayer dollars on public community colleges, 63 percent on public four-year institutions, and 61 percent on MSIs. Only 29 percent support spending taxpayer dollars on for-profit colleges and universities. (See Figure 14.)
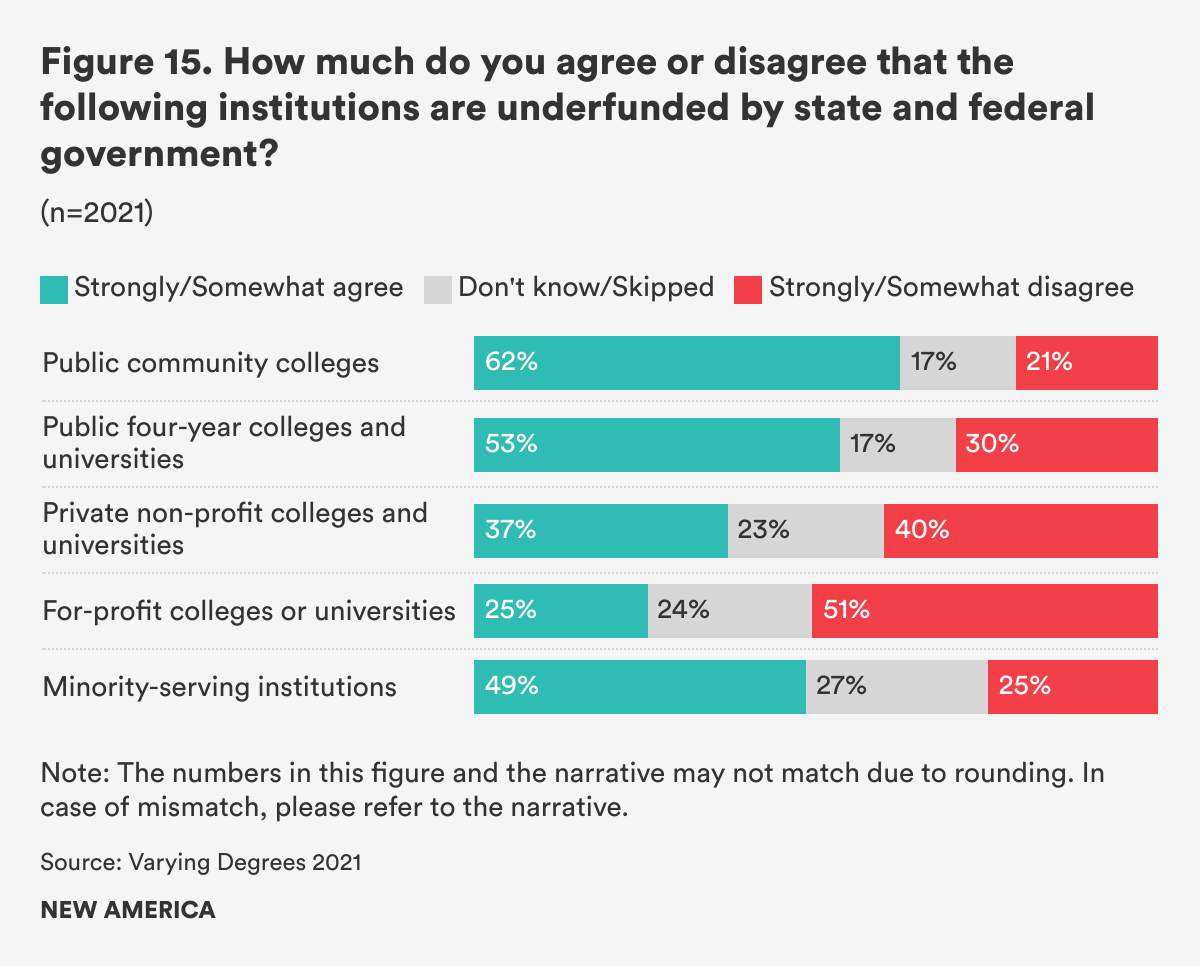
A majority of Americans believe public colleges and universities are currently underfunded by state and federal governments (63 percent believe public community colleges are underfunded, and 54 percent agree public four-year colleges are underfunded). Americans are split as to whether MSIs are underfunded (49 percent), and only a small share believe that the private nonprofit sector (37 percent) and for-profit sector (25 percent) are underfunded. (See Figure 15.)
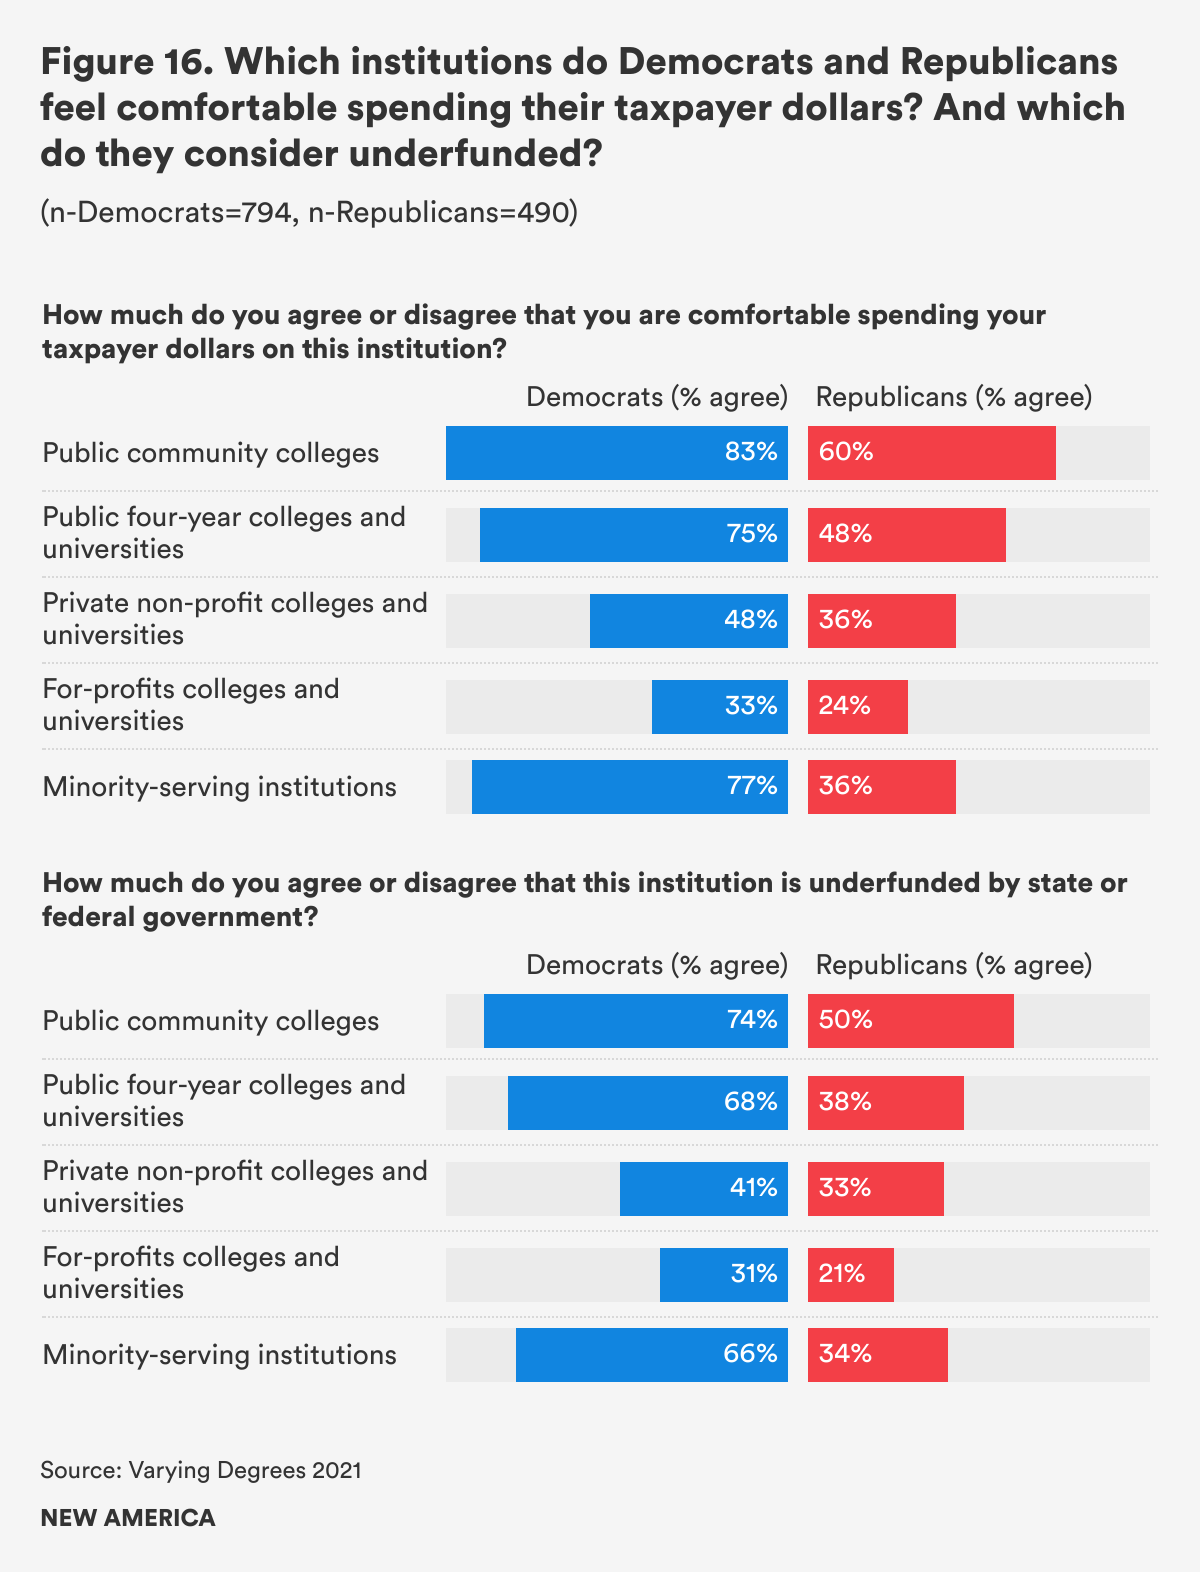
Differences between Democrats and Republicans emerge when it comes to supporting different types of institutions with taxpayer dollars. Democrats and Republicans both agree that they are comfortable supporting public community colleges with their taxpayer dollars (83 and 60 percent, respectively). For public four-year institutions, a majority of Democrats (75 percent) are comfortable spending taxpayer dollars on these institutions, whereas Republicans are split (48 percent). A much broader proportion of Democrats support using taxpayer dollars to fund MSIs (77 percent) compared to Republicans (36 percent). Neither group is comfortable, on the whole, with taxpayer dollars being spent on the private nonprofit sector (48 percent of Democrats agree, compared to 36 percent of Republicans) and the for-profit sector (33 percent of Democrats agree, compared to 24 percent of Republicans).
Democrats and Republicans also have divergent opinions as to whether colleges and universities are currently underfunded by state and federal governments. Nearly three in four Democrats believe the public two-year sector is underfunded, compared with just half of Republicans. Approximately two-thirds of Democrats believe MSIs are underfunded compared with just about a third of Republicans. (See Figure 16.)
Taking Loans for Online Degrees Acceptable
As online education has become the norm over the past year due to the pandemic, we added a new question to gauge how people feel about whether it is acceptable to take out student loans for a program of study taken entirely online. Overall, 63 percent of Americans say that it is acceptable to borrow for an online program, with similar numbers of Democrats (62 percent) and Republicans (68 percent) agreeing. Opinions differed somewhat by race: white (66 percent) respondents agree at higher rates than Black (57 percent) and Latinx (55 percent) respondents.
Accountability
Between the emphasis on rising student loan debt and tuition costs during the 2020 presidential election and COVID-19’s spotlight on inequities in education, holding colleges and universities accountable on accessibility, affordability, and quality will be a pivotal concern in the coming years. This year’s data demonstrate that Americans believe it is important to hold colleges and universities accountable in various ways. These results are good news for the Biden administration as it seeks to prevent fraud and abuse in the for-profit college sector. But they also have implications for the debates the administration and Congress are having about improving college affordability through expanded funding for Pell Grants, promoting free college, and potentially providing student debt relief.
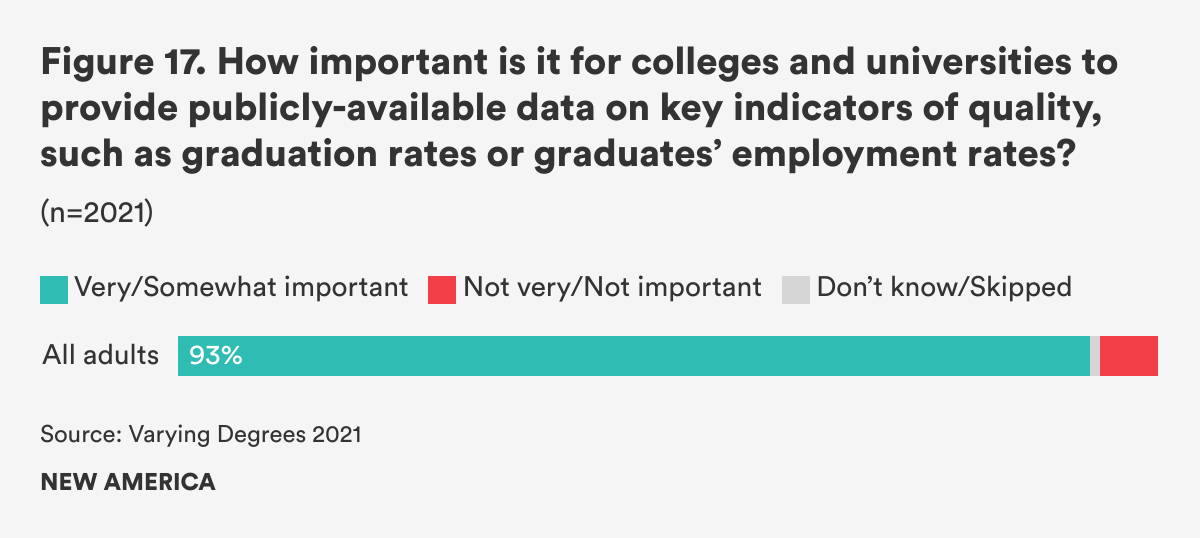
One thing is for certain: Regardless of political party or race, people want colleges and universities to be transparent about key learning and success outcomes. Ninety-three percent of Americans say it is important for institutions to provide publicly available data on graduates’ results and achievements, such as graduation or employment rates of graduates. These results have increased slightly compared to last year. (See Figure 17.)
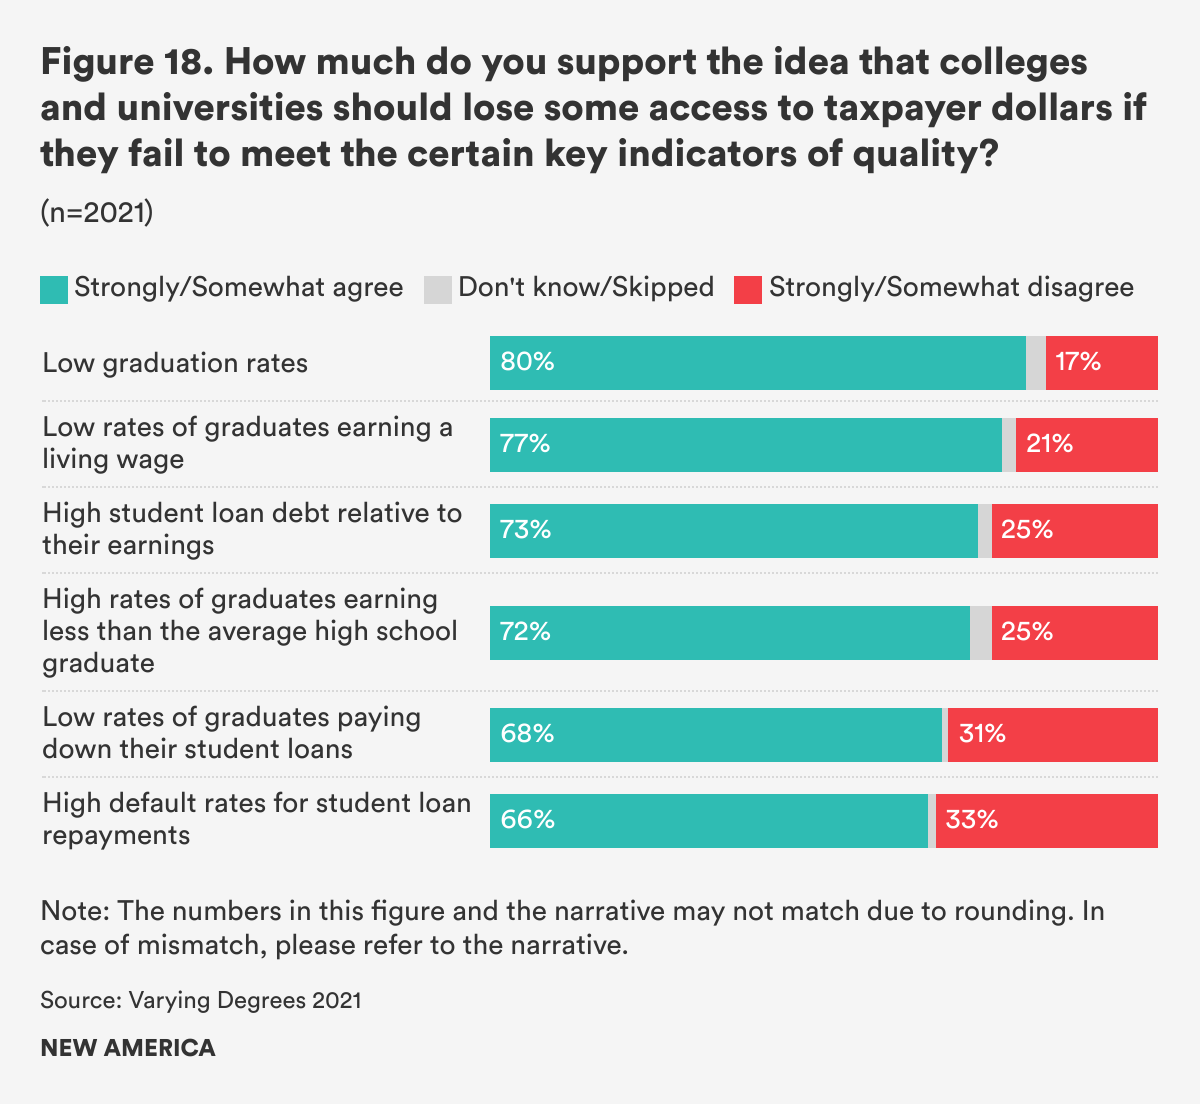
A majority of Americans believe that colleges and universities should lose some of their access to taxpayer money if they have a low rate of students graduating, earning a living wage, paying down student loans, having high rates of graduates earning less than the average high school graduate, and/or having a high rate of former students in default on their student loans. Eighty-one percent of Americans say low graduation rates should result in the loss of some taxpayer dollars (up slightly from 78 percent in 2020); 76 percent say the same of institutions with low rates of graduates earning a living wage; 73 percent for institutions with high student loan debt relative to earnings; 72 percent for institutions with high rates of graduates earning less than the average high school graduate; 67 percent for institutions with low rates of graduates paying down their student loans; and 65 percent for institutions with high default rates for student loan repayments. (See Figure 18.)
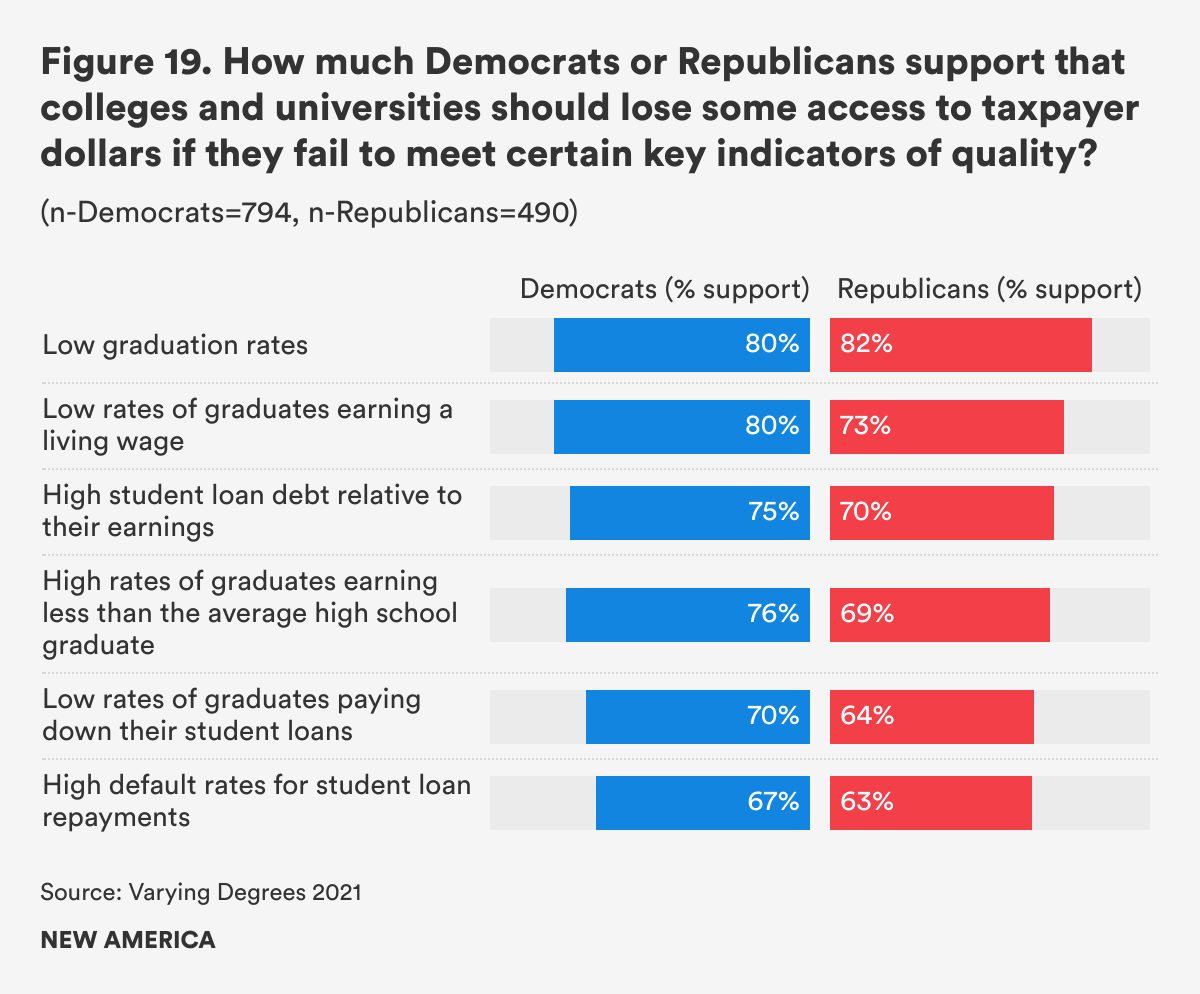
Democrats and Republicans vary in the breadth and support for each accountability indicator, but importantly, the majority of members of both parties believe that institutions should be held accountable for all of the indicators. Democrats and Republicans agree the most on holding institutions accountable for graduation rates (80 and 82 percent, respectively). The parties differ the most, but still not by a large margin, on holding institutions accountable for graduates earning a living wage (80 and 73 percent, respectively). (See Figure 19.)
Opinion on College & University Spending Declines
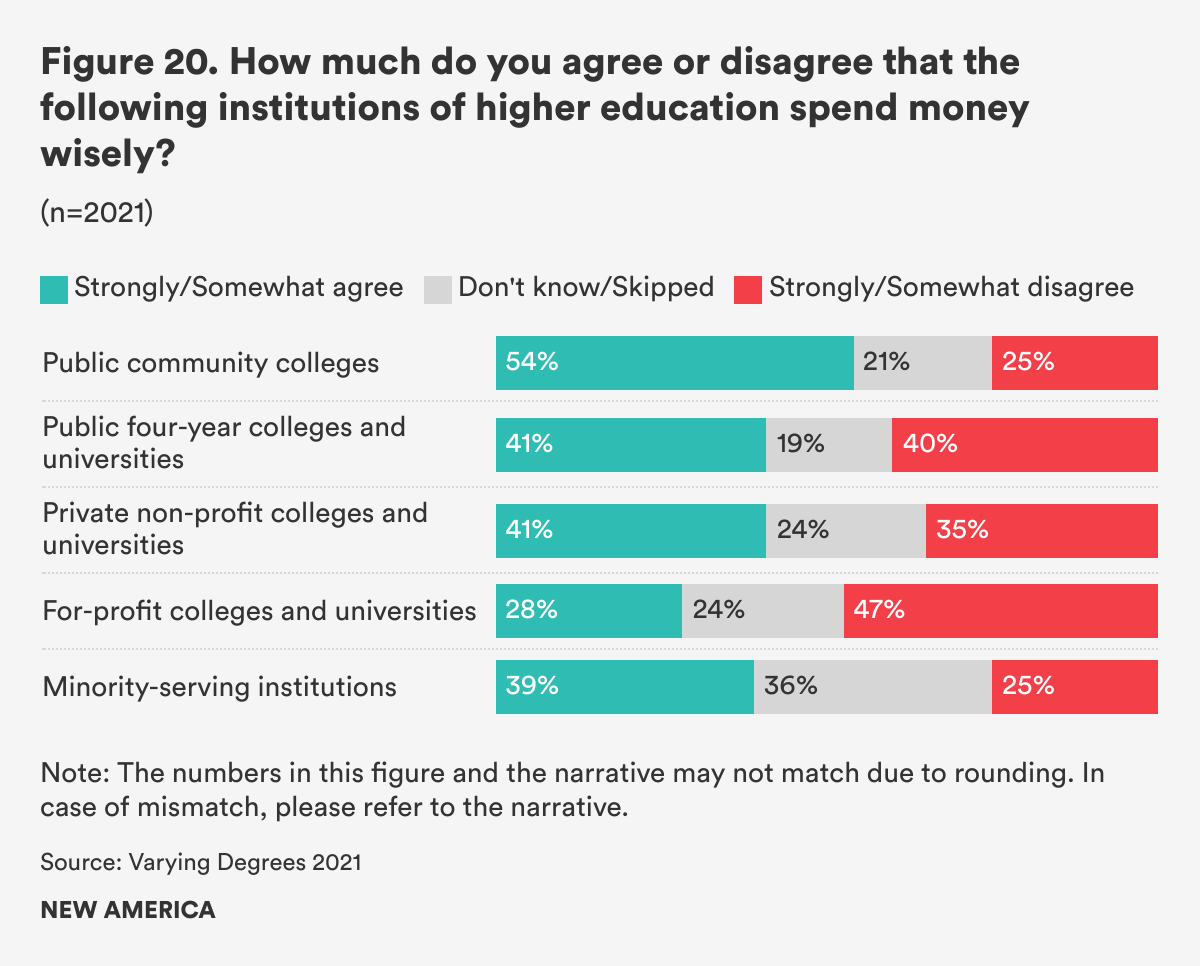
Since the 2019 edition of Varying Degrees, Americans have grown significantly more pessimistic about whether or not colleges spend their money wisely. Just over half (54 percent) say that public community colleges spend their money wisely, a decline of eight percentage points since 2019. About four in 10 Americans say that public four-year colleges (41 percent) spend their money wisely, down from nearly half (47 percent) in 2019. Forty-one percent of Americans also say the same of private nonprofits, a drop of seven percentage points from 2019. For-profits got the worst reviews: only 28 percent said they spend their money wisely, down 11 percentage points since 2019. (See Figure 20.)
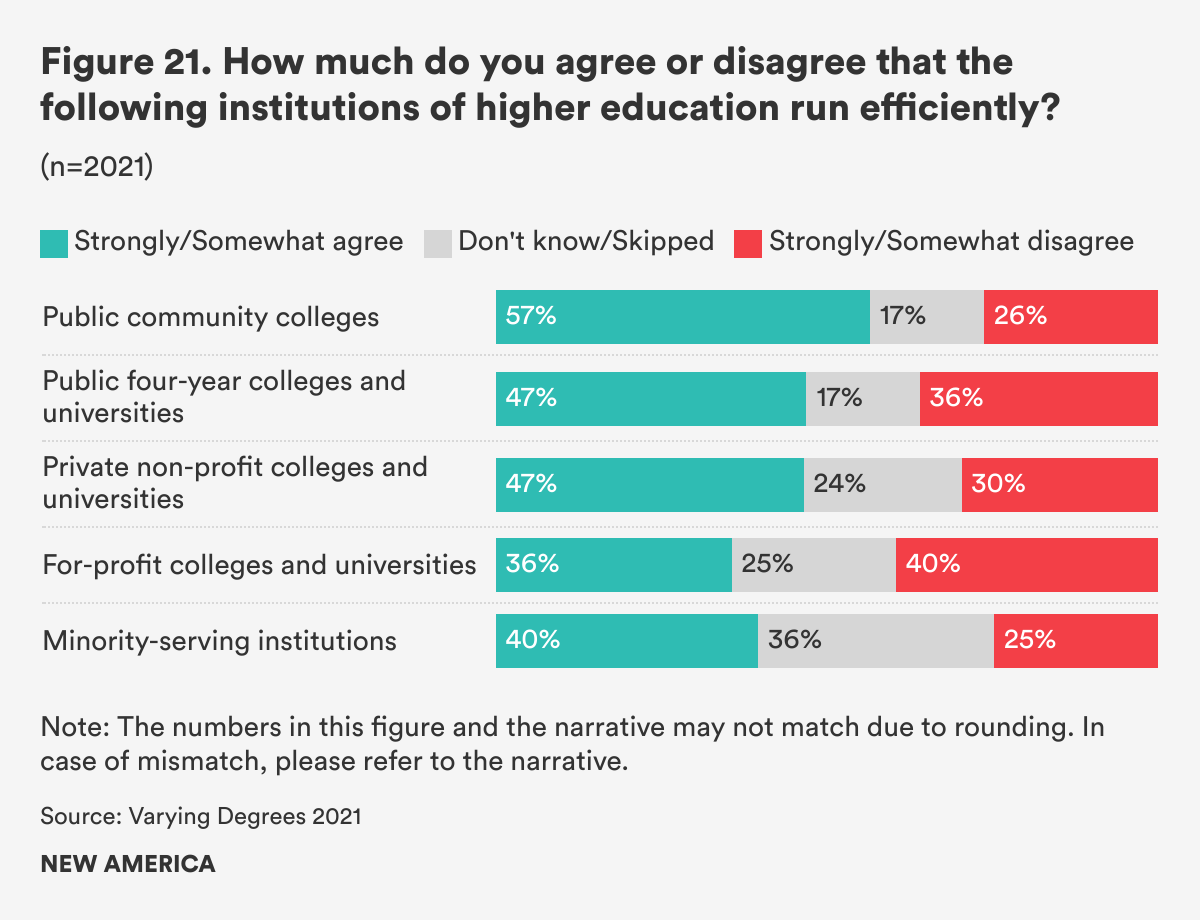
Americans have also become more negative about whether or not institutions are run efficiently. Americans are most positive about how efficiently public community colleges are run, but numbers have still declined. Over half (56 percent) say they are run efficiently, down from 62 percent in 2019. Forty-seven percent of Americans say public four-years are run efficiently, which is a decline of eight percentage points since 2019. Private nonprofits also suffered an eight-percentage point decline since 2019 (47 percent in 2021 said they run efficiently, compared to 55 percent in 2019). For-profits once again did the worst: just 36 percent of Americans affirmed their belief that they are run efficiently, down from 47 percent in 2019. (See Figure 21.)
Democrats and Republicans diverge in their views of whether public institutions spend their money wisely and are run efficiently. Democrats believe public two-year, public four-year, and MSIs spend money wisely and run efficiently at higher rates than Republicans. Both parties agree at similarly low levels that private nonprofit and for-profit institutions spend money wisely and run efficiently. (See Figure 22.)
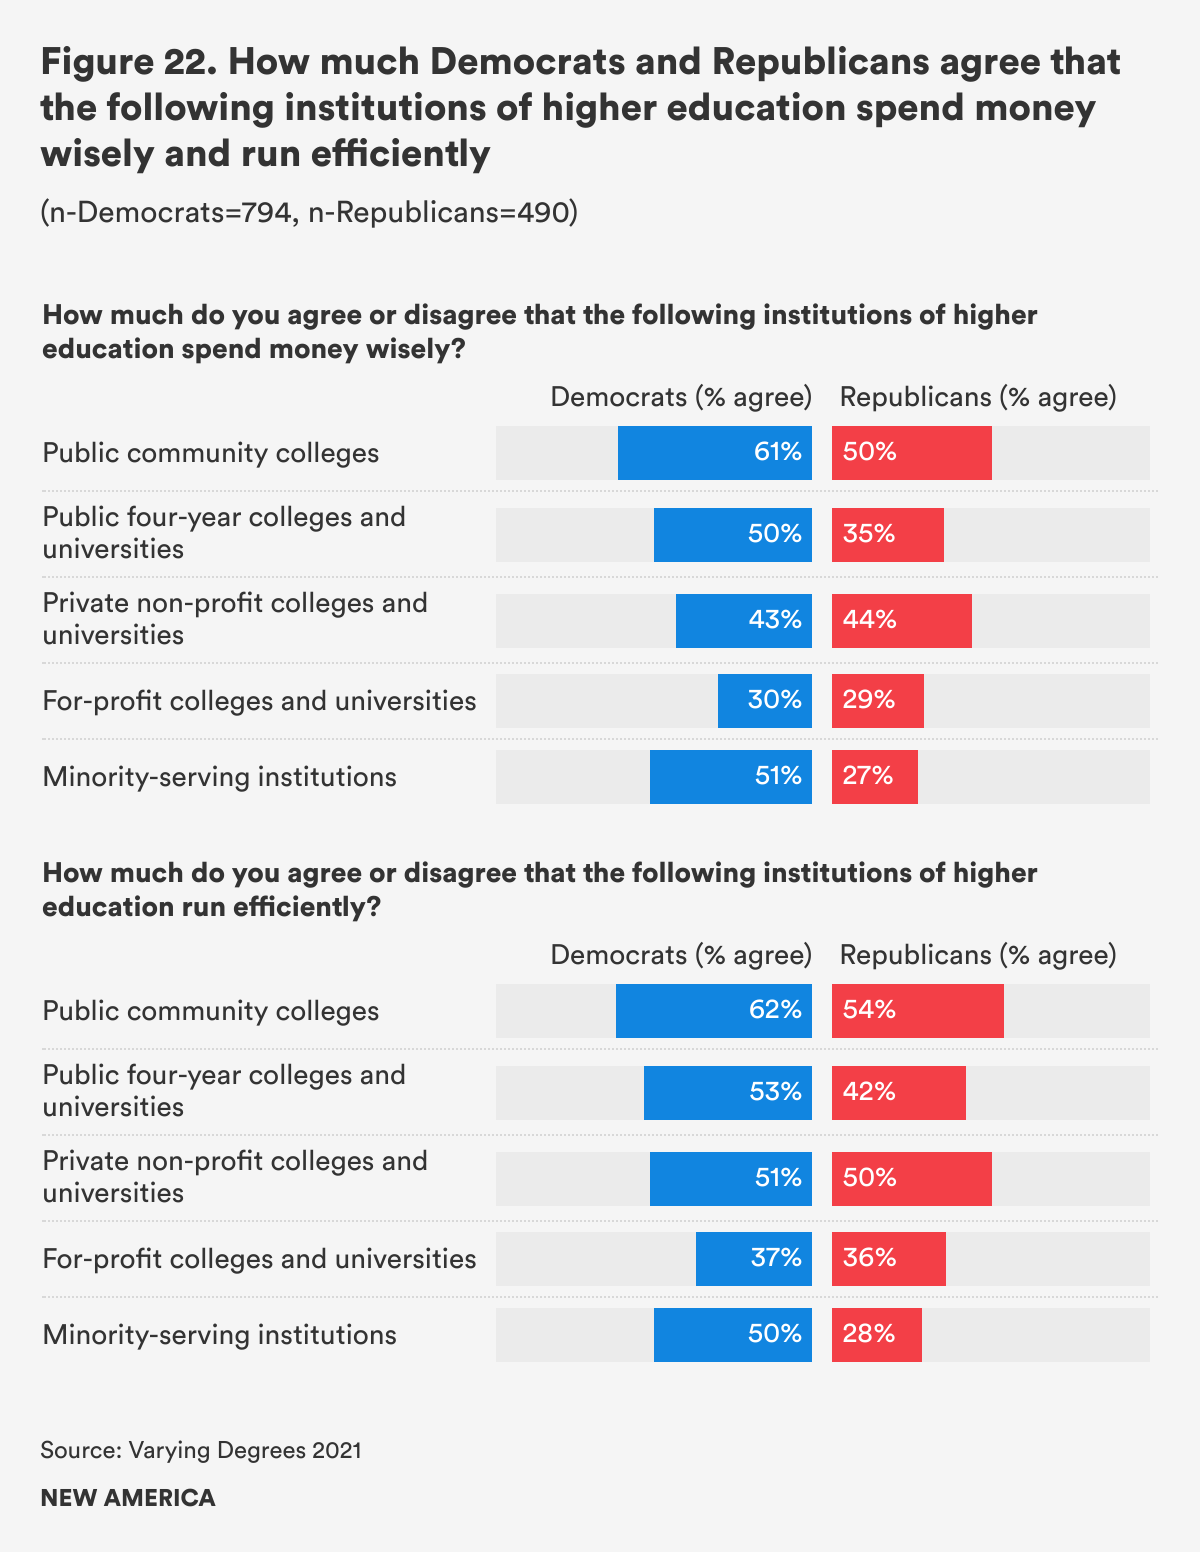
Approximately 39 percent of Americans believe MSIs spend money wisely, and 40 percent say they run efficiently. On both accounts, Democrats are more positive than Republicans about MSIs. Approximately half (51 percent) of Democrats say they spend money wisely, compared to 27 percent of Republicans, and 50 percent of Democrats say they run efficiently as opposed to 28 percent of Republicans. Since questions about MSIs were new this year, we have no comparison data. There are also large racial differences in terms of how Americans view MSIs. Almost two-thirds of Black respondents (63 percent) say MSIs spend wisely, compared to one-third of white respondents. A similar divide is evident in respondents who think MSIs run efficiently: 58 percent of Black and 44 percent of Latinx respondents believe MSIs are run efficiently, compared to 34 percent of whites.
Policy
Biden’s Higher Education Policy Priorities
The Biden administration has made extensive legislative and budget proposals for education after high school—from free community college to improving the student loan repayment system—that aim to ensure access to high-quality education beyond high school for all Americans.5 In our Varying Degrees survey this year, we asked Americans a month after President Biden took office what they think the most important higher education priorities should be for the President and Congress.
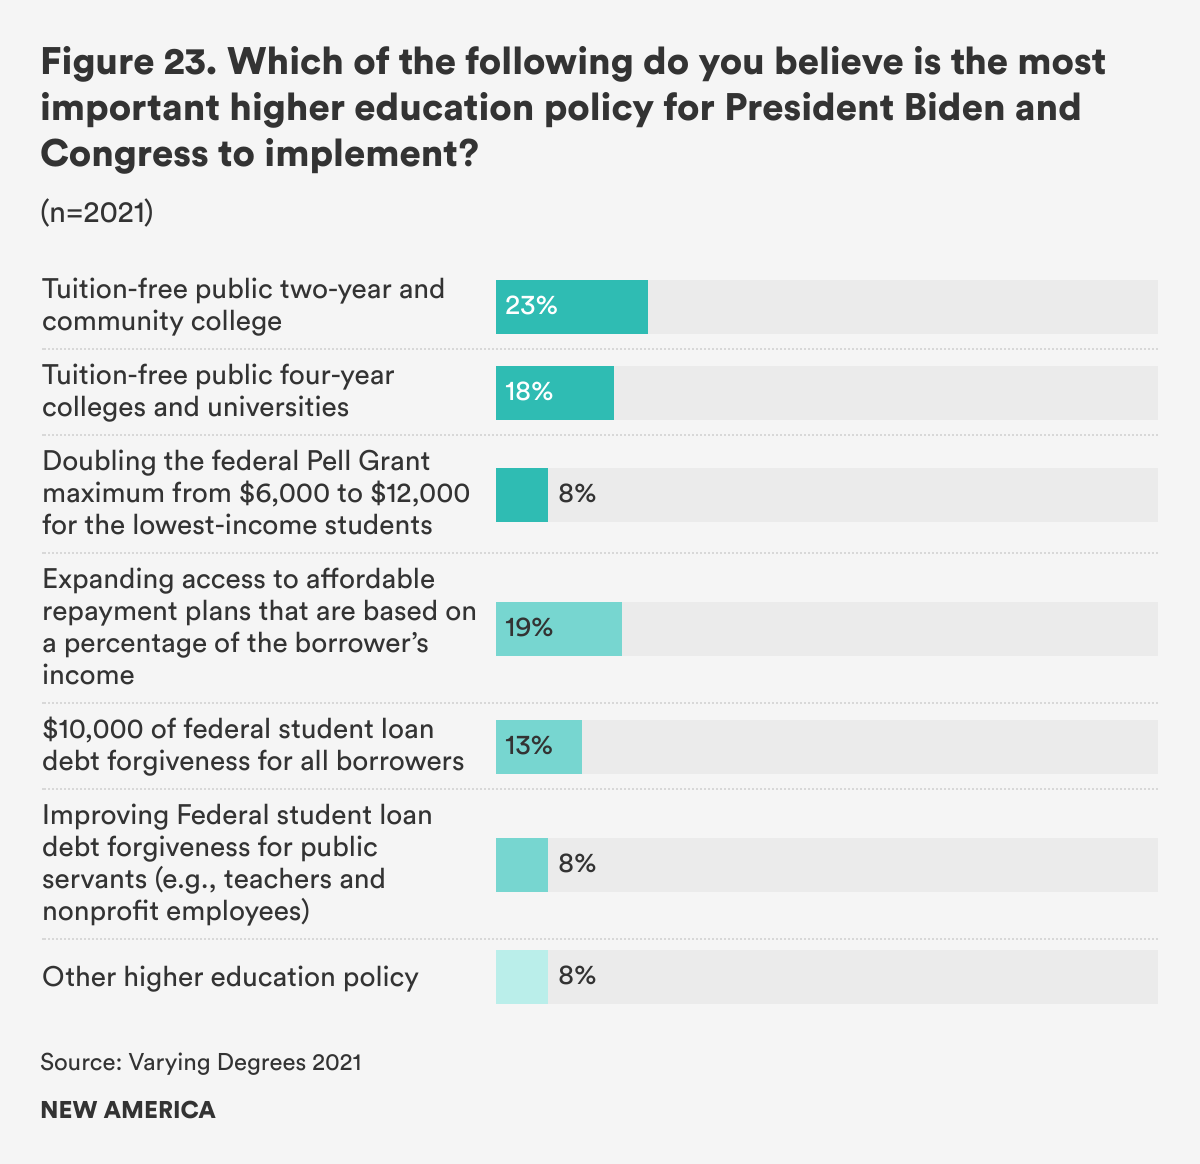
Approximately half of Americans believe the Biden Administration and Congress should prioritize higher education affordability with the breakdown as follows: 23 percent believe tuition-free public two-year and community college as the most important policy, followed by 18 percent who say tuition-free public four-year colleges and universities, and 8 percent who say doubling the Pell Grant maximum. Another 40 percent want President Biden and Congress to help student loan borrowers with the breakdown as follows: 19 percent want access to income-driven repayment expanded, another 13 percent want the government to provide $10,000 in federal student loan forgiveness, and 8 percent want to prioritize improving a loan forgiveness program for public workers known as Public Service Loan Forgiveness (PSLF).6 (See Figure 23.)
As with many other policy issues, Democrats and Republicans do not see eye to eye on which higher education policy should be the top priority. For Democrats, tuition-free public four-year colleges and universities should come first (28 percent, versus only 7 percent of Republicans). For Republicans, 34 percent want to make expanding access to income-driven repayment the top priority, compared to only 11 percent of Democrats. Having said that, Democrats and Republicans place nearly equal priority on doubling Pell Grant (8 and 10 percent, respectively) and improving PSLF (6 percent for both).
Student loan cancellation is a hot policy topic right now and the Biden administration is reviewing whether it has the authority to forgive $10,000 of student debt through executive action.7 A majority of Americans do not consider this the topmost priority, though there are interesting demographic differences. While just 13 percent of Americans prioritize forgiving debt, there is a political divide: it is the priority of 18 percent of Democrats and only 9 percent of Republicans. Among different racial groups, more Black (23 percent) Americans prioritize debt forgiveness than white (12 percent), Latinx Americans (11 percent) and Asian Americans (15 percent). Unsurprisingly, debt forgiveness is a top priority for current student loan borrowers: a plurality agreed this is the top priority (27 percent) compared to non-borrowers (9 percent).
Borrowers’ Thoughts on Income-driven Repayment Plans
Student debt creates substantial financial burdens for many Americans. Prior to the COVID-19 pandemic, nearly 11 percent8 of aggregate student debt was in delinquency9 (i.e., borrowers have not made any payments for 90 consecutive days or more) or in default10 (i.e., borrowers have not made payments for at least 270 days). To alleviate the burden of repaying student loan debts and prevent borrowers from slipping into delinquency or default, Congress provides them with income-driven repayment (IDR) plans,11 which let borrowers pay a certain percentage of their discretionary income instead of making a fixed payment. Borrowers who have been making IDR payments for 20 or 25 years may have their remaining amount of debt forgiven.
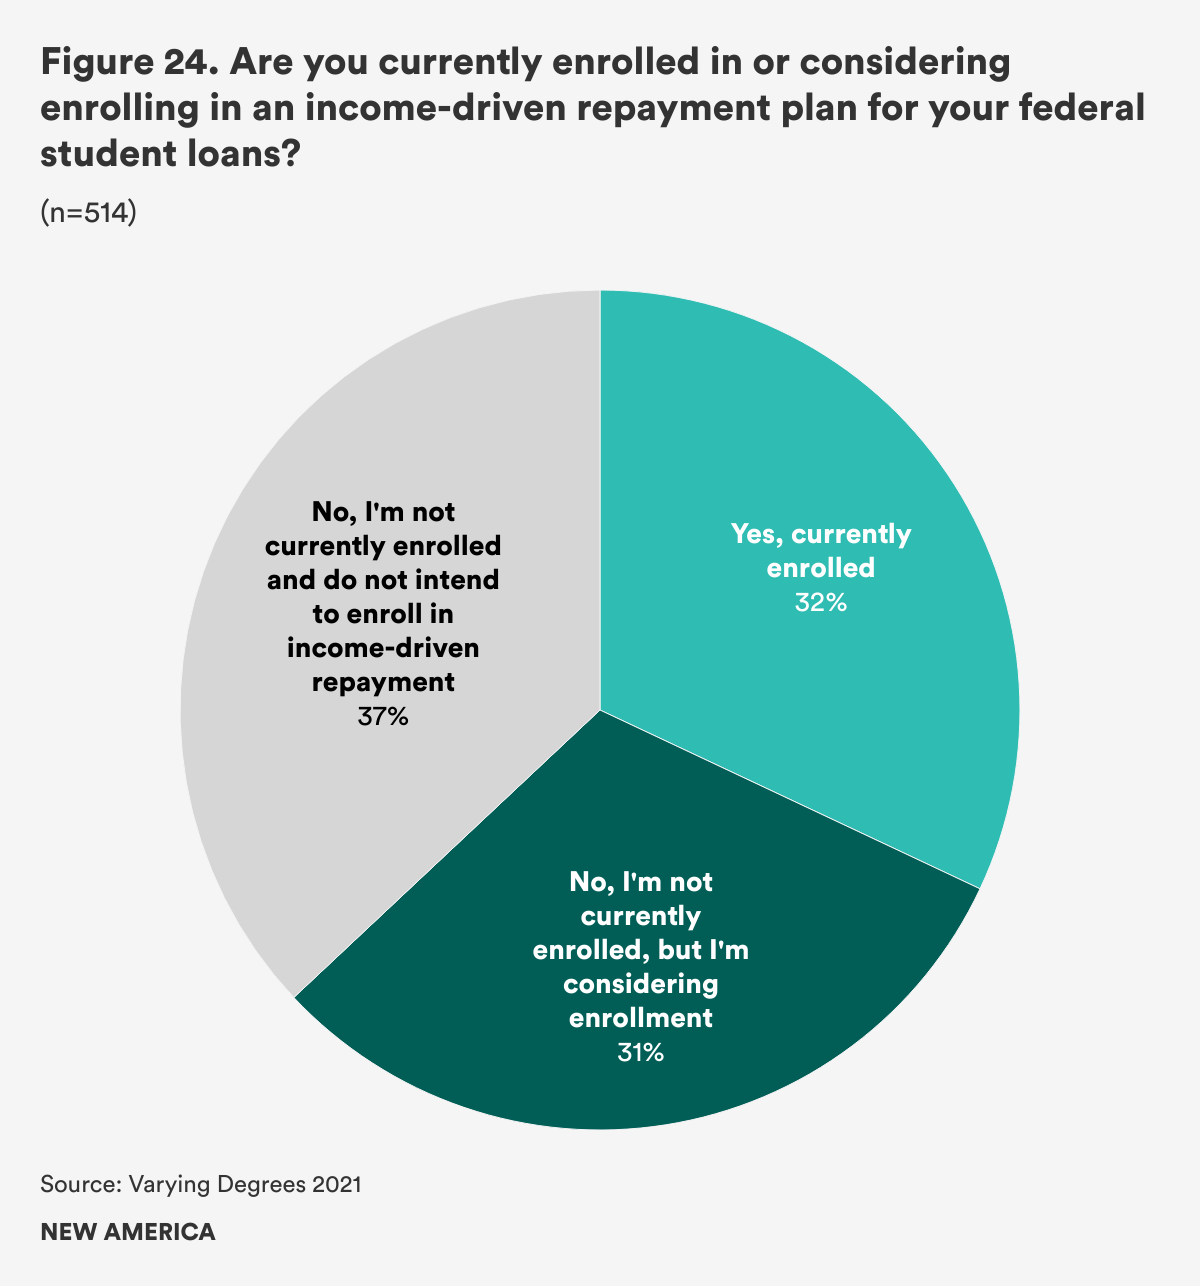
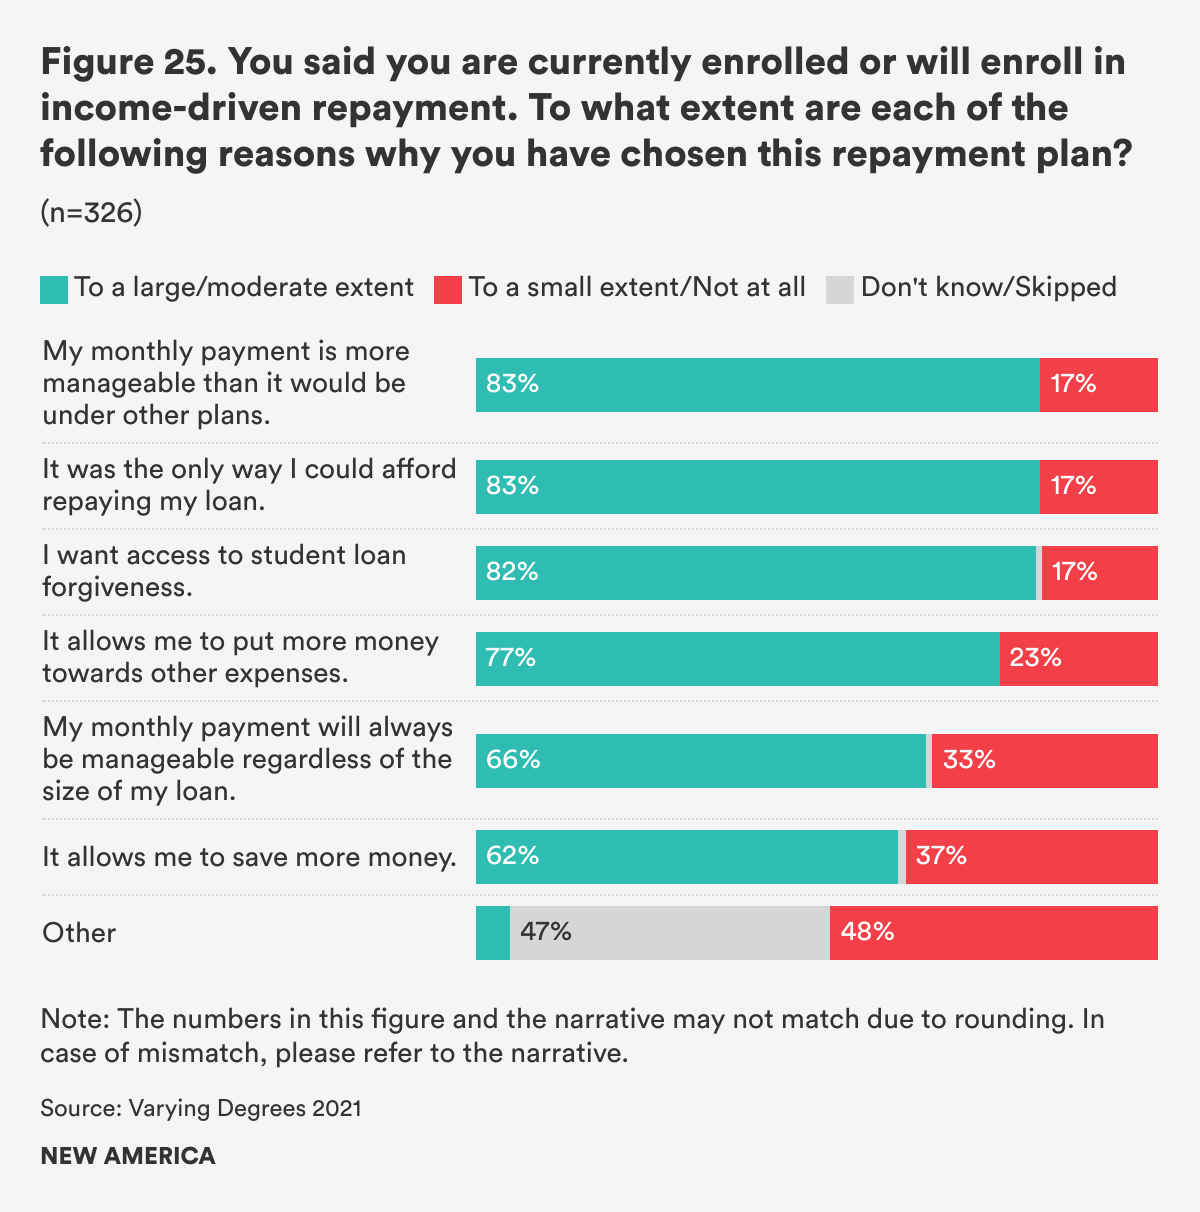
This year’s survey was particularly interested in the experiences and perspectives of student loan borrowers. We found that 32 percent of borrowers are currently enrolled in an IDR plan and 31 percent are currently not enrolled but considering it. (See Figure 24). Among the borrowers who say they are currently enrolled or considering enrolling in IDR, most chose or are considering the repayment plan because it makes their monthly payment more manageable (82 percent), because the repayment plan is the only way they could afford their payment (82 percent), and because they will have access to student loan forgiveness (82 percent). Three in four of borrowers choosing or considering an IDR plan (76 percent) say that the plan allows them to put more money towards other expenses, and 62 percent said that the plan allows them to save more money. Two-thirds (66 percent) say that the plan gives them the security of knowing that their monthly payment will always be manageable, regardless of the size of the loan. (See Figure 25.)
At the same time, 37 percent of current borrowers, are not enrolled and say they will not choose to enroll in IDR. The top three reasons they give for this decision include wanting to pay down their debt quickly (62 percent), worrying about interest accruing (58 percent), and paying much more in the end than what they borrowed (57 percent). More than half of these borrowers (51 percent) said they did not think they were qualified for an IDR plan, and a third (33 percent) worried about the amount of annual paperwork and keeping up with the program requirements. (See Figure 26.)

Americans’ Support Borrower Defense Rule
Borrower defense is a long-existing provision of the Higher Education Act that allows students whose institutions engage in fraud and certain other types of misconduct to have their federal student loans forgiven. The Department of Education developed final rules in 2019 to implement borrower defense and streamline the loan discharge process.12 A majority of Americans (79 percent) agree that borrowers should have their student debt cancelled if their college or university misrepresented information about their programs of study or student outcomes. Democrats and Republicans both agree on this, though at different rates (88 and 64 percent, respectively). Americans of all racial groups also agree that debt should be cancelled for those students whose institutions misrepresented educational outcomes, including 78 percent of white, 85 percent of Black, and 78 percent of Latinx respondents.
Higher Education’s COVID-19 Response
When the pandemic broke out nationwide in March 2020, most colleges had to close their campuses, transfer learning online, and provide extra support to students. New America, in partnership with the State Higher Education Executive Officers Association, has been tracking how colleges and universities are responding to the pandemic.13 This year, we asked several questions relating to how colleges have responded to the pandemic.
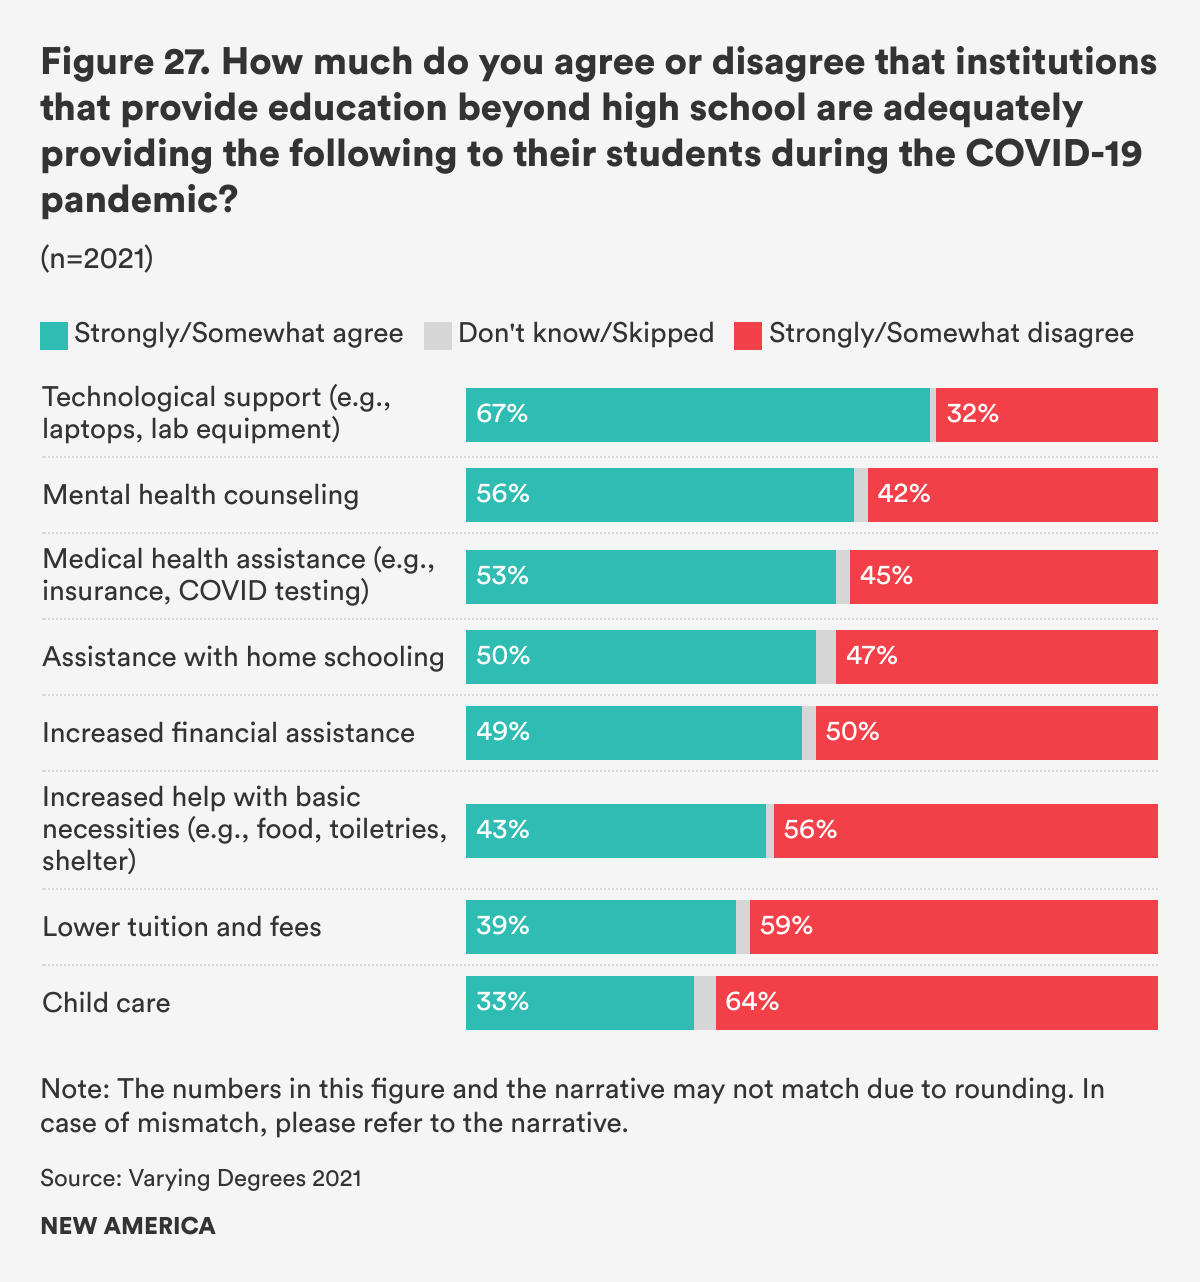
A majority of Americans agree that colleges adequately provided the following to students: technological support (67 percent), mental health counseling (56 percent), and medical health assistance (54 percent). On the other hand, there is less agreement over whether higher education institutions did enough to provide for basic necessities (43 percent), lower tuition and fees (39 percent), and child care (33 percent). Americans are split about whether colleges and universities provided enough assistance with remote schooling for students’ children (51 percent) and financial assistance for students during the pandemic (49 percent). (See Figure 27.)
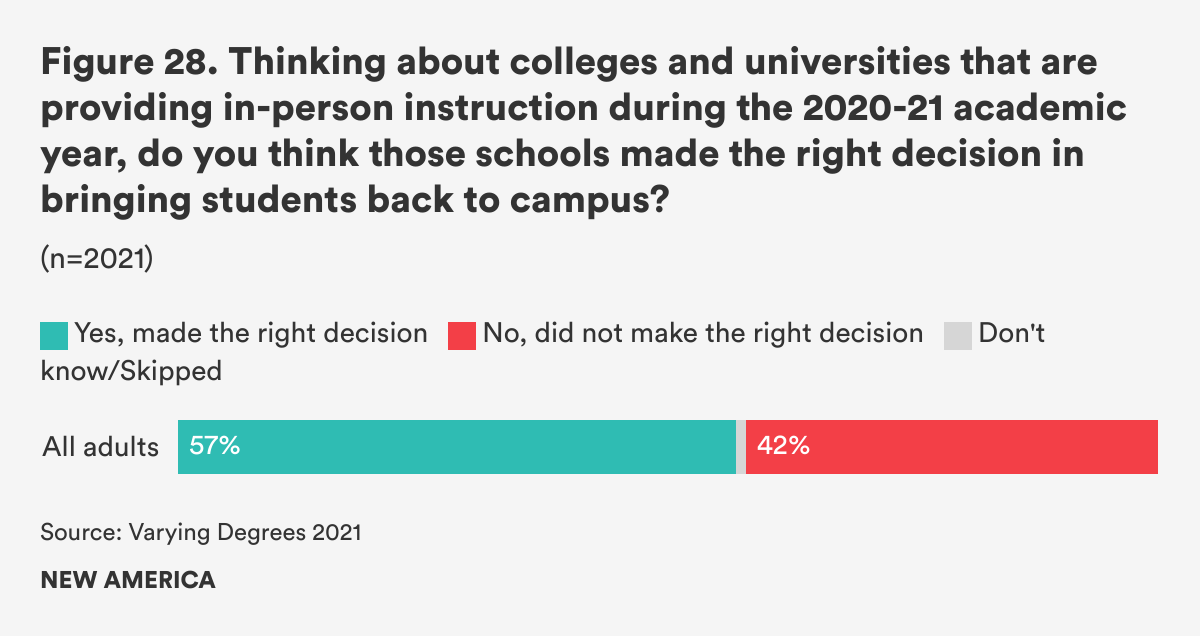
When asked what they think about some colleges’ decisions to bring students back to campus during the 2020–2021 academic year, 57 percent of Americans think it was the right decision, with 42 percent disagreeing. (See Figure 28.) There is a huge partisan gap in the response: only 39 percent of Democrats think the decision was right compared to 84 percent of Republicans. Americans of different racial groups also think differently about this question: 63 percent of white respondents agree with the decision to reopen campus, compared to 52 percent of Latinx, 44 percent of Black, and 41 percent of Asian Americans.
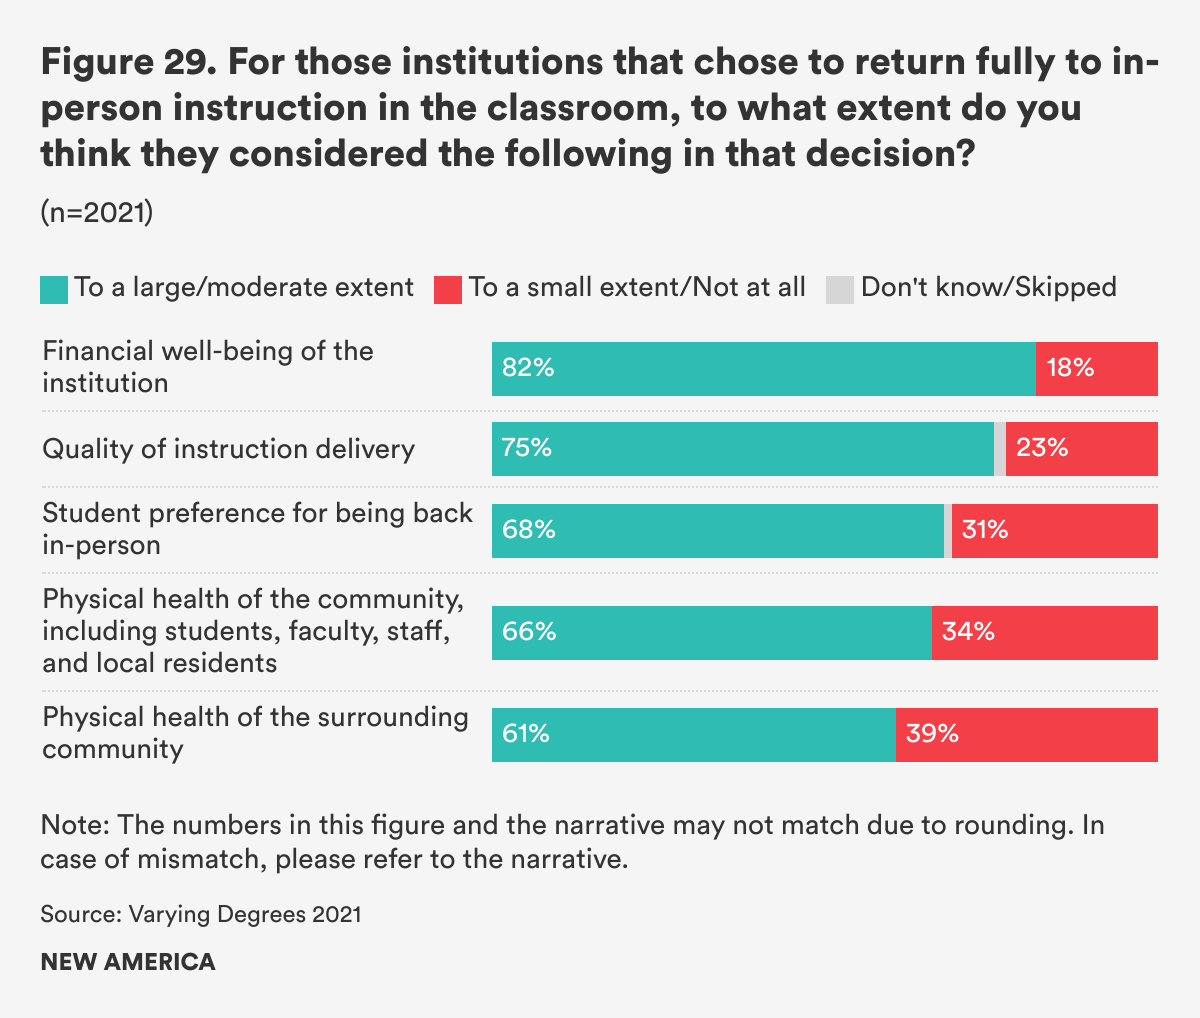
For those institutions that decided to be in-person for fall 2020, four in five Americans think that to a large or moderate extent, the financial well-being of the institution influenced the decision to reopen. Americans also believe that institutions considered other factors when deciding to reopen such as the quality of instructional delivery (76 percent said to a large/moderate extent), student preference for being back in-person (68 percent said large/moderate extent), the physical health of the campus community (66 percent said large/moderate extent), and the physical health of the surrounding local community (60 percent said large/moderate extent). (See Figure 29.) There was a partisan difference, with a higher percentage of Republicans saying to a large or moderate extent that institutions considered student preference for being back in-person (74 percent vs. 66 percent Democrat), the physical health of the campus community (75 percent vs. 61 percent), and the physical health of the local community (70 percent vs. 55 percent).
Use of Standardized Tests in Admissions
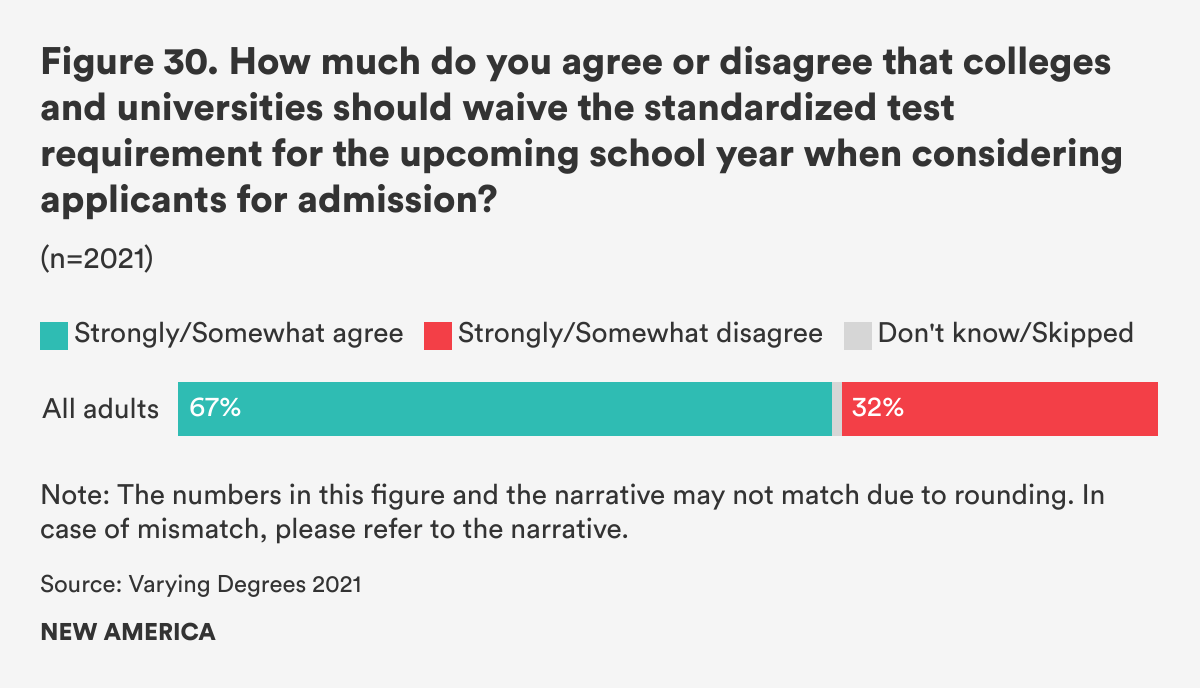
With a number of SAT and ACT test dates and locations cancelled due to the pandemic, many colleges and universities have waived the requirements for standardized tests in their applications for fall 2021 and some have gone test-free (i.e., not taking test scores into consideration at all in admissions decisions).14 A majority of Americans agree with these decisions (66 percent). (See Figure 30.) There is, however, a stark partisan divide on this question: A majority of Democrats (78 percent) agree with colleges’ decision to deemphasize test scores, while Republicans (50 percent) remain mixed. There are also differences in the breadth of agreement along racial lines: 63 percent of white respondents agree with the decision, compared with 80 percent of Black, 70 percent of Latinx, and 68 percent of Asian Americans.
Standardized tests such as the SAT or ACT have long been considered a staple in competitive college admissions, especially for high-achieving (and often high-income) students aiming for selective colleges and universities. However, critics of standardized tests have pointed out that the tests themselves disadvantage low-income and minority students and further the equity gap.15 Research also shows that SAT and ACT scores are much poorer indicators of students’ college outcomes than high school GPAs are.16 The movement for going test-optional has, in fact, been going on since before the pandemic.
Among colleges that waived standardized tests for this and upcoming academic years, the University of California system went beyond making the waiver temporary. In May 2020, the system decided to phase out the SAT and ACT scores as admissions requirements over the next four years. A California court later barred the UC system from considering SAT or ACT scores in its admissions decision, making the system effectively test-free starting this year (this decision was later upheld by the appeals court).17 According to our survey this year, Americans have mixed feelings about a permanent test waiver even though it would promote equity.
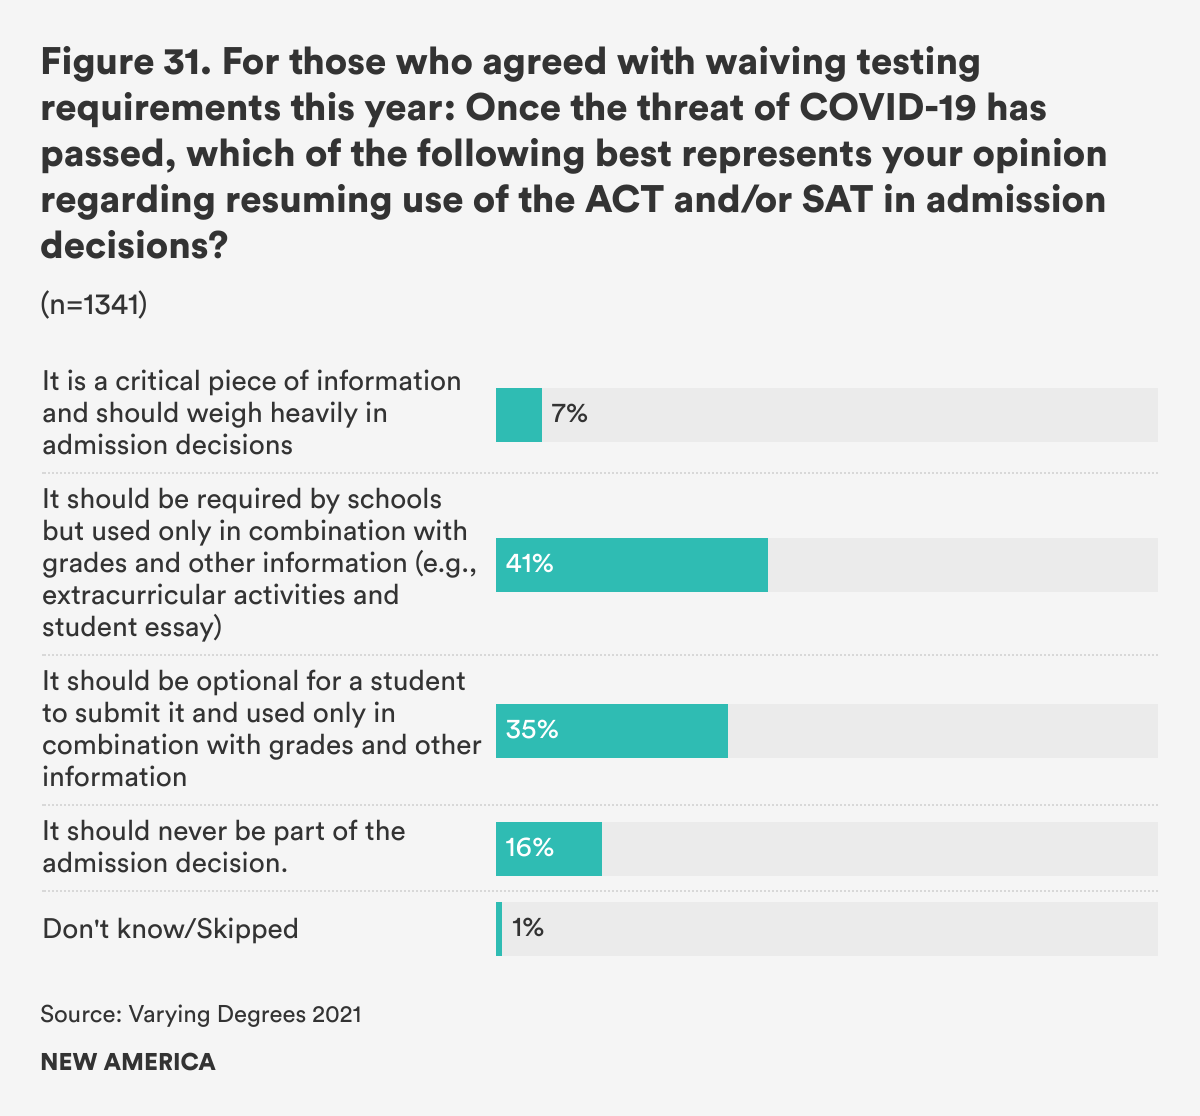
Of those who agreed with waiving testing requirements this year, about one-half believe that schools should either be test-optional or should never use standardized test scores in the future (35 percent say test-optional, 16 percent say test scores should never factor in). Only 7 percent want standardized test scores to be a critical piece of information and factor heavily in admissions decisions in the future. Another 41 percent want colleges and universities to require standardized test scores in the future, but only in combination with grades and other information. (See Figure 31.)
Republicans and Democrats differed on issues related to standardized testing: 65 percent of Republicans who agreed with the decision that schools waive testing requirements this year believe that colleges and universities should rely on test scores in the future, whereas 55 percent of Democrats believe colleges and universities should be either test-optional or never use scores as part of the admissions process.
Citations
- See appendix for methodology.
- In our survey for the Varying Degrees project, Generation Z includes people who were born in and before 1995, Millennials include those born between 1980 and 1994, Generation X includes those born between 1965 and 1979, Baby Boomers include those born between 1946 and 1964, and the Silent Generation includes those born in and before 1945.
- Rachel Fishman, Sophie Nguyen, and Myra Francisco, Varying Degrees 2020: New America’s Fourth Annual Survey on Higher Education (Washington, DC: New America, June 2020), source
- Fishman, Nguyen, and Francisco, Varying Degrees 2020.
- Biden Harris Democrats (website), “The Biden Plan for Education Beyond High School,” accessed April 22, 2021, source
- Federal Student Aid (website), “Public Service Loan Forgiveness (PSLF),” accessed May 6, 2021, source
- Elissa Nadworny, “Debate Over Student Loan Forgiveness Hinges On 2 Numbers: $10,000 Vs. $50,000,” last modified February 18, 2021, source; Ryan Lane, Anna Helhoski, & Cecilia Clark, “Joe Biden’s Student Loan Plan: What’s Happening Now,” last modified May 5, 2021, source
- Center for Microeconomic Data, Quarterly Report on Household Debt and Credit (New York: Federal Reserve Bank of New York, November 2019), source
- Federal Student Aid (website), “Student Loan Delinquency and Default,” accessed April 22, 2021, source
- Federal Student Aid, “Student Loan Delinquency.”
- Federal Student Aid (website), “If Your Federal Student Loan Payments Are High Compared to Your Income, You May Want to Repay Your Loans Under an Income-Driven Repayment Plan,” accessed April 22, 2021, source
- Clare McCann, “The Ins and Outs of the Borrower Defense Rule,” EdCentral (blog), New America, July 10, 2017, source; and Karen McCarthy, “Breaking Down Borrower Defense Regs: ED Introduces Another Borrower Defense Framework,” National Association of Student Financial Aid Administrators, September 10, 2019, source
- New America, “Higher Education's Shift Online During the Pandemic,” collection of articles with SHEEO, last modified March 22, 2021, source
- The College Board (website), “PSAT-related Assessment and SAT Coronavirus Updates,” accessed May 6, 2021, source; ACT, “ACT Testing Amid COVID-19,” accessed May 6, 2021, source; and Neil Vigdor and Johnny Diaz, “More Colleges are Waiving SAT and ACT Requirements,” New York Times, May 21, 2020, source
- Ezekiel J. Dixon-Roman, Howard Everson, and John J Mcardle, “Race, Poverty and SAT Scores: Modeling the Influences of Family Income on Black and White High School Students’ SAT Performance,” Teachers College Record 115, no. 4 (May 2013).
- Elaine M. Allensworth and Kallie Clark, “High School GPAs and ACT Scores as Predictors of College Completion: Examining Assumptions about Consistency across High Schools,” Education Researcher 48, no. 3 (April 2020): 198–211, source
- Shawn Hubler, “University of California Will End Use of SAT and ACT in Admissions,” New York Times, last modified May 24, 2020, source; Scott Jaschick, “U of California Barred From Considering SAT/ACT Scores,” Inside Higher Ed, last modified September 8, 2020, source; and Scott Jaschick, “Appeals Court Upholds Ruling Against Tests for Admissions,” Inside Higher Ed, last modified November 2, 2020, source
Explore the Data
Error: Data visualization bundle URL missing.
Disclaimer about the Data Tool
- The Varying Degrees survey is conducted with the hope to build a trend data set of public opinion data about education after high school. However, we have made some changes throughout the last five years to improve the survey instrument and modality of data collection, which may affect the ability to analyze the data longterm. One of the major changes was the change in the survey mode from mostly phone to mostly online in 2019. Following the transition to mostly online, we decided to drop the neutral response options (for example: neither agree nor disagree) to improve response quality. Therefore, these changes may explain some of the data shifts from 2017 and 2018 collection years compared to 2019, 2020, and 2021 collection years.
- The data tool reflects responses from the general population and the race oversamples only. To explore the oversamples of current undergraduates and student loan borrowers, please download the data file in the downloads section of this report.
Appendix: Methodology
Survey Population and Response Rate
The Varying Degrees survey was administered using NORC’s AmeriSpeak Panel for the sample source. Funded and operated by NORC, AmeriSpeak is a probability-based panel designed to be representative of the U.S. household population. A general population sample of U.S. adults aged 18 and older was selected for this study.
The sample for a specific study is selected from the AmeriSpeak Panel using sampling strata based on age, race/Latinx ethnicity, education, and gender (48 sampling strata in total). The size of the selected sample per sampling stratum is determined by the population distribution for each stratum. In addition, sample selection takes into account expected differential survey completion rates by demographic groups so that the set of panel members with a completed interview for a study is a representative sample of the target population. If a panel household has one more than one active adult panel member, only one adult in the household is eligible for selection (random within-household sampling). Panelists selected for an AmeriSpeak study earlier in the business week are not eligible for sample selection until the following business week.
For this study, in addition to the general population sample, an extra sample from the AmeriSpeak Panel was pulled to hit specific targets for current college student and student loan holder oversamples. College student status was confirmed at questions D4 and D5, and student loan status was confirmed at question D3 (questionnaire available in data download section of this report and the data file contains the oversample data).
A sub-sample AmeriSpeak web-mode panelists were invited to the survey on February 26, 2021 in a soft launch. The initial data from the soft launch was reviewed and the remainder of sampled AmeriSpeak panelists were invited to the survey on Monday, March 1. Data collection took place between February 26 and March 17, 2021.
NORC collected 2,620 total interviews: 2,491 by web mode and 129 by phone mode. More information about response rate, breakdown of participants, and margin of error can be viewed with the NORC Card in the data download section of this report.
Data Collection Procedures
To administer the phone survey, NORC dialed the sampled phone-mode panelists throughout the collection period. To encourage study cooperation among web-mode panelists, NORC sent email and SMS text message reminders after the initial contact between Friday, February 26 and Monday, March 15. These web panelists were allowed to complete the survey via phone if convenient. Panelists were offered the cash equivalent of $3.
Design Effect and Sampling Margin of Error Calculations
| Samples | Sample Size | Margin of Error | Design Effect |
|---|---|---|---|
| General population | 2,021 | +/- 2.98% | 1.86 |
| Student loan borrowers | 1,108 | +/- 3.77% | 1.64 |
| Current college students | 347 | +/- 8.46% | 2.58 |
More About the Authors
Rachel Fishman
Director, Higher Education
Elin Johnson
Intern, Higher Education

Sophie Nguyen
Senior Policy Manager, Higher Education
Lupita Romo-González
Intern, Higher Education