This brief describes the different phases of research to prepare for planning and managing broadband interventions at various scales. Using this guide, researchers can compile geospatial broadband profiles including environmental and demographic data, local community assets, and available technical infrastructure.
This methodology grew out of the Open Technology Institute’s experience evaluating Broadband Opportunity Technology Program (BTOP)[1] projects in Detroit and Philadelphia, and also from our mesh networking training programs in Detroit and Brooklyn. In all of these cases, we saw that broadband infrastructure and training programs were part of digital ecosystems with both physical and social components. While a thorough collaboration with residents is the only way to understand multifaceted local digital ecosystems, incorporating standard indicators can inform local decision-making, facilitate analysis across communities, and guide planning on a city-wide or regional scale.
Broadband needs and assets vary across neighborhoods in a city. Successful projects account for those variations in their planning, either tailoring a solution to a specific community or considering the placement of resources as part of a larger region or set of projects. The following methodology can help guide that process, in most cases using datasets that are publicly available.
Community-based organizations working to create local community networks or training programs can use this methodology for broadband planning and advocacy. Municipal agencies with limited resources to promote broadband access across a city can use it to identify areas of acute need and the assets to leverage for innovative solutions. Community leaders who want to address a digital divide can use this approach to highlight inequity across neighborhoods, towns, or regions.
OTI first developed this means of identifying areas of low broadband adoption in cities in 2011-2012 to evaluate the placement of BTOP-funded public computer centers in Philadelphia. OTI collaborated with Philadelphia-based geospatial analysis firm Azavea using a version of this methodology to prepare a report on that project, and has continued to refine it over time.
This guide is only intended to provide a framework for urban broadband planning; as with any community organizing or urban planning project, it is important to tailor the research for each area’s specific resources and needs.
Phase 1: Identify and locate populations with broadband access challenges
This phase of research identifies areas with low broadband adoption rates by examining census tract level broadband subscription data and as well as locating environmental and demographic characteristics that are associated with lower rates of broadband adoption. This process helps determine priority locations as a city or group moves forward with broadband access planning. The indicators below were drawn from academic and practitioner literature on the digital divide [2].
Broadband adoption data
- Federal Communications Commission (FCC) Internet Access by Census tract [3]
- Percentage of households adopting broadband services
Source: Aggregated data in tables and maps are available every six months here: http://transition.fcc.gov/wcb/iatd/comp.html
Environmental factors correlated with low rates of broadband adoption
- Public housing
- Vacant land, abandoned/condemned buildings
- Low number of commercial corridors, business improvement districts
- Low rates of owner-occupied housing
Sources: These data are generally available from local planning entities or open data websites.
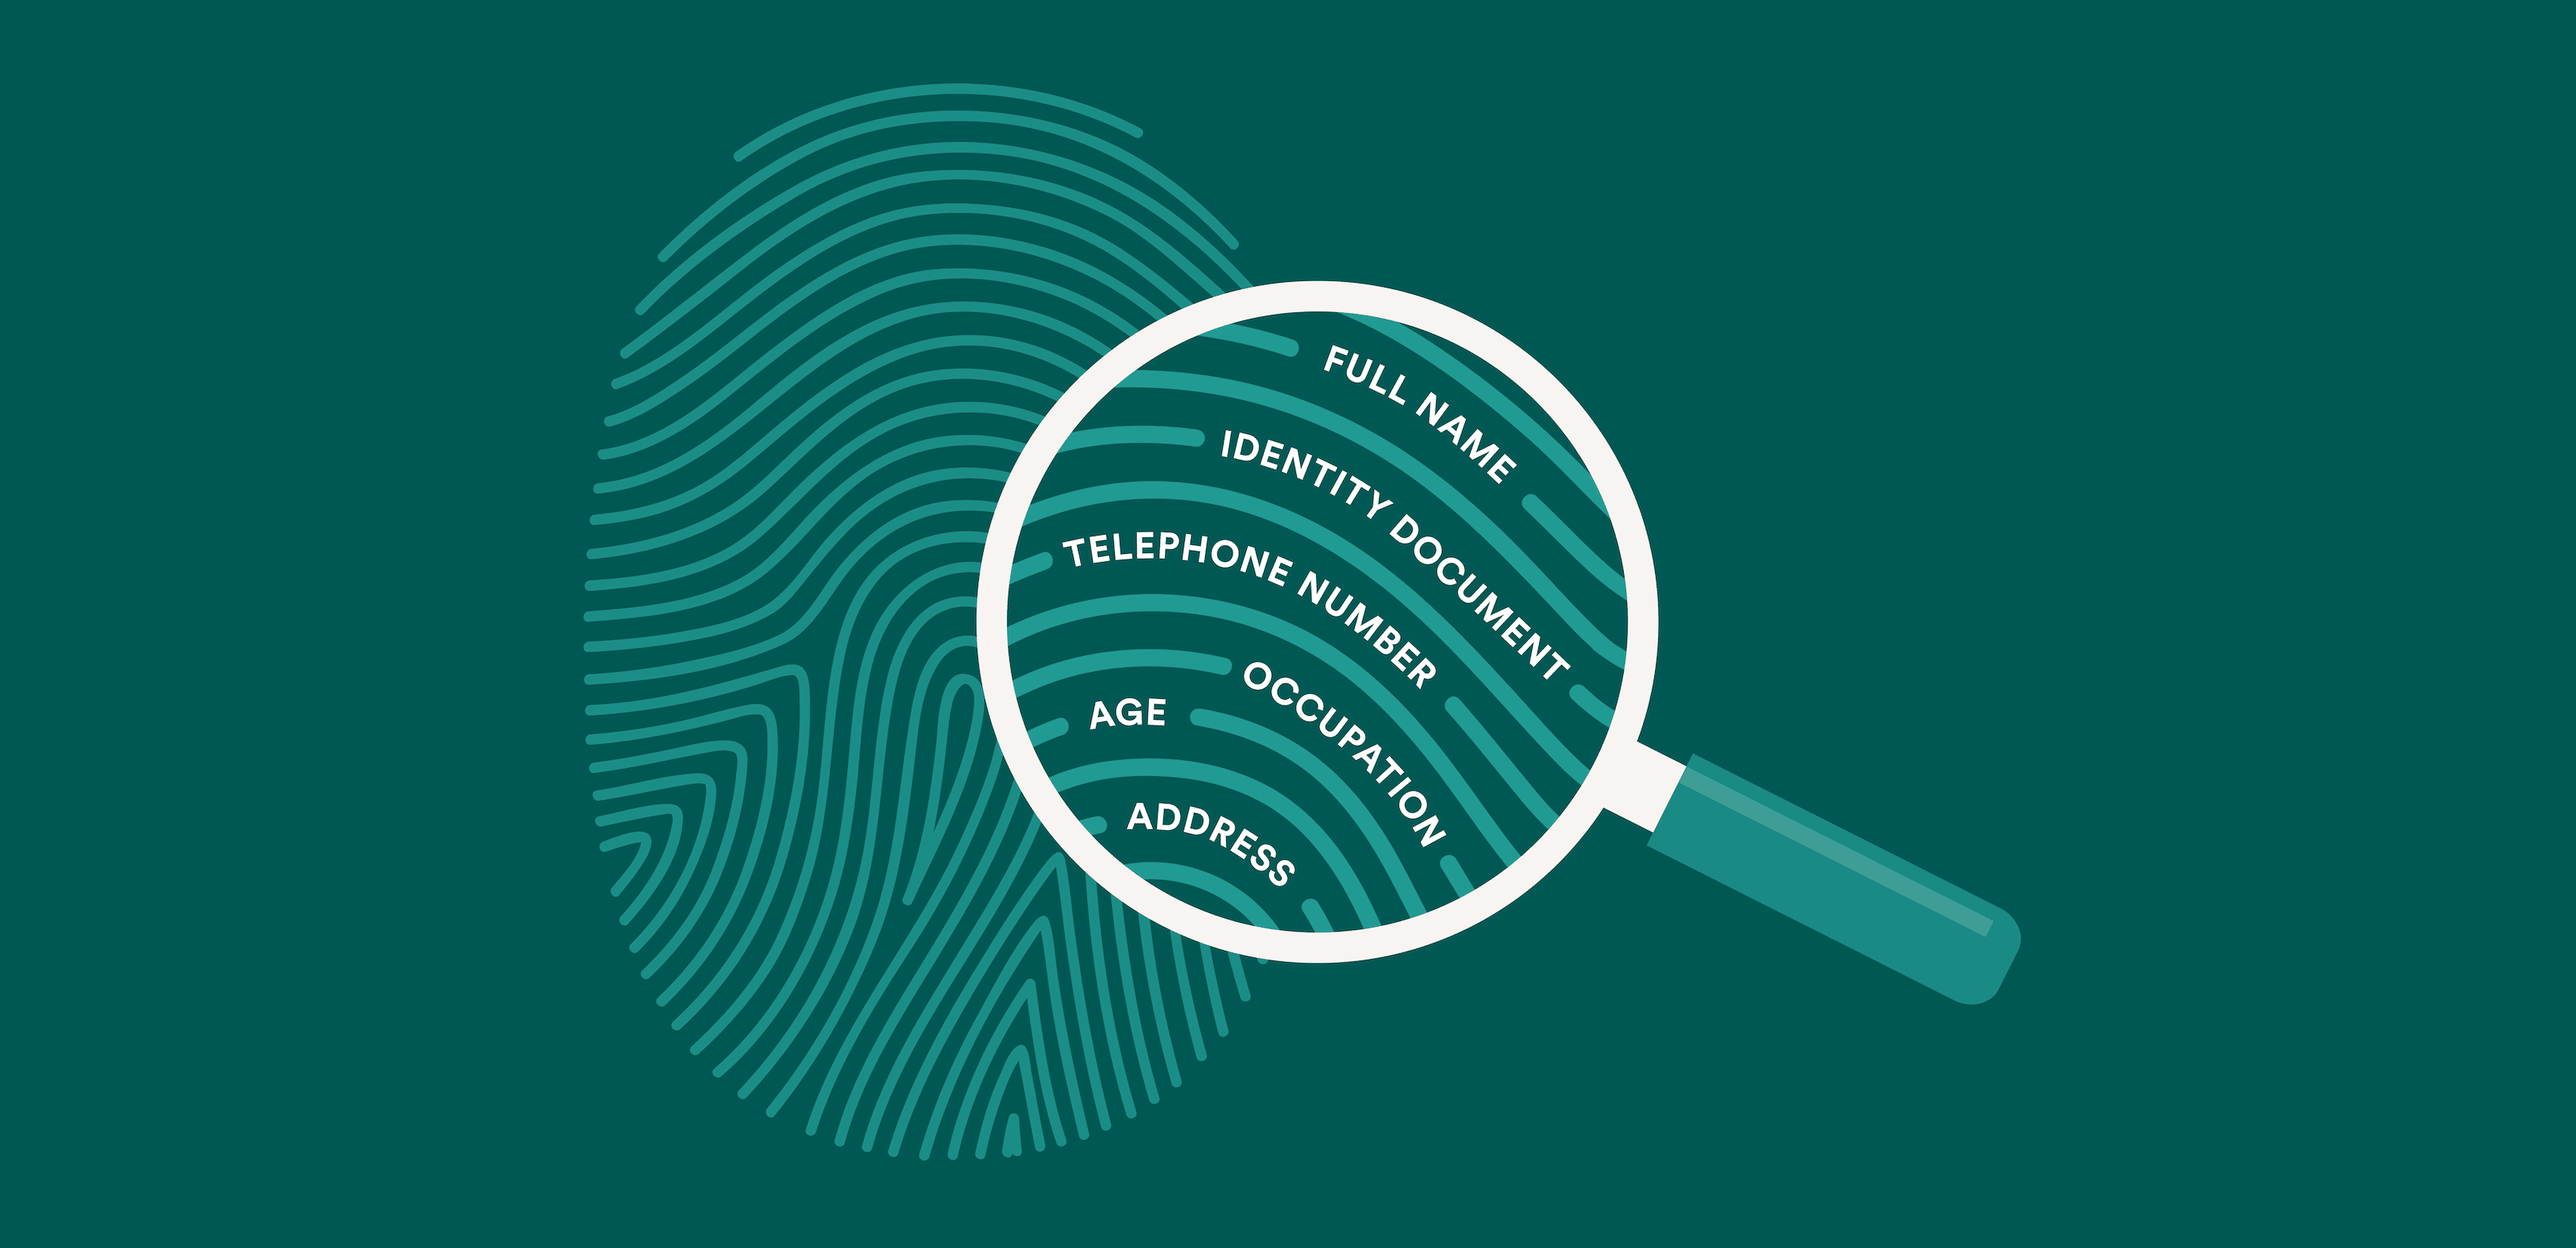
Demographic data correlated with low rates of broadband adoption/high need
- Personal Characteristics
a) Race/ethnicity
b) Educational attainment
c) Foreign born
d) Language other than English spoken at home
e) Formerly incarcerated/family member incarcerated
f) Employment status
- Household Characteristics
a) Income
i) Households below 100, 150 and 200 percent of poverty line
ii) Households receiving food stamps/SNAP/WIC etc
b) Household composition
i) Female-headed households
ii) Households with own children or other relatives under 18
iii) Households with relatives or non-relatives 65+
iv) Non-family households with residents 65+
Sources: These data are generally available from the Census, American Community Survey, Current Population Survey, Bureau of Justice Statistics, Bureau of Labor Statistics, and other federal and local agencies.
Planning for Resilience
For communities that wish to plan ahead for disasters and unexpected events, it is particularly important to identify populations that are less likely to respond to evacuation orders, as characterized by:
- Linguistically isolated households
- Households with relatives or non-relatives 65+
- Non-family households with residents 65+
- Caregivers for elderly relatives and people living with disabilities
- Transportation limited households
Some areas where broadband service is widely available (data on availability can be found via the National Broadband Map) nevertheless show very low rates of adoption; there are many possible reasons for this. The datasets listed above will allow for identification of populations that could benefit from broadband interventions; however, we would recommend further analysis to determine whether, for example, the provision of low-cost broadband service or digital literacy training would be the most effective intervention in a given area.
In many places where services are available but there are low rates of adoption, the problem may be with the cost of those services. However, the calculation of value of broadband service always involves many factors. Gauging those factors affecting the choice of whether or not to subscribe to broadband services may require gathering additional data via surveys, crowdsourcing or other methods. [4]
Mapping this information can help to identify areas in need of intervention. For cities, the scale potentially affords a regression or a spatial regression to identify which specific variables most strongly predict low home broadband adoption. The data sets listed above can be used as independent variables, with the FCC’s data on home broadband adoption by household as the dependent variable.
Wherever additional data sets on broadband adoption are available (such as market-research data on home broadband subscriptions), we recommend using them as well; the FCC Form 477 is only available in quintiles and at the census tract level, so for neighborhood-level analysis, finer-grain data is preferable. We also recommend joining the FCC data with land use and building data before performing a regression analysis, since areas with low density of residential uses (parks, industrial areas) may show either very high or very low adoption, due to small samples over large geographic areas.
Completing Phase 1 will provide an overall picture of where broadband interventions should be targeted and whom those interventions should serve. The following phases outline the first steps in planning the interventions.
Phase 2: Identify assets that could be useful for providing broadband access and services
The following types of organizations play an essential role in long-term sustainability of neighborhood technology investments. While many of these institutions and groups may not be focused on broadband, in our experience working in Philadelphia, Detroit, and New York, they recognize that expansion of access to information services is essential for their constituencies. We would recommend some assessment of these institutions’ readiness to engage with broadband access and adoption work, including existing bandwidth resources, as well as their capacity and interest in supporting technological resources.
- Community anchors that can support broadband services
a) Churches and faith-based social service institutions
b) Community-based organizations, community centers
c) Libraries [5]
d) Schools, educational, and workforce programs, including GED prep [6]
e) Social service facilities, including municipal aid and public/low-income housing
f) Cooperatives (food, child care, etc.)
g) Hackerspaces / Makerspaces
h) Major bandwidth buyers including hospitals, tech firms, and universities
- Commercial Internet service providers (especially local or independent firms)
- Middle-mile or “bulk” bandwidth providers
- Other Points of Interest
a) Public spaces (parks, plazas, etc)
b) Commercial corridors
c) Business Improvement Districts
Phase 3: Technical infrastructure data for network design
Once you have a sense of where technological interventions may be helpful, and who within these areas can serve as anchors and sustainers of networks and digital services, a technical planning layer can be added. Collecting and mapping the following pieces of information will provide a necessary baseline for deciding where and how to design broadband access projects. While some of this information may be available from federal agencies, it will likely require some fieldwork and environmental scans to scope out existing digital infrastructure and physical characteristics of the terrain.
Existing digital infrastructure
- WiFi networks and access points (closed and open)
- Digital literacy programs/computer labs
- Hackerspaces / Makerspaces
- Areas with and without mobile coverage (provider-based and crowdsourced data)
- Areas with and without provider-based broadband service (National Broadband Map)
Technical planning data for wireless networks – physical characteristics
- Building height, footprint data, including notable high points
- Existing Wireless Antenna Data: FCC Antenna Registrations http://wireless2.fcc.gov/UlsApp/AsrSearch/asrRegistrationSearch.jsp
- Potential alternative infrastructure – Lamp posts / Light poles
- Terrain and elevation
As government services, employment opportunities, and social networks move online, access to technology services such as broadband or wireless is becoming a universal necessity. Although studies by the Pew Research Center and the FCC have shown that approximately 100 million Americans do not have Internet access at home, current data available data sources on broadband adoption are limited. This brief is intended as a resource for community organizers, municipal agencies and corporate actors to understand existing digital ecosystems, so they can plan locally appropriate interventions around access provision and digital education. As a broader and longer-term solution, we need to rethink how we measure adoption and access, so that we can create policies and frameworks for serving populations in need.
NOTES
- Part of the American Reinvestment and Recovery Act of 2009
- See, for example, Dharma Dailey et al, Broadband in Low-Income Communities, 2010; Pew Center for Internet and American Life, Digital Differences, 2012; The Lens, “Poorer Communities Continue to Suffer Lack of Broadband Access — and Related Opportunities,” 2012.
- Starting September 2014, the FCC will streamline is Form 477 collection process, enabling data collection at the Census block level, as well as collection of mobile broadband usage. See: https://www.fcc.gov/document/fcc-modernizes-and-streamlines-broadband-voice-data-collection
- In many neighborhoods with low adoption, residents experience “research fatigue,” having been surveyed and interviewed many times without experiencing perceptible results from research conducted. We recommend crowdsourcing as a method to gather data without requiring additional time or effort from residents.
- Libraries and schools are poised to play a bigger role in adoption efforts as they are eligible for E-Rate subsidies from the federal government
- Given that the GED is moving to a digital format in 2014, organizations, which provide GED training may be particularly poised and interested in increasing Internet access and digital literacy. See: http://www.usatoday.com/story/money/personalfinance/2013/07/23/ged-price-increase-2014/2525473/
More About the Authors