
Perceptions vs. Reality
Since the inaugural Varying Degrees in 2017, we have looked at how Americans’ perceptions of higher education—about students, student debt, and institutions of higher education—compare to the reality. Understanding Americans' views tells us where we need to debunk myths about education after high school. This year’s questions are mostly similar to last year, focusing on three important topics: current undergraduates, student outcomes, and student loans. The results this year highlight the fact that Americans have reservations about graduation rates for those in undergraduate programs, and they overestimate the rate at which graduates are burdened by and struggling to repay student loan debt.
It is interesting to see that, even within the same survey, Americans can be optimistic about the value of higher education, and at the same time are not as cheerful when it comes to the outcomes for graduates. Only half of Americans think more than 50 percent of students in a bachelor’s degree program will graduate in four years. And even though most Americans still believe that those with only a bachelor’s degree earn more money than those without, a majority think that the median earning of these individuals is only within the $45,000 to $65,000 range. Cautious as their responses are, as it turns out, their perceptions are not too far from reality.
Meanwhile, media stories focused on students who are overburdened with loan debt have raised tremendous concern among Americans. Nearly half of Americans think that 50 to 80 percent of adults are carrying student loan debt, while according to the Federal Reserve Board’s 2018 Survey of Household Economics and Decisionmaking, only 16 percent of American adults have taken on debt for their own education.1 A majority of Americans mistakenly think that student loans are the largest source of consumer debt. At $1.5 trillion in total, the volume of student debt is considerably less than the $10 trillion sum that Americans owe on their mortgages and home equity loans.2 Unlike their perceptions on earnings and outcomes, Americans' estimates of student indebtedness are divorced from reality. Having said that, their responses underline their ongoing concerns about the ever-rising price of a college education and the increasing amount of debt that students are taking on to pay for it.
Americans’ perceptions mirror how higher education is affecting their lives. The section below will provide their responses in more detail. Showing the alignment or the gap between perceptions and reality is not to congratulate respondents on their knowledge of higher education issues, or to downplay their concerns, but to help us do better work communicating about higher education and developing policy solutions.
Perception
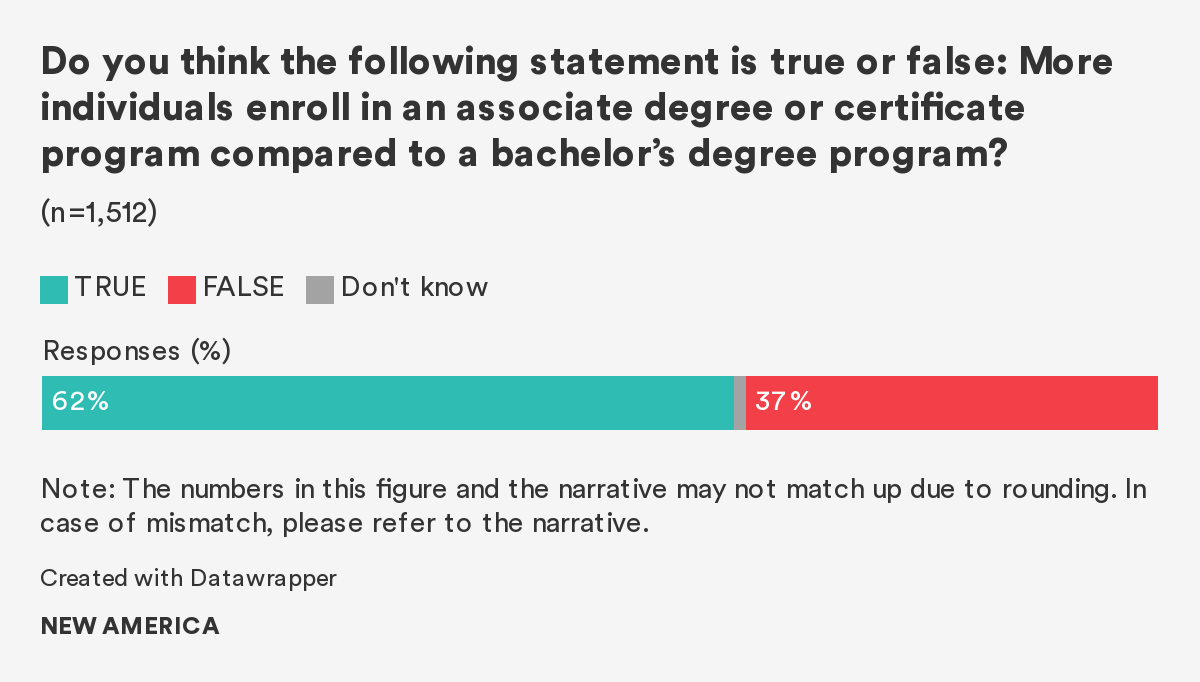
Sixty-two percent say that it is true that more individuals enroll in an associate or certificate program compared to a bachelor’s degree program.
Reality
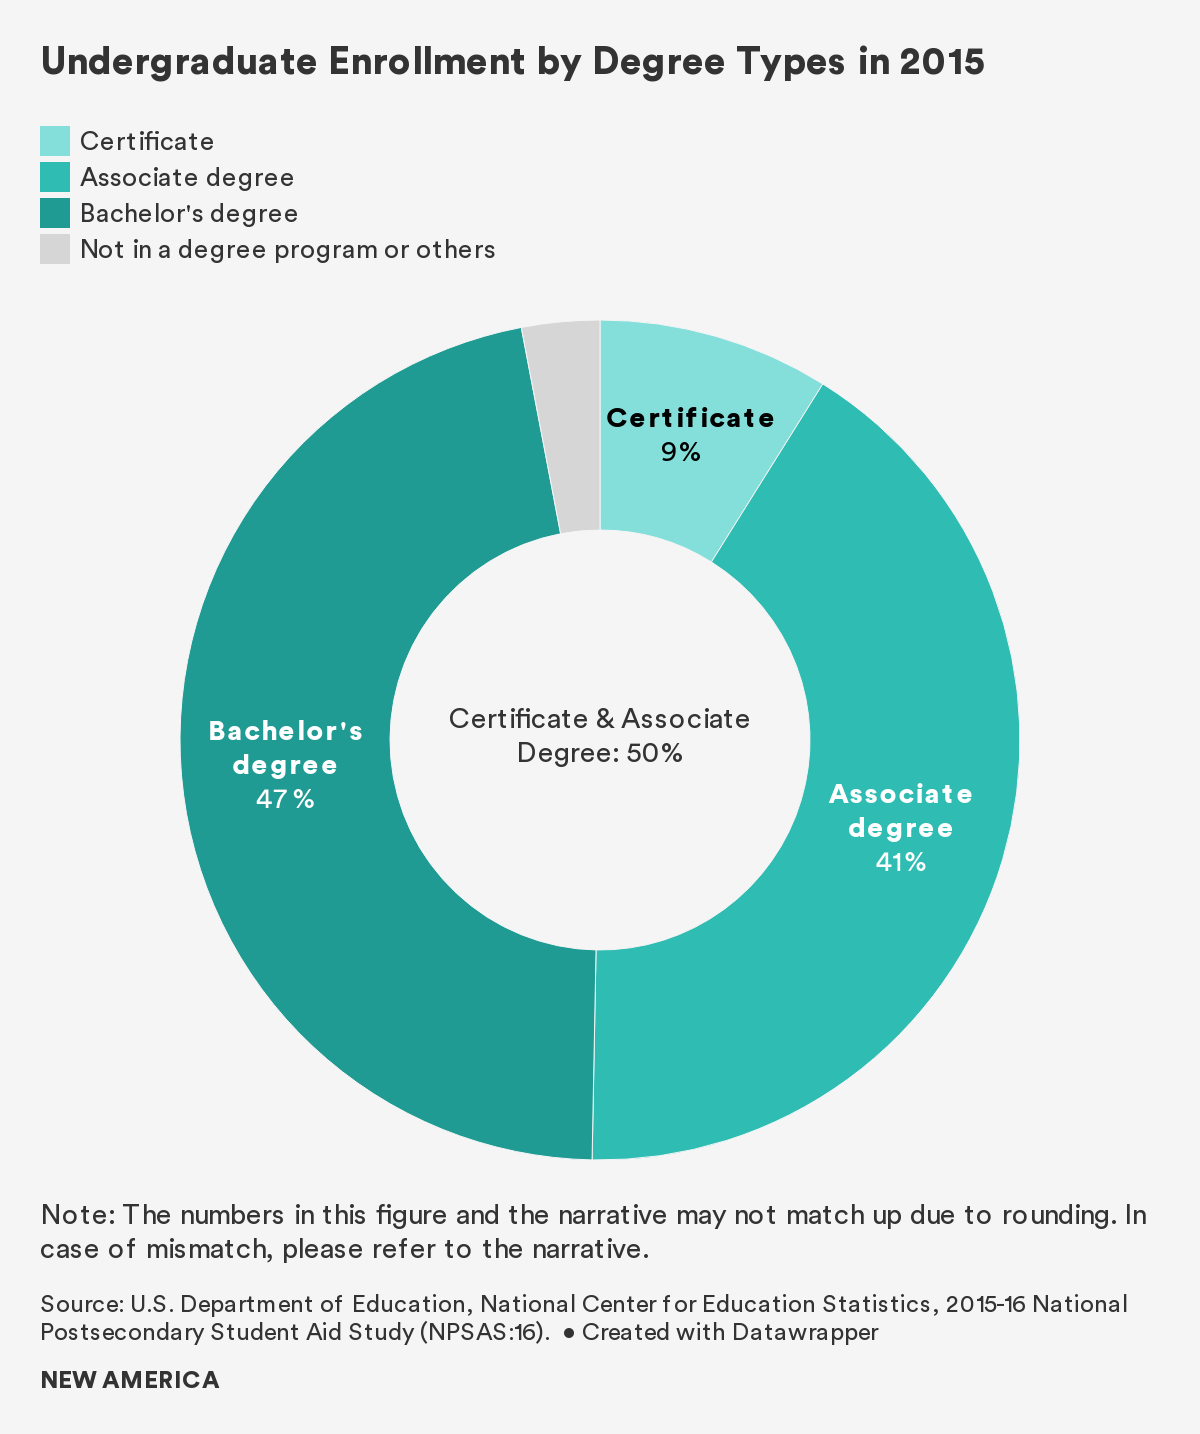
Americans are right. According to data from the National Postsecondary Student Aid Study, 50 percent of undergraduates were enrolled in either an associate or certificate program, while 47 percent were enrolled in a bachelor’s degree program in 2015.3
Perception
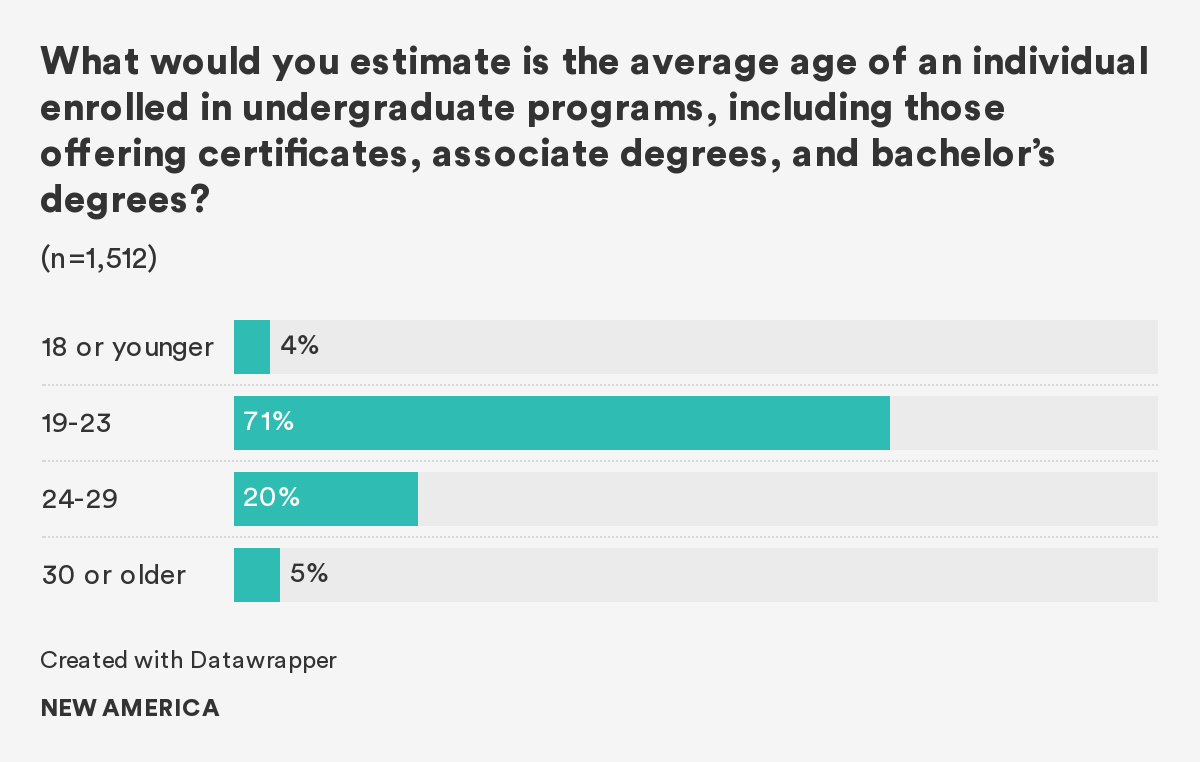
Most Americans think that an undergraduate student is 29 or younger; 71 percent think that the average age is between 19 and 23.
Reality
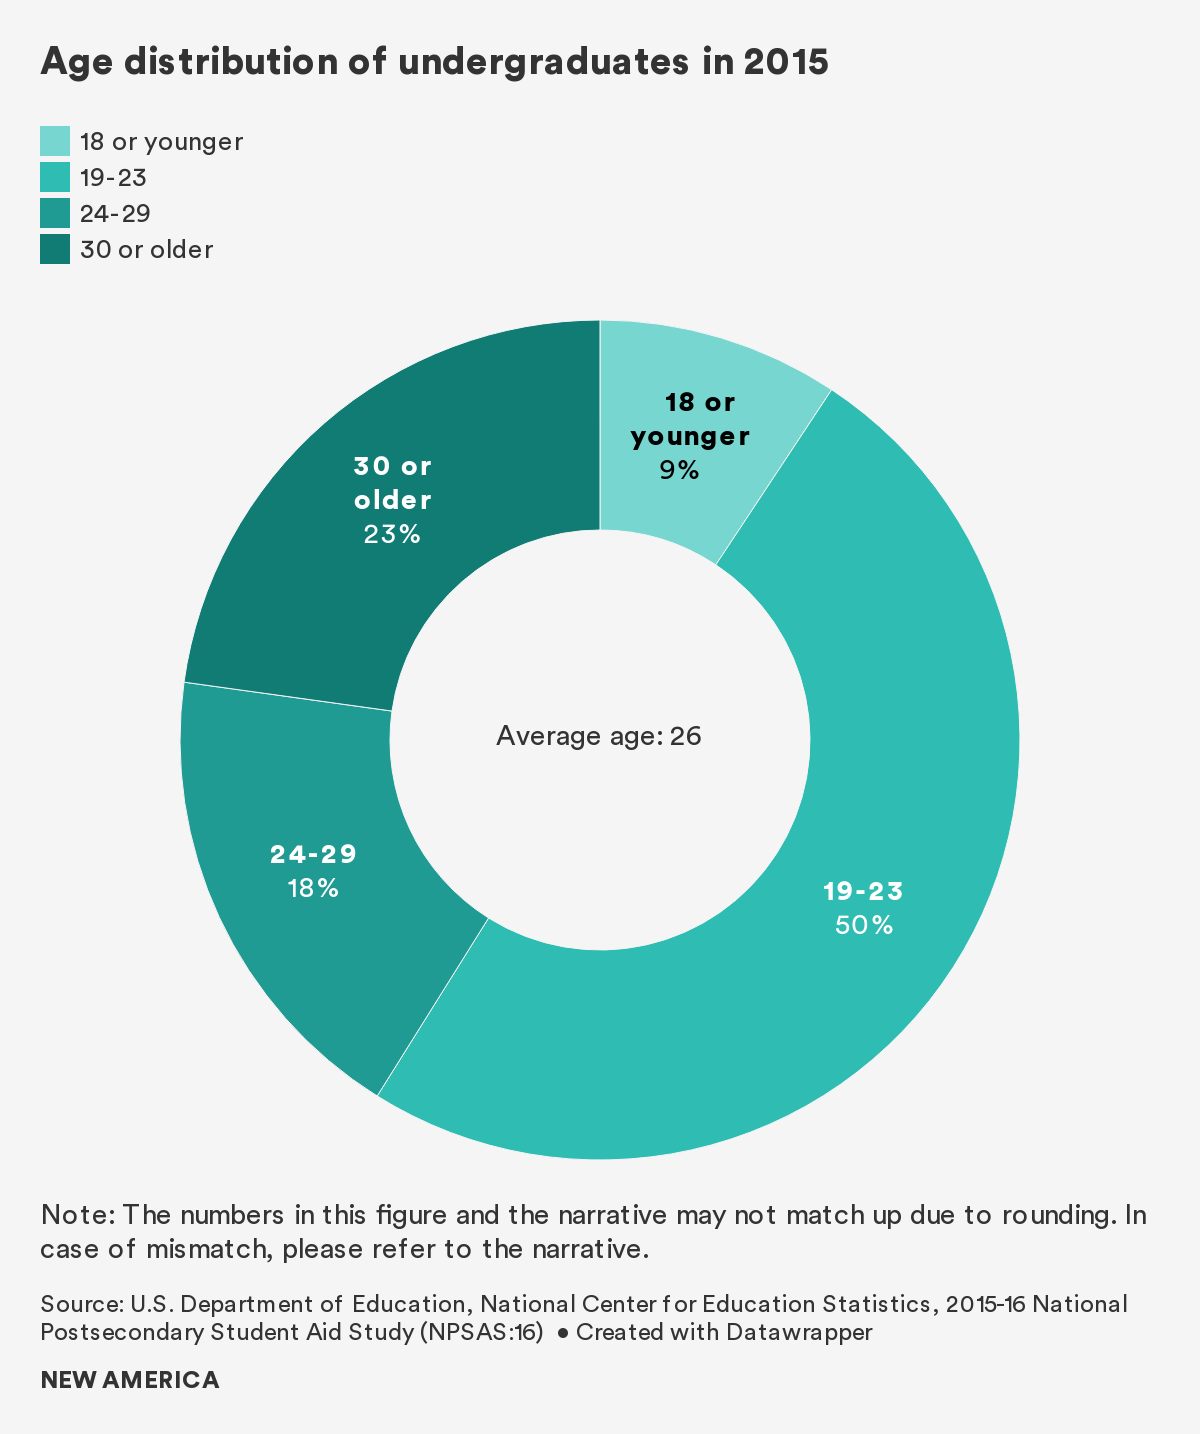
While most Americans picture a young student who directly enrolled in college after high school, the actual average age of an undergraduate in 2015 was 26. While a majority (59 percent) of undergraduates were still under the age of 24, a significant proportion of undergraduates—41 percent—were 24 or older.4
Student Outcomes
Perception
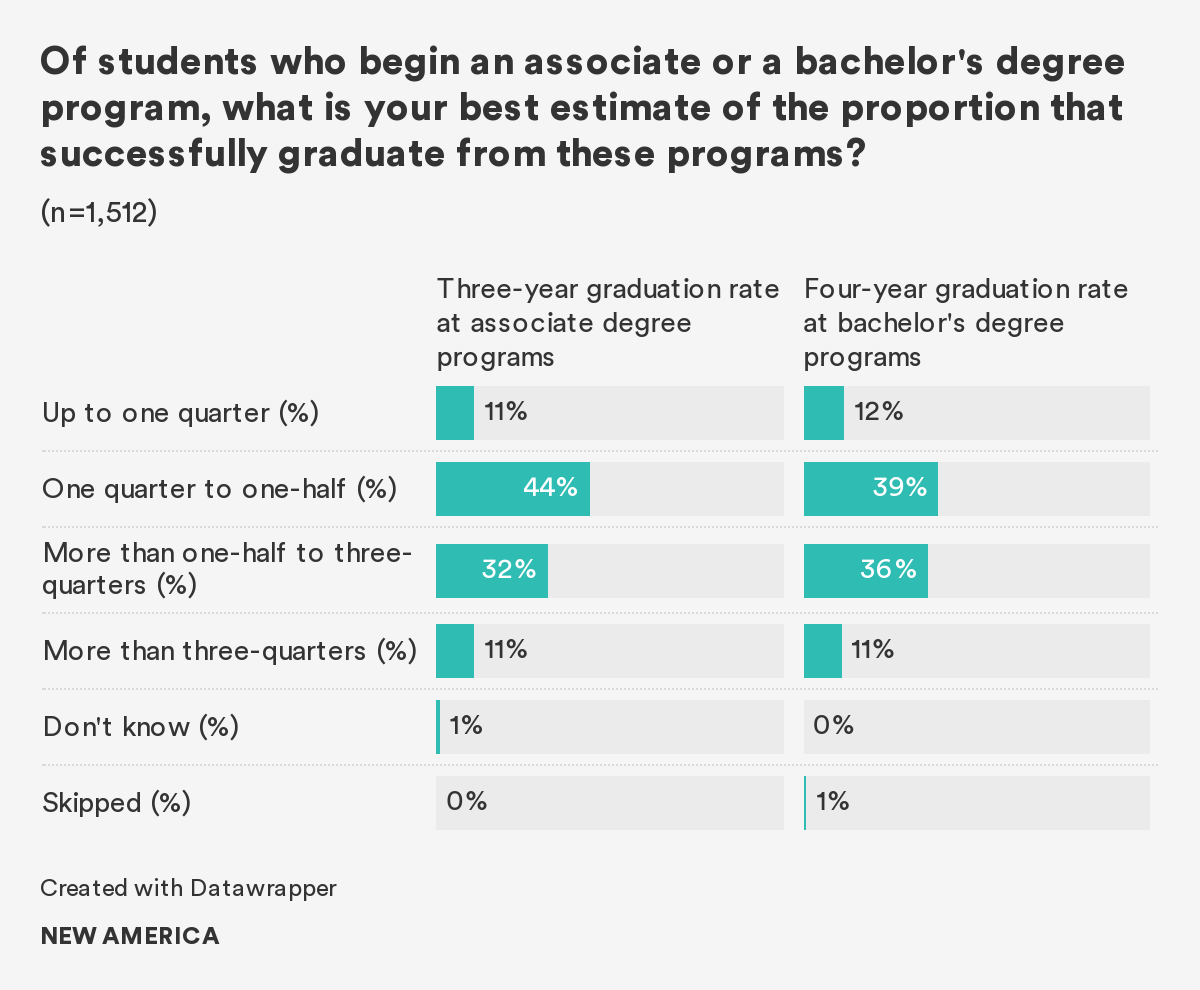
More than half of Americans (55 percent) think that half or fewer students who begin an associate degree program can finish within three years. Having said that, a significant 32 percent of Americans estimate that the graduation rate is between one-half and three-quarters.
Americans are split on the graduation rate of students who pursue bachelor’s degree programs. Half of Americans think less than 50 percent of these students would graduate in four years, but the other half think the graduation rate would exceed 50 percent. A significant 39 percent think that graduation rate is between a quarter and a half, and 36 percent think that the graduation rate is between a half and three-quarters
Reality
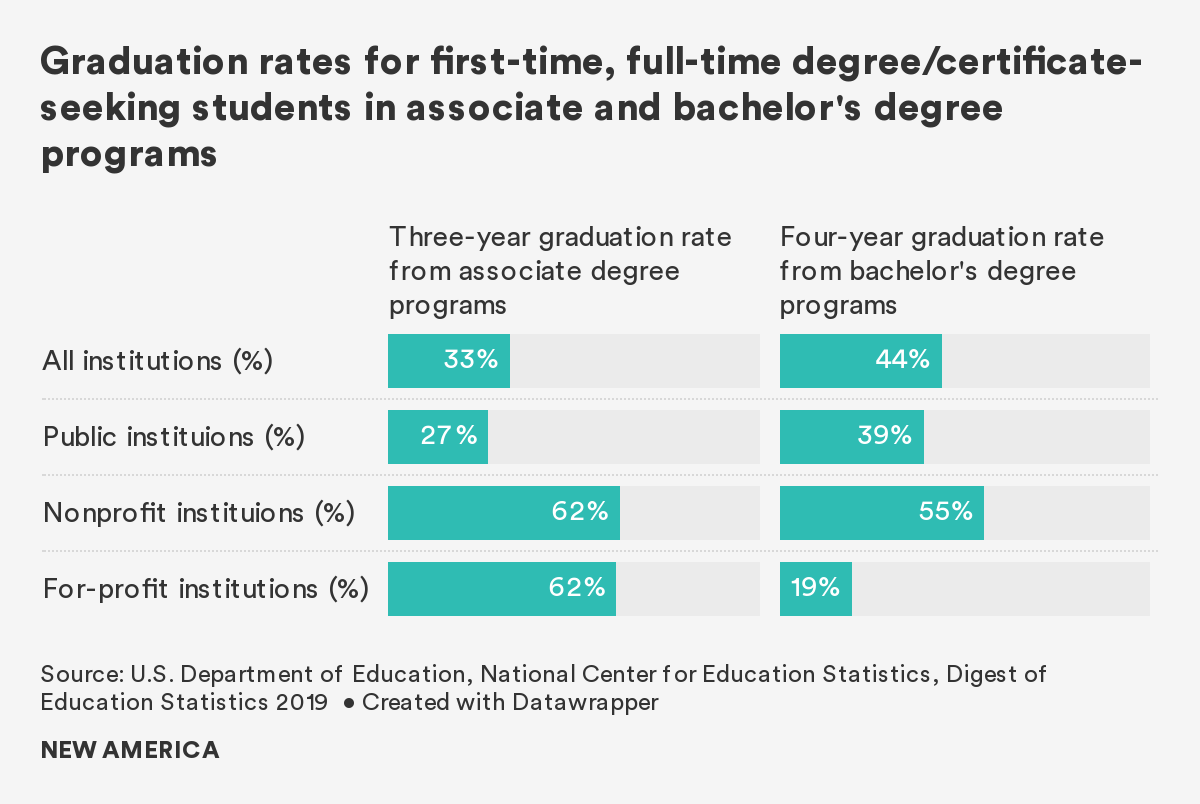
It is difficult to conclusively answer these questions. We do know that 33 percent of first-time, full-time students graduate with an associate’s degree or certificate within three years5 and 44 percent of first-time, full-time students graduate with a bachelor’s degree within four years.6 The data, however, do not include less than full-time students, who accounted for more than 55 percent of undergraduates in 2015,7 and transfer students, who represented 35 percent of undergraduates who started college in 2012.8
Perception
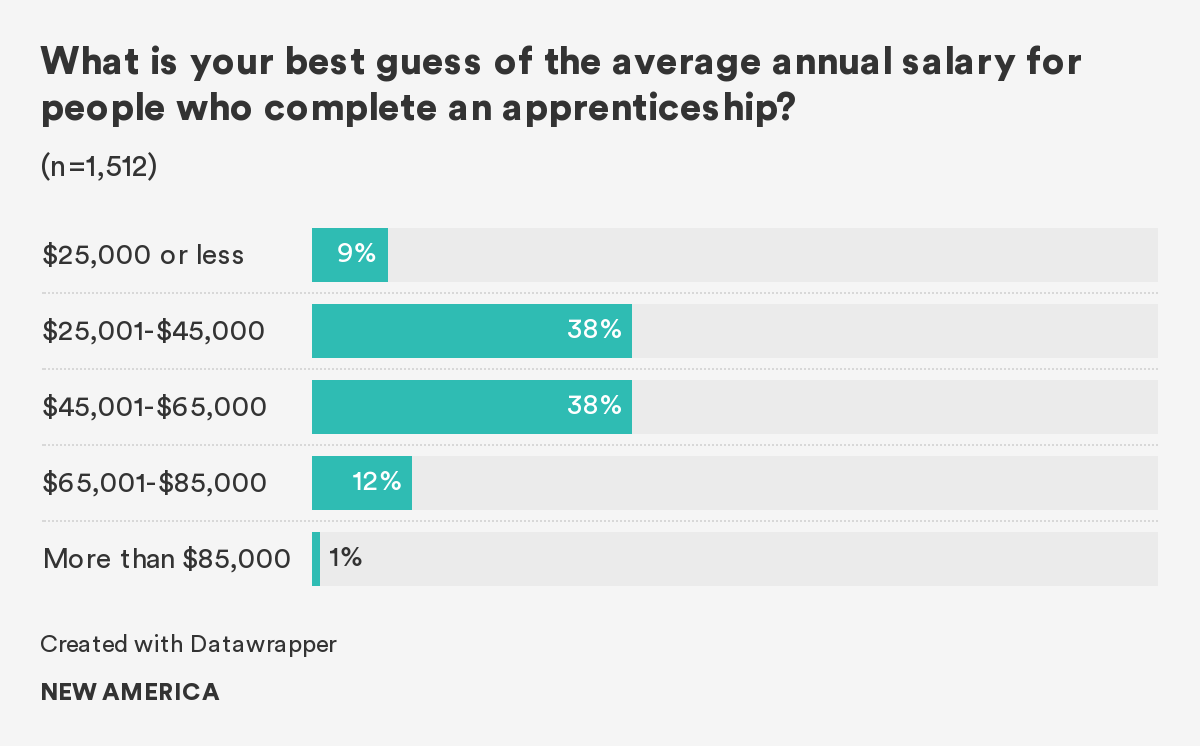
Americans are mixed about how much they think an individual who just completed an apprenticeship makes. Nearly 40 percent of Americans think the average earnings is somewhere between $25,000 and $45,000 a year, and a similar share (38 percent) think that the average annual salary for these individuals is between $45,000 and $65,000.
Reality
According to the U.S. Department of Labor, people who complete an apprenticeship on average earn $60,000 annually.9 Apprentices often graduate with jobs, credentials that can help them move up the career ladder, and little to no student loan debt.10
Perception
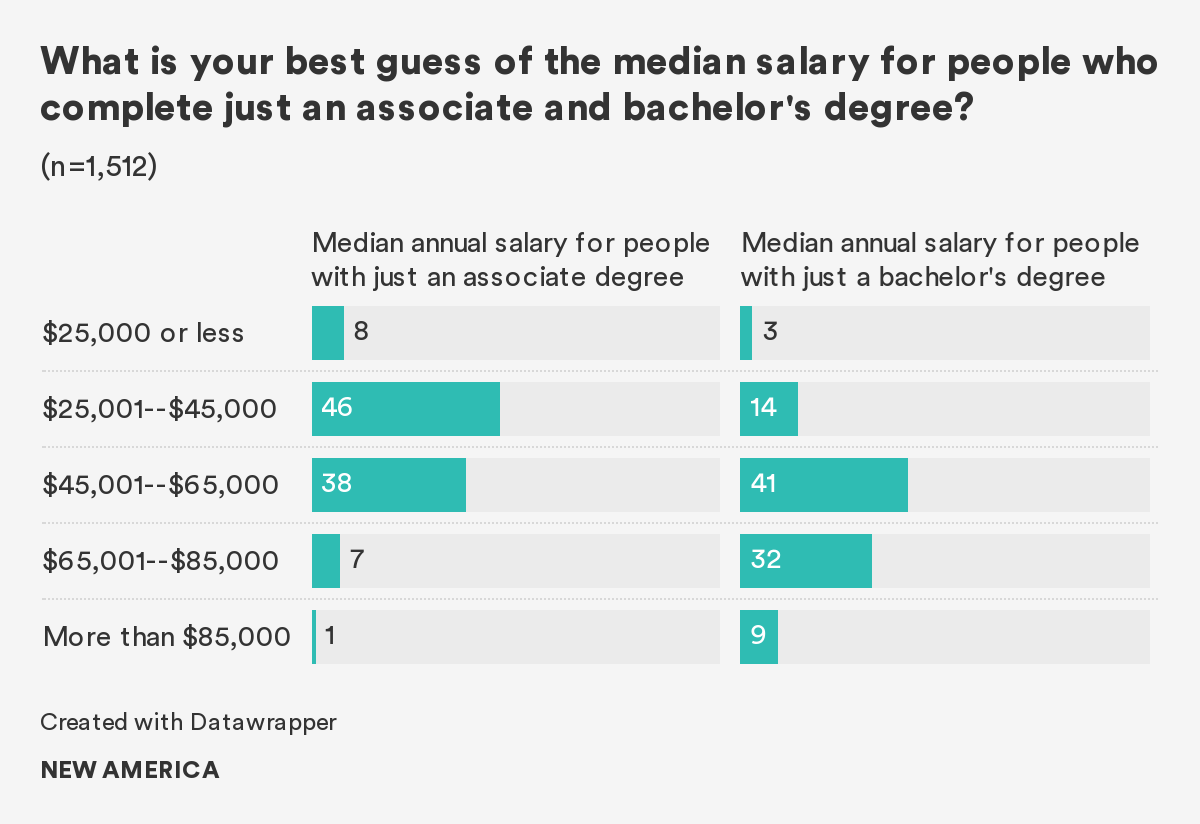
Nearly half of Americans (46 percent) think that the median annual salary for an individual who just completed an associate degree ranges between $25,000 and $45,000; 38 percent estimate that the number would be higher, from $45,000 to $65,000.
Four in five Americans (82 percent) think that the median annual salary for those with only a bachelor’s degree is $45,000 or higher: 41 percent think that the number is within the range of $45,000 to $65,000; 32 percent think that the salary is between $65,000 and $85,000.
Reality
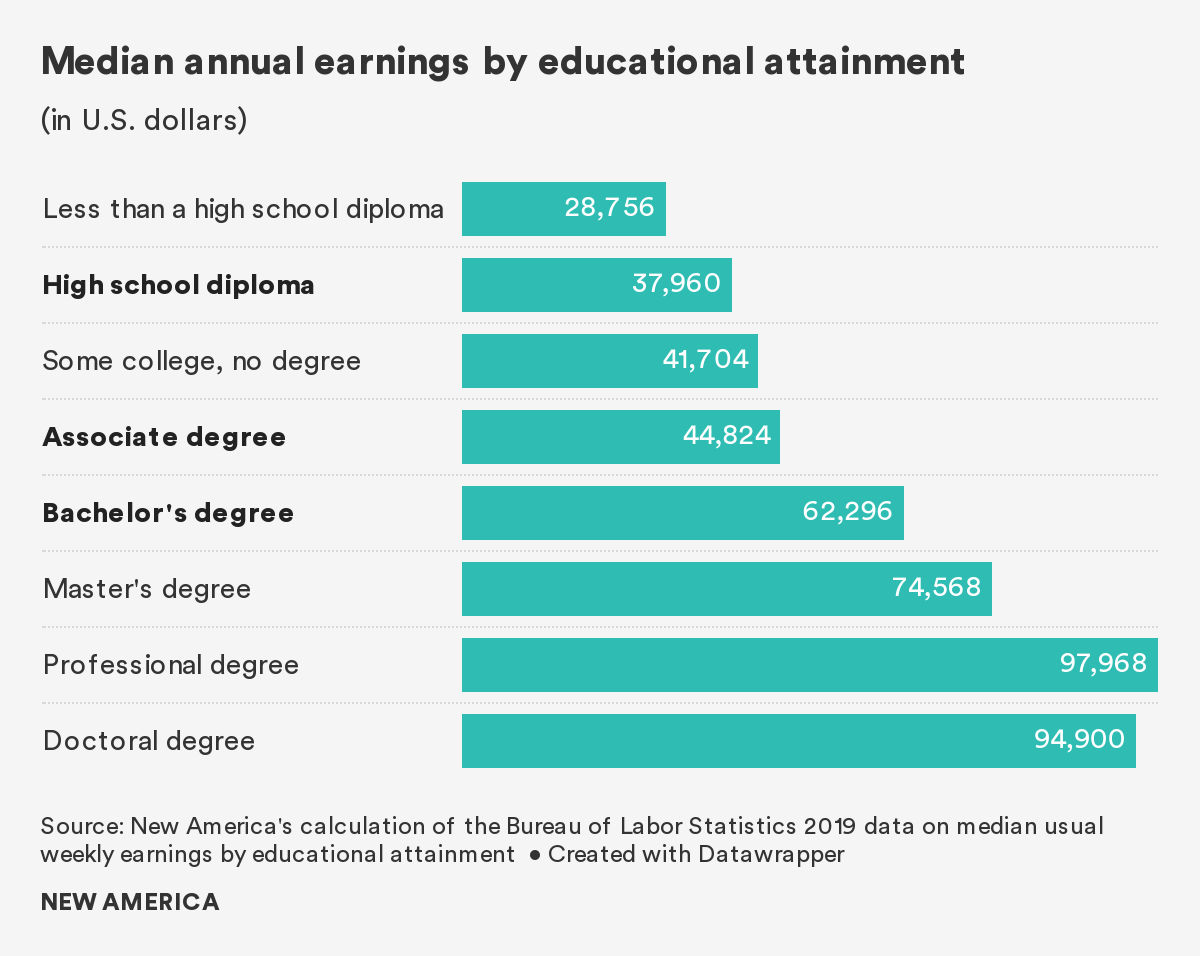
Bachelor’s degrees and higher continue to offer the largest payout. According to the Bureau of Labor Statistics, in 2019 the median annual earnings of individuals with associate degrees was nearly $45,000, and of those with bachelor’s degrees (and no postgraduate education) was approximately $62,000. These are nearly 20 and 65 percent more, respectively, than the annual earnings of someone who received a high school diploma or equivalency and did not pursue further education.11
Student loans
Perception
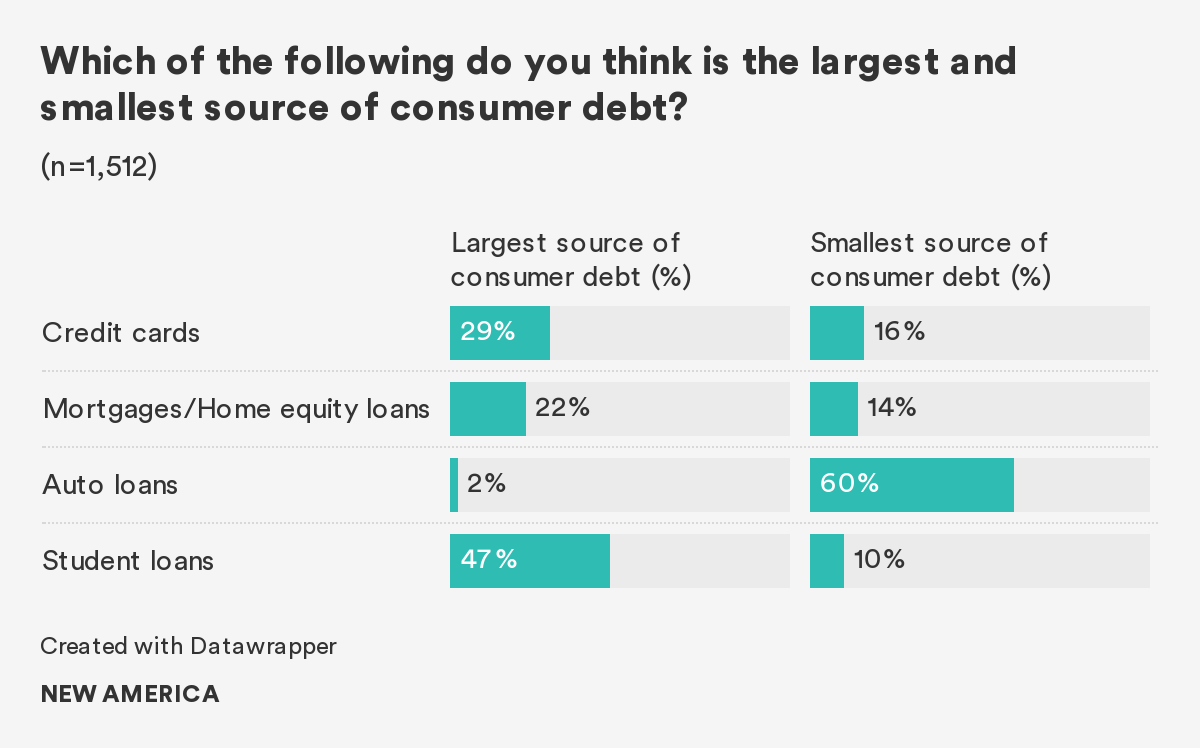
A majority of Americans think the largest source of consumer debt is student loan debt (47 percent), 29 percent think credit card debt, 22 percent say mortgages/home equity loans, and 2 percent say auto loans.
Asked in the opposite direction, 60 percent say auto loans are the smallest source of consumer debt, followed by credit cards at 16 percent, mortgages/home equity loans at 14 percent, and student loans at 10 percent.
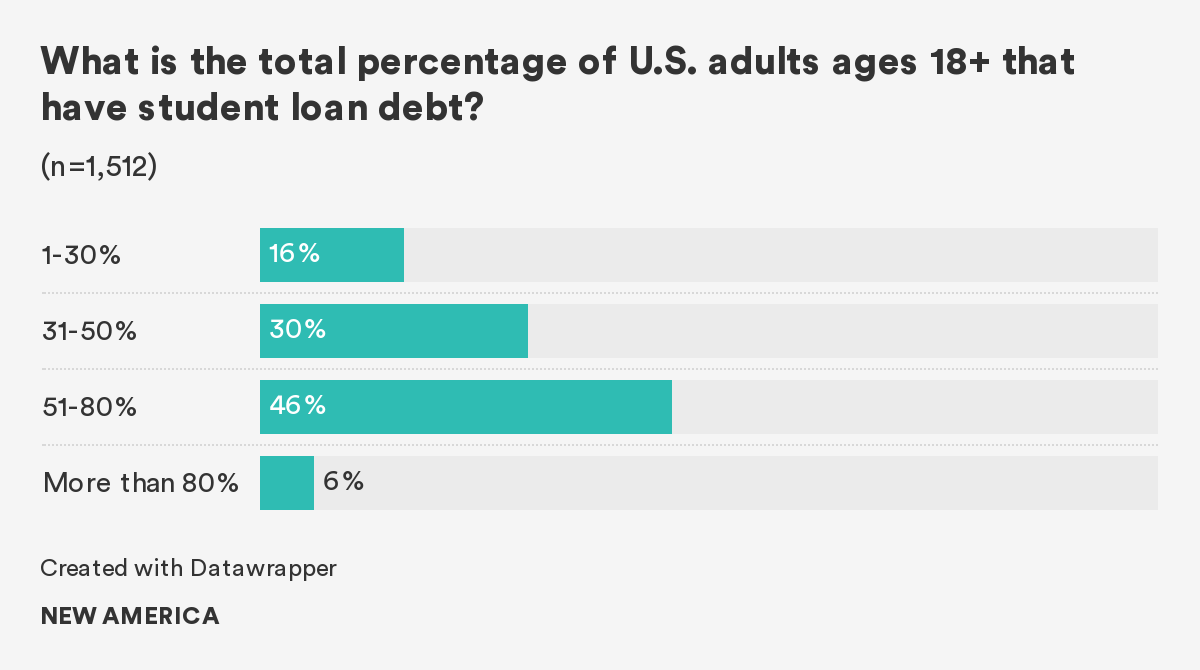
Four in five Americans (82 percent) think that more than 31 percent of American adults are carrying student loan debts. Nearly half think that the real percentage of Americans with student loan debt is somewhere between 50 to 80 percent.
Reality
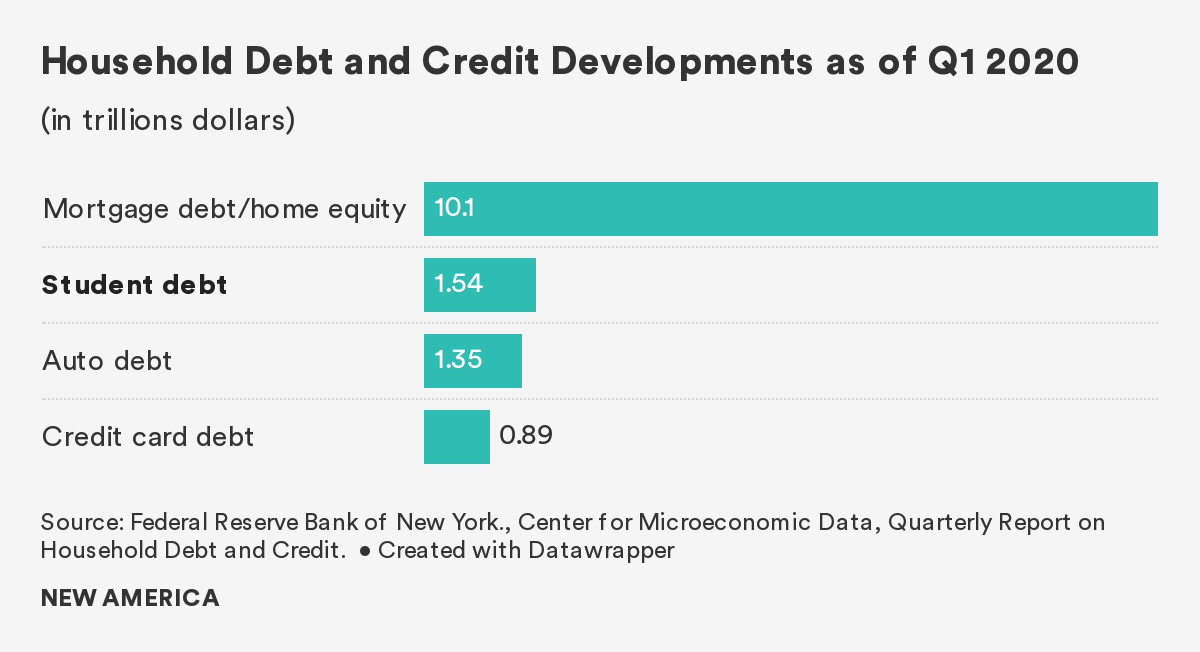
The largest source of consumer debt, in fact, are mortgages/home equity loans which account for approximately $10.1 trillion, distantly followed by student loans ($1.5 trillion), auto loans ($1.4 trillion), and credit cards ($898 billion).12 And, according to the Federal Reserve Board’s 2018 Survey of Household Economics and Decisionmaking, 16 percent of American adults currently hold student loan debt for their own education.13 If we also take into account people with student loan debt for their spouses, children, and grandchildren’s education, the percentage is 21 percent.14
Perception
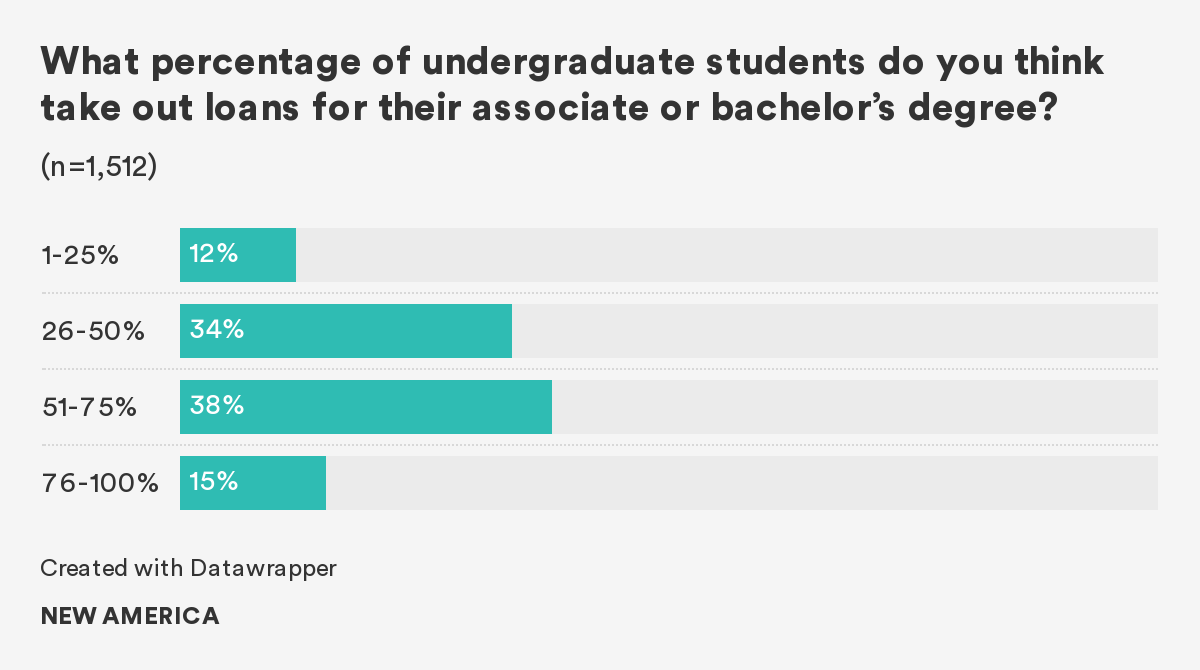
Nearly 40 percent of Americans think that between 51 and 75 percent of undergraduates borrow for their associate or bachelor’s degree. Fifteen percent of Americans think that borrowing rate is more than 75 percent.
Reality
Most Americans’ guesses are not too far from the truth: 60 percent of students who started their higher education in 2012 took out loans for their undergraduate programs.15 Specifically, 58 percent of students who held an associate degree by 2017, and 66 percent of students who held a bachelor’s degree took out loans.16 Additionally, a concerning 50 percent of students who dropped out before completing their degree or credentials also had student loan debt.17 These students are more likely to default on their student loans in the future.18
Perception
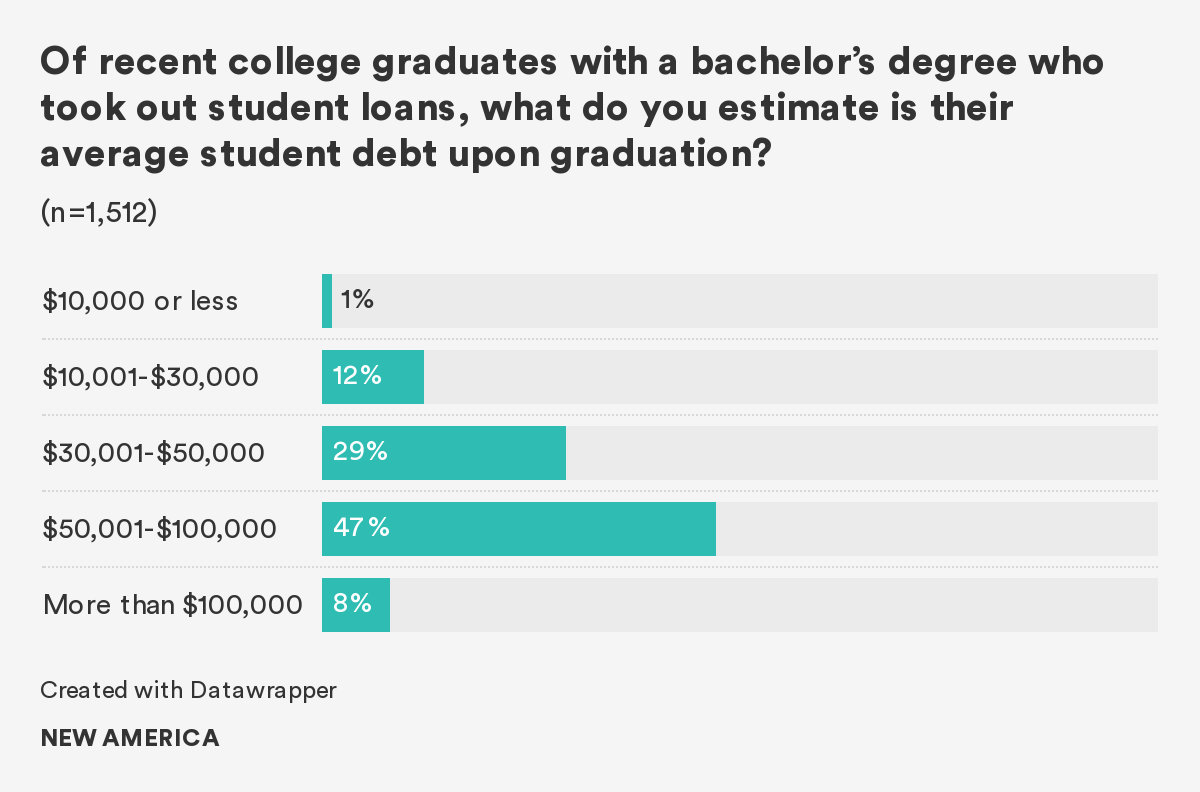
Nearly half of Americans think that the average student debt of a recent college graduate with a bachelor’s degree is between $50,000 and $100,000. Nearly a third think that the average is within $30,000 and $50,000. Eight percent think the average loan is more than $100,000 and only 1 percent think that the average loan is less than $10,000.
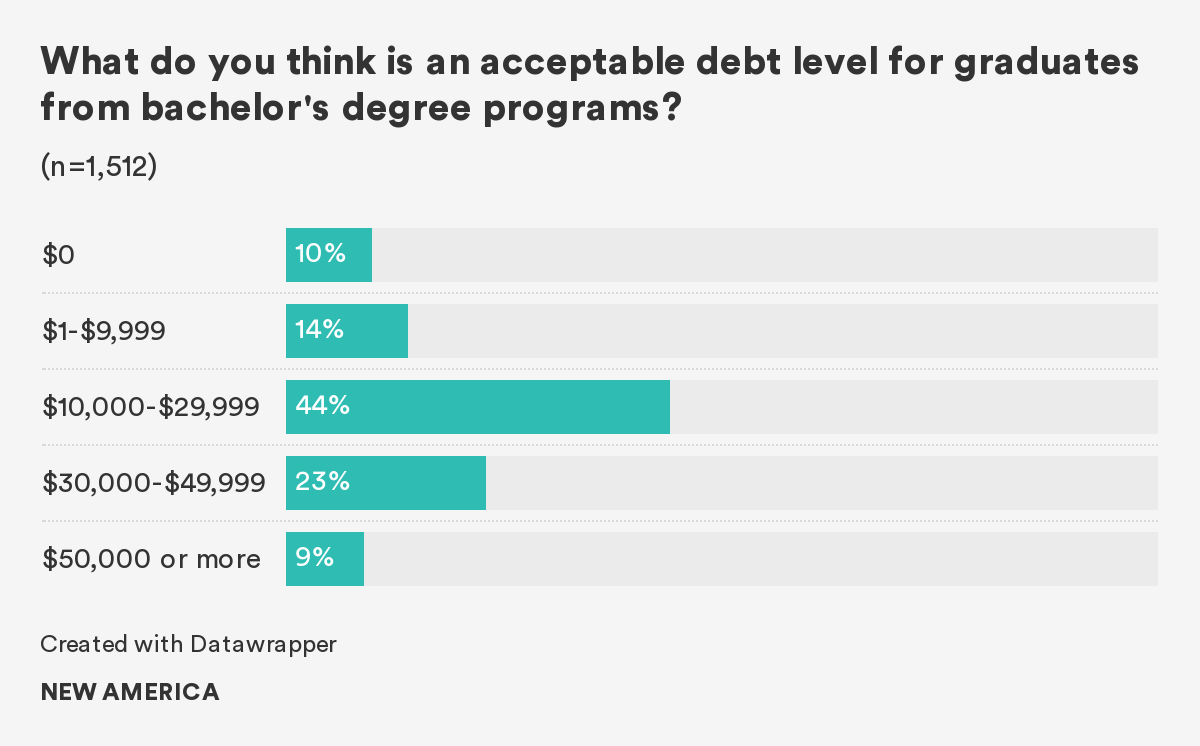
When asked what amount they think is acceptable, just under half say the amount should fall between $10,000 and $30,000. Nearly one in four Americans accept an amount between $30,000 and $50,000. One in ten Americans think that students should not borrow at all for their bachelor’s degree.
What Americans think of as reality turns out to be very different from what they find acceptable.
Reality
The average student debt, which includes both federal and private debt, at graduation for the class of 2018 at public and private nonprofit institutions was $29,200, compared to $39,900 for graduates of for-profit institutions.19 An average loan amount of less than $30,000 still aligns with what a majority of Americans thought to be acceptable.
Perception
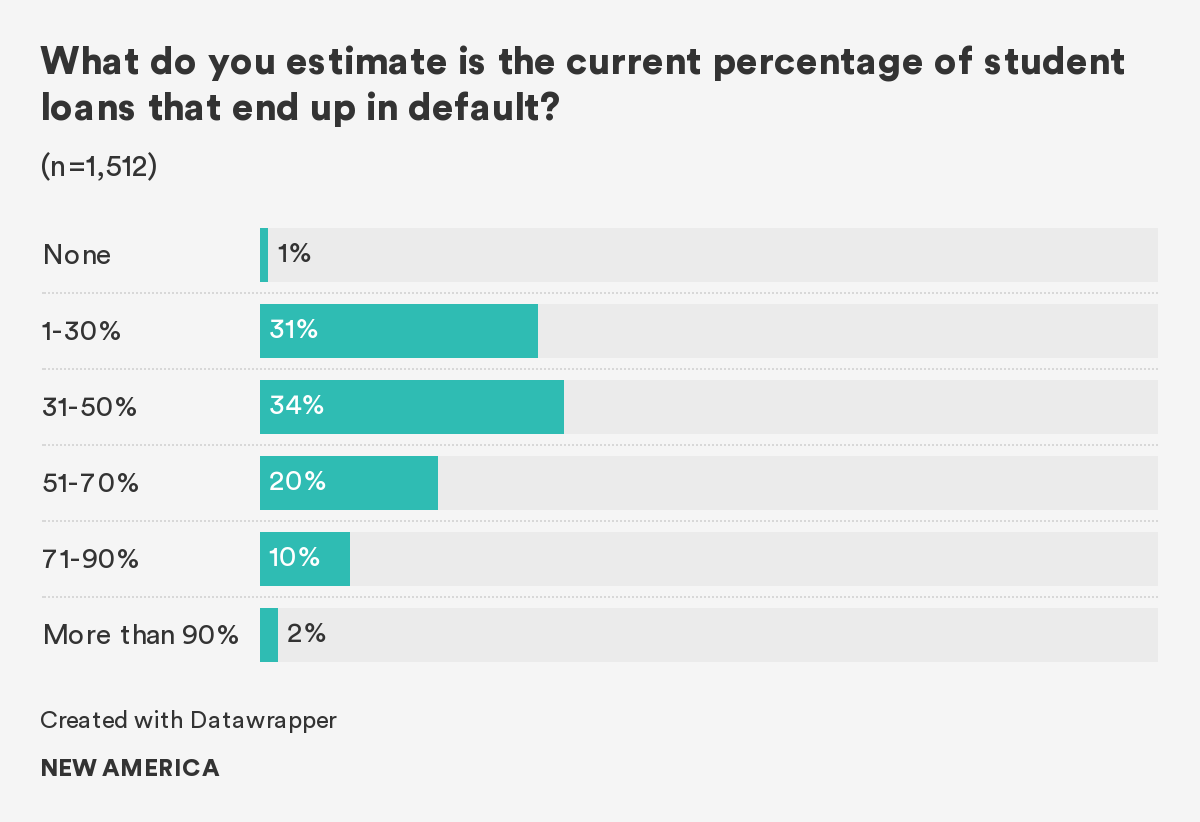
A third of Americans think that between 31 and 50 percent of student loans will end up in default. A similar share thinks that the default rate will be less than 30 percent, while more than 10 percent think that the default rate is more than 70 percent.
Reality
Over one million students every year default on their loans.20 More than 16 percent of borrowers who started higher education in 2012 defaulted on their student loans five years later.21 Student loans are classified as “in default” when a student fails to make a minimum payment for 270 days. Default rates vary significantly across students and institutions: nearly 30 percent of Black borrowers defaulted on their student loans, compared to 12 percent of white borrowers.22 Forty-one percent of those who dropped out without a credential defaulted compared to only 6 percent of those with a degree.23 A third of students who started in private for-profit institutions defaulted within the same period.24
Citations
- Author’s calculation of data from the Survey of Household Economics and Decisionmaking 2018 (Washington, DC: Federal Reserve Board, 2019), source
- Federal Reserve Bank of New York, “Pre-COVID-19 Data Shows Total Household Debt Increased in Q1 2020, Though Growth in Non-Housing Debt Slows,” press release, May 05, 2020, source
- National Center for Education Statistics (website), The National Postsecondary Student Aid Study 2016 (NPSAS:2016), source
- NPSAS:2016, source
- National Center for Education Statistics (website), Digest of Education Statistics, Table 326.20, source
- National Center for Education Statistics (website), Digest of Education Statistics, Table 326.10, source
- NPSAS:2016, source
- National Center for Education Statistics (website). Beginning Postsecondary Students 2012/2017 (BPS:2012/2017), source
- Department of Labor, “Workforce System and Apprenticeship Partnerships,” source
- Team CESNA, “Building Strong and Inclusive Economies through Apprenticeship,” New America, source
- Author’s calculation of data from the U.S. Bureau of Labor Statistics (website), “Unemployment Rates and Earnings by Educational Attainment,” last modified September 4, 2019, source
- Federal Reserve Bank of New York, “Pre-COVID-19 Data Shows Total Household Debt Increased in Q1 2020, Though Growth in Non-Housing Debt Slows,” press release, May 05, 2020, source
- Author’s calculation from data from the Federal Reserve Board, “Survey of Household Economics and Decisionmaking 2018,” source
- Author’s calculation from data from Survey of Household Economics and Decisionmaking 2018
- BPS:2012/2017, source
- BPS:2012/2017
- BPS:2012/2017
- “Student at Greatest Risk of Loan Default,” Institute for Student Access & Success, April 2018, source
- Veronica Gonzalez, Lindsay Ahlman, and Ana Fung, Student Debt and the Class of 2018 (Oakland, CA: Institute for Student Access & Success, September 2019), source
- Author’s calculation of data from Office of Federal Student Aid (website), “Default Rates,” source
- BPS 2012/2017, source
- BPS 2012/2017
- BPS 2012/2017
- BPS 2012/2017