Perceptions versus Reality
Student Outcomes
Perception
A majority of Americans (55 percent) think that one-half or fewer students who begin an associate degree program can finish within three years. More specifically, 41 percent think that the proportion of those who finish in three years lies between one-quarter and one-half. Still, 35 percent of Americans estimate that the proportion is between one-half and three-quarters.
When it comes to the graduation rate for bachelor's degree programs, half of Americans think that only one-half or fewer students who begin a program can finish within four years. More than a third (36 percent) think that the graduation rate lies between one-quarter and one-half, while another third (37 percent) think that it is one-half and three-quarters.
Reality
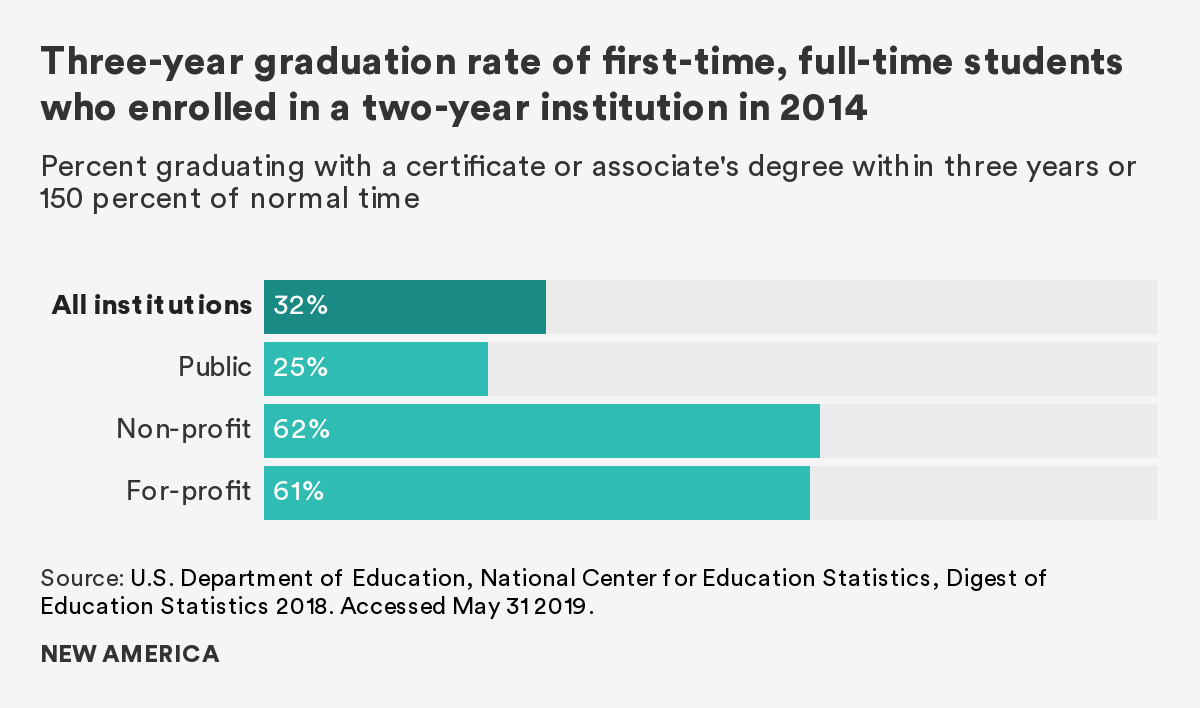
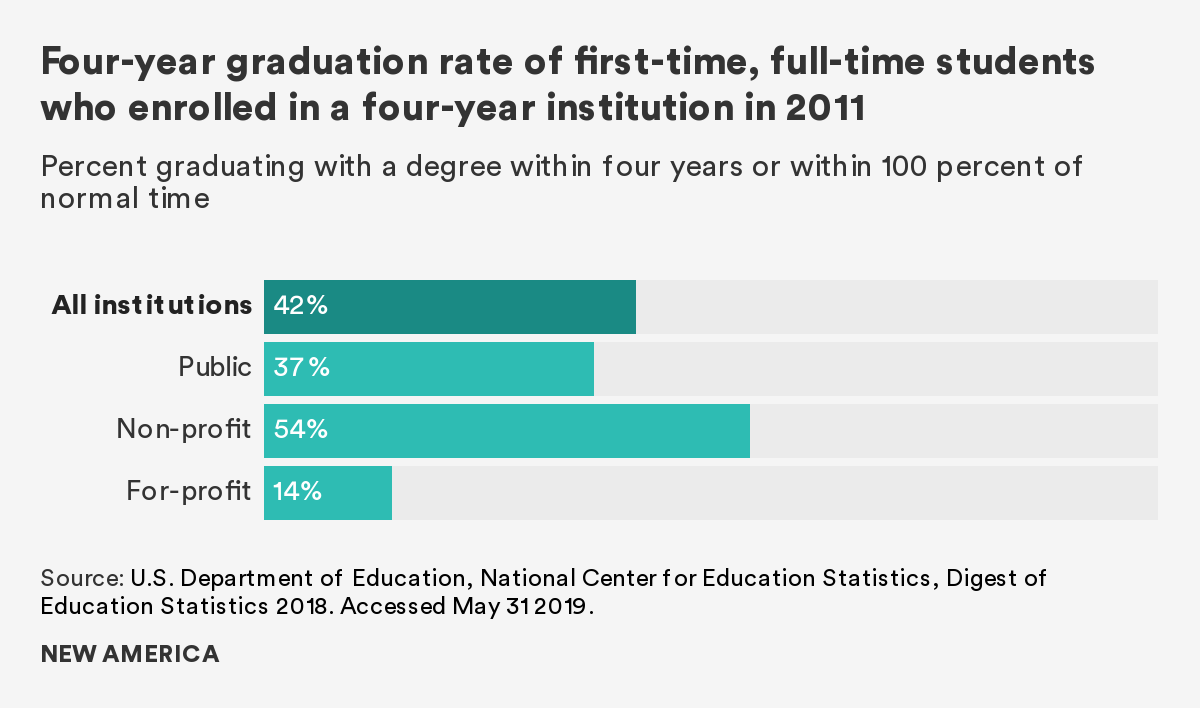
Unfortunately, it is difficult to definitively say what the graduation rate is. We do know that 32 percent of first-time, full-time students graduate with an associate degree or certificate within three years and 42 percent of first-time, full-time students graduate with a bachelor's degree within four years.1
It is difficult to form a clear picture of national graduation rates due to the current ban on collecting student level data and an antiquated federal definition of graduation rate. The Department of Education’s official graduation rate, for example, only reflects the share of first-time, full-time students who graduate within 150 percent of the expected time to completion, which means part-time and transfer students are excluded from the number of students who graduate.2 In other words, this measurement does not capture a large share of today’s students: Nearly 59 percent of students transfer at least once and 40 percent attend part time.3 The College Transparency Act, a recently reintroduced bipartisan, bicameral piece of legislation, would create a secure, privacy-protected data network to answer this college completion question, among many other unanswered questions about students’ outcomes in higher education.4
Based on the available data, we know that graduation rates at both four-year and two-year schools vary significantly across institutions and institution types. Four-year graduation rates can range from an average 54 percent at a non-profit four-year institution to 15 percent at a for-profit institution—a sign that academic quality and student supports are not the same at all schools.5 College completion critically affects economic outcomes: Adults with a degree have higher wages and lower rates of unemployment, and students who borrow but do not graduate have an increased risk of student loan default.6 Given how important graduation rates are for post-college success, students and policymakers need access to accurate graduation rate data.
Today’s Students
Perception
For 62 percent of respondents, more individuals enroll in an associate or certificate program than in a bachelor's degree program.
Reality
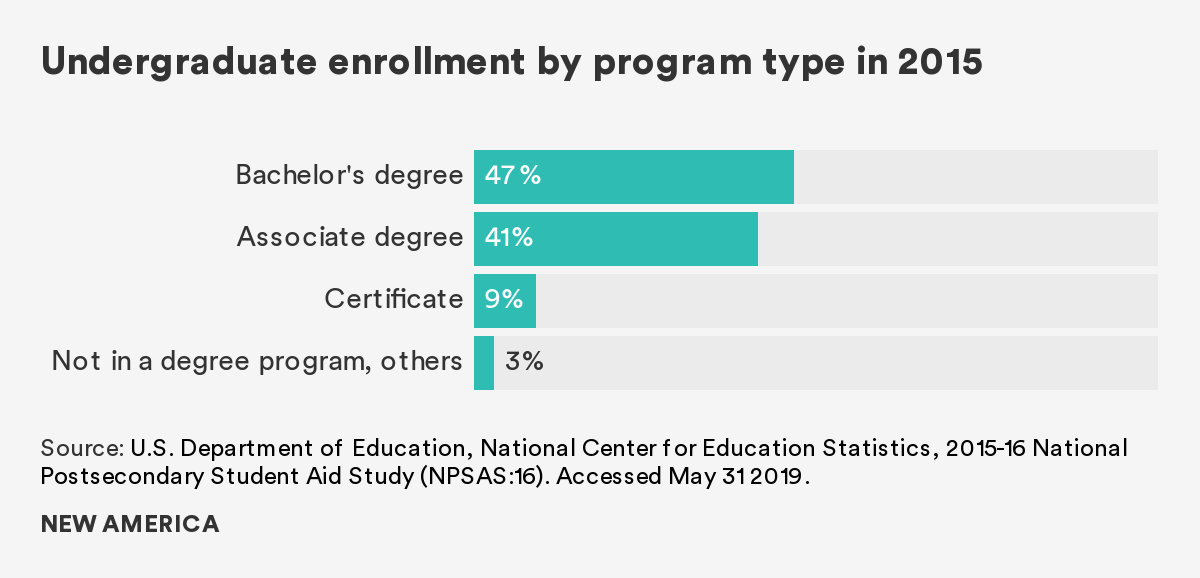
According to data from the 2016 National Postsecondary Student Aid Survey, 47 percent of undergraduates were enrolled in a bachelor's degree program, 41 percent in an associate degree program and 9 percent in a certificate program in 2015–2016.7
Different credentials vary not only in program length, but also in the students who choose them, and the type of institutions they attend. The majority of students in bachelor's degree programs are dependent (i.e., they are less than 24 years old, not married, and not caring for dependents) and attend school full time. Nearly 30 percent of them live in a residence hall on campus, and most do not have a full-time job. On the other hand, students in associate degree and certificate programs are more likely to be independent, attend part time while working full time, and live off campus.8
Additionally, 94 percent of students in a bachelor's degree program attend either a public four-year or a private non-profit institution, and 80 percent of students in an associate degree program attend a public two-year institution, more commonly known as community or technical college. For students in certificate programs, while 45 percent of them study at community colleges, roughly the same number choose for-profit institutions, which are known to have poorer graduation, employment, and student loan repayment outcomes.9
The data paint a diverse picture of the undergraduate population. Interventions to improve access and student success in higher education, therefore, should not treat this group as monolithic. Rather, they should be program-specific and student-focused, so that students are protected from enrolling in poor-performing programs with no or very little return on investment.
Perception
More than nine in 10 (94 percent) Americans think that an undergraduate student is 29 or younger: Specifically, 65 percent of Americans think that the average age is between 19 and 23.
Reality
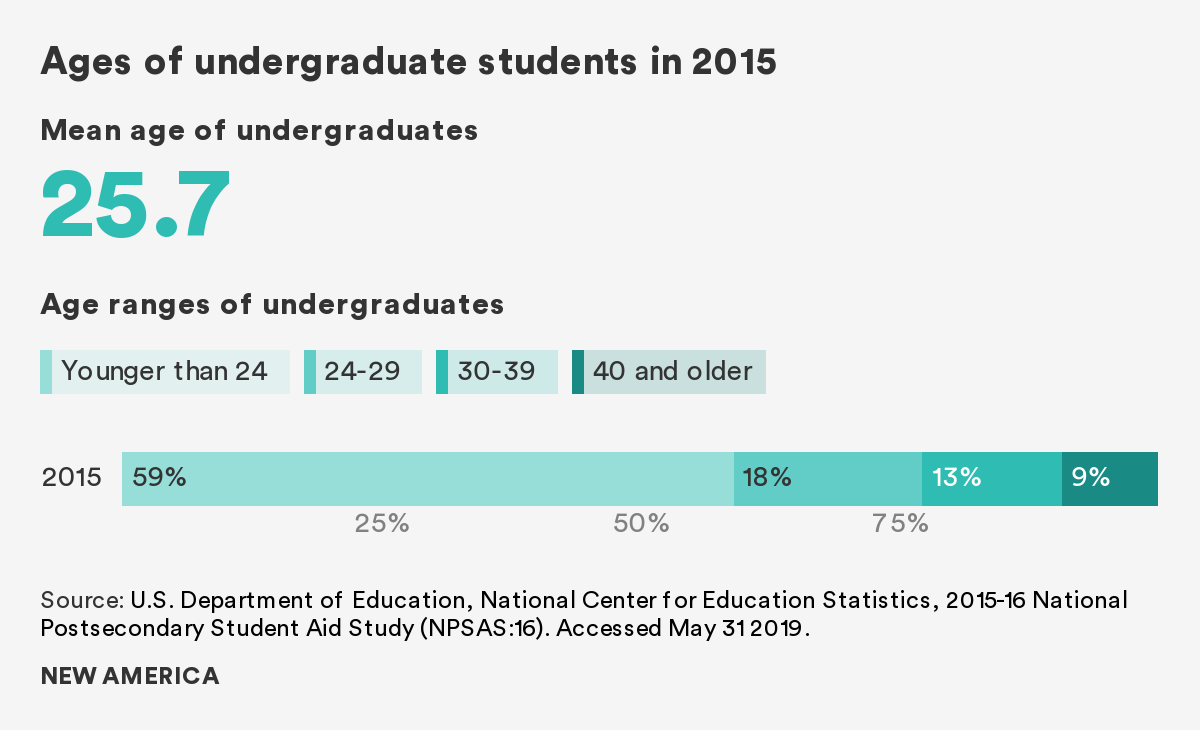
While most Americans picture a young student who enrolled in education directly after high school, the average undergraduate student is actually older than what they envision. As of 2015–2016, the average age of an undergraduate student was 26. A majority of undergraduates (59 percent) are under the age of 24. However, a significant proportion of undergraduates—41 percent—are 24 or older. In fact, nearly one in 10 undergrads is over 40. While America’s system of education after high school was built to cater to the needs of young adults, older students often have very different lives. They are more likely to work, attend part time, commute to school, and care for dependent children.10 The demographics of today’s undergraduates require colleges and universities to rethink how to target academic and financial support and how to meet the needs of students with complex lives and schedules outside the classroom.
Perception
Many Americans (42 percent) think that those who just completed an apprenticeship would earn, on average, somewhere between $25,000 and $45,000 a year. Approximately one-third (34 percent) think that the average annual salary for these individuals is somewhere between $45,000 and $65,000.
Reality
According to the U.S. Department of Labor, people who complete an apprenticeship on average earn $60,000 annually.11
Learning from experienced mentors on the job, getting paid while receiving job training, and receiving technical instruction in a classroom setting—this is what a typical apprenticeship offers its participants. Apprentices (participants of apprenticeship programs) often graduate with jobs in a related field, credentials that can help them move up the career ladder, and little to no student debt.
Efforts to expand apprenticeship have received bipartisan support since the Obama administration.12 As of 2018, there are more than 580,000 apprentices in more than 20,000 registered apprenticeship programs across the nation.13 Even though this is still a tiny number compared to the more than 20 million students in higher education, the number of new apprentices has generally followed an upward trend since 2010.
Apprenticeship is not only a workforce strategy; it is also an educational strategy. Apprenticeship can be a viable pathway to postsecondary degrees and credentials. The job-related classroom instruction, an important component of apprenticeship, usually takes place at a nearby community college, which can later lead to a certificate or an associate degree that students can “stack” on the pathway to further education.
Higher education and apprenticeship also serve overlapping populations. The average age of apprentices in the United States is 28, while the average age of today’s undergraduate is 26, which means apprentices are only slightly older than the average undergraduate student.14 With potential expansion of youth apprenticeship programs that target high school students, the age gap could narrow in the future.15
Even though apprenticeship and traditional higher education have many similarities, they are largely operated as two separate systems, with different traditions and cultures. As efforts to expand apprenticeship gain traction, it is worthwhile to direct these efforts in a way that would connect apprenticeship and degree programs at colleges and universities to improve access to both for today’s students.16
Perception
Americans are a little bit mixed about how much individuals with only an associate degree will earn. While half of them (49 percent) think that the median annual salary for such individuals ranges between $25,000 and $45,000, a third (34 percent) estimate that the number is higher, from $45,000 to $65,000.
Meanwhile, about 80 percent of Americans think that the median annual salary for those with only a bachelor's degree is $45,000 or higher: 47 percent think that the number is within the range of $45,000 and $65,000 and 32 percent think that it is higher than $65,000.
Reality
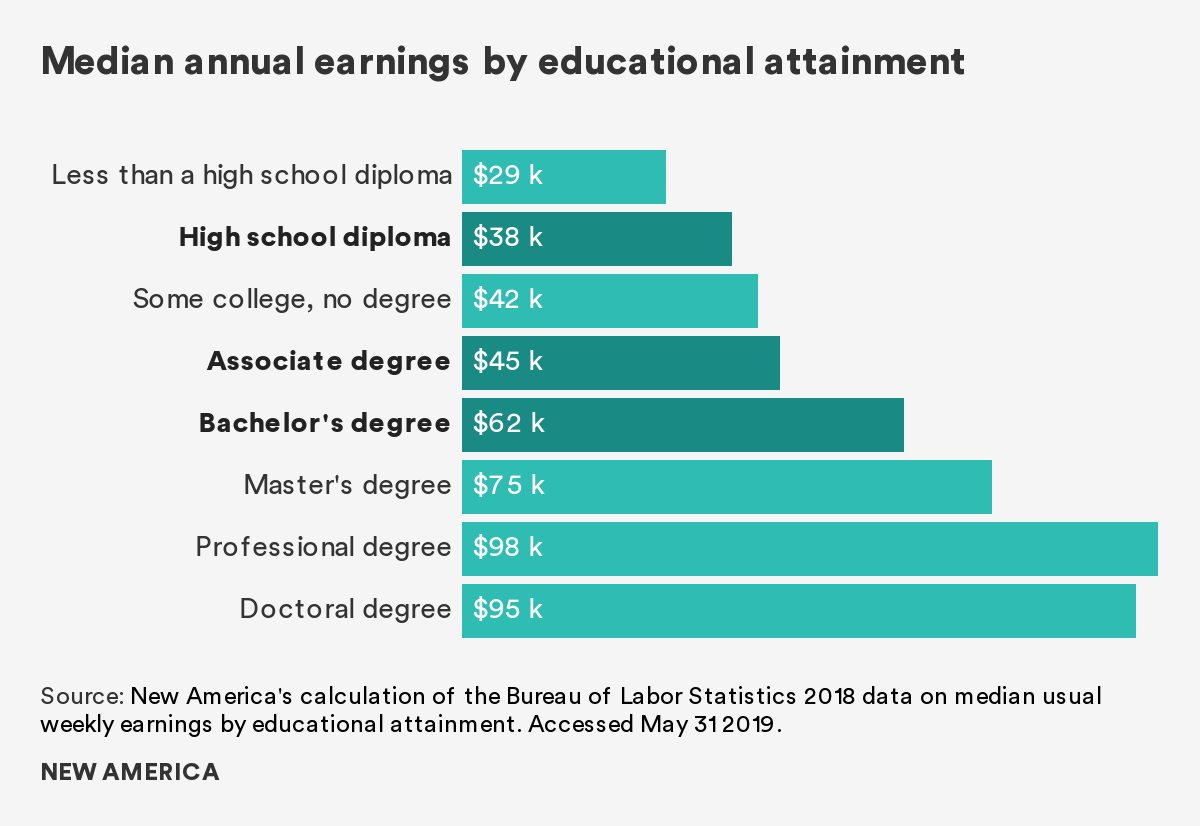
Bachelor's degrees and higher continue to offer the largest payout. According to the Bureau of Labor Statistics, in 2018 the median annual earnings of someone with an associate degree was approximately $45,000.17 However, those who had earned a bachelor's degree (with no postgraduate education) earned approximately $62,000. And someone who received a high school diploma or equivalency, and did not pursue further college education, earned about $38,000.
The payoff from a degree is clear, and, for the most part, people are better off going to college and graduating than not going at all. When exploring wage data further, however, there is a noticeably large racial and gender wage gap that persists despite education level.18 For women, Black individuals, and Latinx individuals, it is deeply important to earn a degree, but a bachelor's degree or more does not financially pay off as well as it does for men, whites, and Asian Americans. The magnitude of the wage gap between whites and Asian Americans and their Black and Latinx counterparts grows larger for those who have a bachelor’s degree or above.
The reasons behind the racial and gender wealth gaps are complex, but the disparity exists, in part, because of labor market discrimination and institutionalized racism.19 Another part of the equation, however, is that not all degrees are created equal. Data have shown that labor-market outcomes vary widely based on the specific programs and institutions students attend, to an extent due to the quality of the college or program. Unfortunately, many of those programmatic and institutional disparities are masked by national data. Better data on the outcomes of program and college alumni, particularly in post-college earnings, could offer students a clearer, more accurate look at college outcomes before they decide whether and where to enroll in school and what to major in. And it would provide policymakers with the information they need about how institutions are performing with taxpayer investment.
Student Debt
Perception
The perception that student loans make up the largest source of consumer debt dominates, no matter how we asked the question.
When asked what they think is the largest source of consumer debt, a majority of Americans (47 percent) think that is student loan debt, followed by credit card debt (27 percent), mortgages/home equity loans (24 percent), and auto loans (2 percent).
When the question was asked in the opposite direction—what the smallest source of consumer debt is—61 percent say auto loans, 18 percent say credit cards, 13 percent say mortgages/home equity loans, and only 6 percent say student loans.
Reality
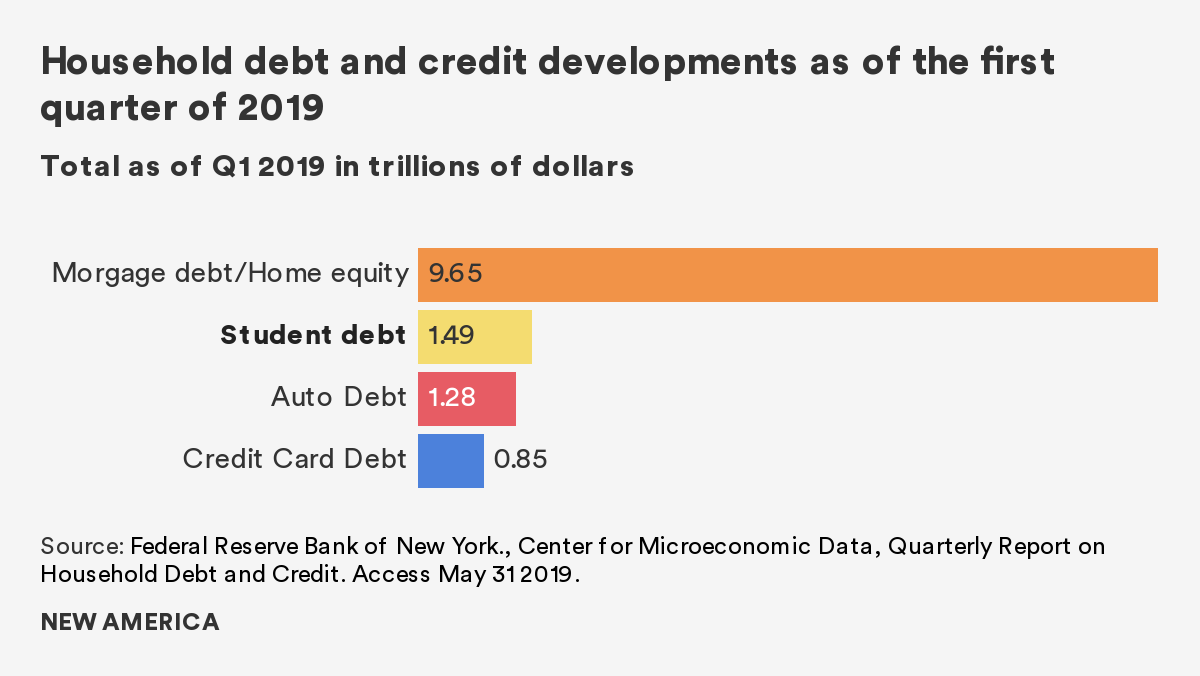
In fact, the largest source of consumer debt, by far, are mortgages/home equity loans, which account for approximately $9.7 trillion, distantly followed by student loans ($1.5 trillion), auto loans ($1.3 trillion), and credit cards ($848 billion).20
The growth of student loan debt over the past decade has been ringing alarm bells, spurring multiple headlines about a student debt crisis, and causing 2020 Democratic presidential hopefuls, such as Sen. Elizabeth Warren (D-Mass.), to propose canceling existing student loan debt and refinancing loans at lower rates. Unfortunately, calls for debt cancellation and loan refinancing have been found to be regressive, since those who borrow for their education tend to be middle- and upper-income. Research from Adam Looney at the Brookings Institute, for example, showed that Senator Warren’s debt cancellation plan would result in 65 percent of the benefit accruing to Americans in the top two income quintiles.21 Our own research has shown that student loan refinancing would only save households, on average, $8 on monthly payments, and those in the highest income quintile would receive the largest savings ($10/month) compared with those in the lowest quintile ($6/month).22 Given that many states cannot easily raise revenue and must balance their budgets, it is important to target the benefit to the neediest families.
In the aggregate, student loans are not a crisis, per se. Those who graduate tend to accrue the most debt, especially those who go on for graduate education, but they also tend to reap the economic rewards from these degrees and can pay their debt back. For those unable to afford their current monthly payment, there are several income-driven repayment options that allow borrowers of federal student loans to only pay based on a fraction of their discretionary incomes (usually 10 to 15 percent) and receive forgiveness after 20 to 25 years.
But a few demographics are experiencing a true student loan crisis: Black borrowers and those who borrow but do not complete their degree. Judith Scott-Clayton of Brookings has projected that up to 70 percent of Black borrowers may default on their student loans.23 For those who borrow but do not complete a degree, the Federal Reserve found around 44 percent fell delinquent, compared to just 11 percent of bachelor's degree earners.24 Any approach to reforming student loans and repayment should target these borrowers, including improving higher education financing so they are less reliant on borrowing for education in the first place.
Perception
Overall, Americans think that most undergraduate students in associate or bachelor's degree programs borrow, but they are mixed about the exact borrowing rate. A majority (56 percent) think that more than 50 percent borrow, with nearly 40 percent that say the borrowing rate is between 50 and 75 percent. At the same time, a significant number (43 percent) think that the borrowing rate is less than 50 percent, with more than 30 percent who say between 25 and 50 percent of undergraduate students borrow.
Reality
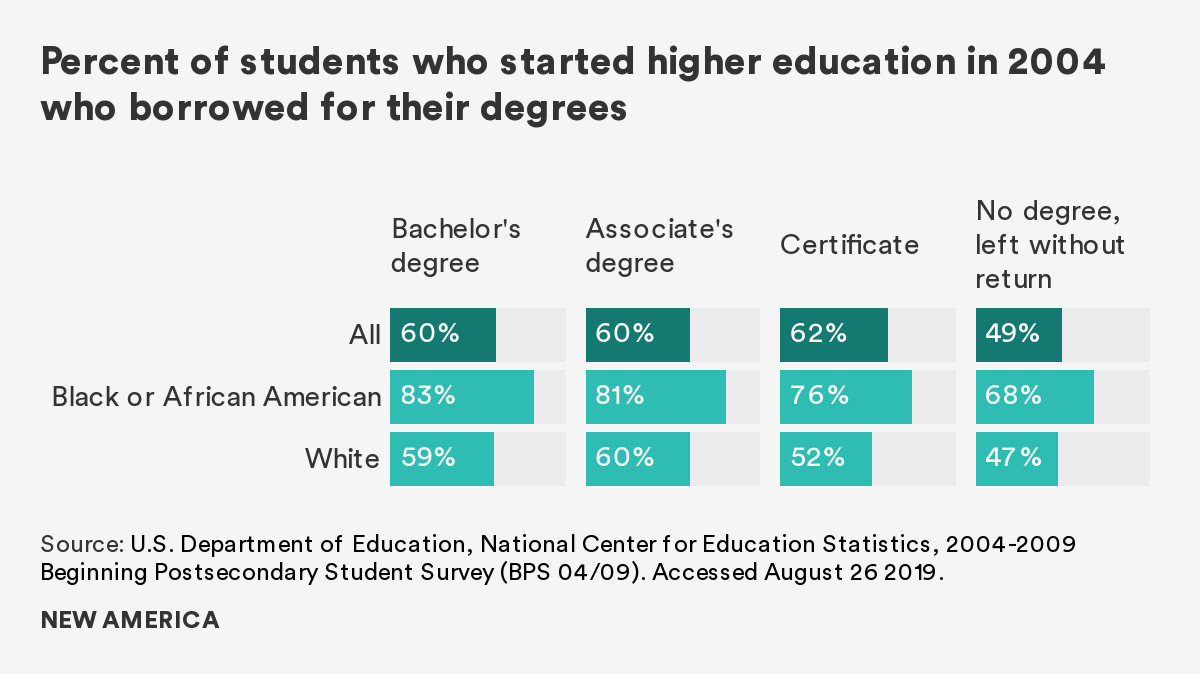
The number of undergraduate students financing their degrees with loans has grown since 1996 and only recently began to level off.25 A majority of students (60 percent) who started higher education in 2003-2004 borrowed for their associate or bachelor’s degrees.26 Additionally, 30 percent of those who started in 2003-2004 dropped out without a degree, and half of those who dropped out borrowed.27 For Black students who started in 2003-2004, approximately 80 percent borrowed for their associate and bachelor’s degrees, compared to around 60 percent of white students.28 An outcome that will likely perpetuate the wealth gap between white families and Black families.29
Perception
A large share of Americans (44 percent) think that the average student loan debt of a recent graduate from a bachelor's degree program exceeds $40,000. Only 11 percent think that the number is $20,000 or less, 20 percent think that it is between $20,000 and $30,000, and 25 percent say between $30,000 and $40,000.
Reality
The average student debt at graduation for the class of 2017 at public and private non-profit institutions was $28,650, compared to $39,900 for graduates of for-profit institutions, considering both federal and private sources of debt.30
Although the Department of Education does not track student loan amounts by race, other research has found stark differences in the amount that students borrow by race. Studies have found, for example, that Black students, on average, graduate with higher levels of debt, even when they have similar family income levels as white students.31 This disparity grows dramatically after graduation: Four years after graduation, Black students, on average, owe $25,000 more than white students.32 Initiatives to help student loan borrowers must prioritize supporting borrowers of color, particularly Black students, who typically bear the greatest burden.33
Perception
Many Americans (46 percent) think that more than 30 percent of student loans will end up in default. Only 23 percent think that the default rate is less than 20 percent, and 27 percent think that it is between 20 and 30 percent.
Reality
Student loans are classified as “in default” when a student fails to make a minimum payment for 270 days. Over one million students every year default on their loans:34 27 percent of borrowers who started higher education in 2004 defaulted on their loans 12 years later, and this rate is projected to increase to nearly 40 percent by 2023.35 These rates vary significantly across students and institutions: Black students who graduate with a bachelor's degree are five times more likely to default than white graduates, and nearly half of students who attend a for-profit institution defaulted within 12 years.36
When borrowers default, a multitude of financially devastating consequences can happen. Two of the most common consequences include wage garnishment and treasury offset, where the federal government applies the borrower’s tax return to the loan balance. Additionally, when a loan enters default, it drops the borrower’s credit score, resulting in difficulties obtaining other loans, getting a credit card, or being approved to rent a house or apartment. Although automatic payroll deductions should be carefully designed to avoid further harming distressed borrowers, automatically enrolling delinquent borrowers in an income-based repayment plan could greatly lower their payments and help protect students from the long-term harm of defaulting.37
Citations
- See: “Table 326.10. Graduation rate from first institution attended for first-time, full-time bachelor's degree- seeking students at 4-year postsecondary institutions, by race/ethnicity, time to completion, sex, control of institution, and acceptance rate: Selected cohort entry years, 1996 through 2011,” U.S. Department or Education, National Center for Education Statistics, accessed August 11, 2019, source; and “Table 326.20. Graduation rate from first institution attended within 150 percent of normal time for first-time, full-time degree/certificate-seeking students at 2-year postsecondary institutions, by race/ethnicity, sex, and control of institution: Selected cohort entry years, 2000 through 2014,” U.S. Department of Education, National Center for Education Statistics, accessed August 11, 2019, source
- Clare McCann and Amy Laitinen, College Blackout: How the Higher Education Lobby Fought to Keep Students in the Dark (Washington, DC: New America, 2014.
- Amy Laitinen, “Defending a College with a 0 Percent Graduation Rate,” EdCentral (Blog), March 31, 2013, source
- Clare McCann and Amanda Janice Roberson, “New Legislation Would Provide Students Key Information About College Outcomes,” EdCentral (Blog), March 15, 2019, source
- “Table 326.10.Graduation rate from first institution attended for first-time, full-time bachelor's degree- seeking students at 4-year postsecondary institutions, by race/ethnicity, time to completion, sex, control of institution, and acceptance rate: Selected cohort entry years, 1996 through 2011,” U.S. Department of Education, National Center for Education Statistics, accessed August 11, 2019, source
- U.S. Department of Education, “Focusing Higher Education on Student Success,” July 27, 2017, source
- New America analysis of U.S. Department of Education NPSAS: 16 data, source
- New America analysis of U.S. Department of Education NPSAS: 16 data, source
- New America analysis of U.S. Department of Education NPSAS: 16 data, source
- Jovita M. Ross-Gordon, Research on Adult Learners: Supporting the Needs of an Adult Population that is No Longer Nontraditional (Washington, DC: Association of American Colleges and Universities, 2011).
- U.S. Department of Labor, Workforce System and Apprenticeship Partners (Washington, DC: U.S. Department of Labor, ND).
- Robert I. Lerman, “Bipartisan Support Emerges for Expanding Apprenticeship,” UrbanWire (blog), February 26, 2015, source
- “Registered Apprenticeship National Results Fiscal Year (FY) 2018 (10/01/2018 to 9/30/2018),” U.S. Department of Labor, accessed August 11, 2019, source
- Keith L. Rolland, “Apprenticeships and Their Potential in the U.S.,” Cascade 90 (Winter 2016), source
- Brent Parton, Youth Apprenticeship in America Today: Connecting High School Students to Apprenticeship (Washington, DC: New America, 2017).
- Mary Alice McCarthy, Iris Palmer, and Michael Prebil, Eight Recommendations for Connecting Apprenticeship to Higher Education (Washington, DC: New America, 2017).
- “Unemployment Rates and Earnings by Educational Attainment,” U.S. Department of Labor, Bureau of Labor Statistics, accessed August 11, 2019, source
- “Median Weekly Earnings by Educational Attainment in 2014,” U.S. Department of Labor, Bureau of Labor Statistics, accessed August 11, 2019, source
- Rachel Fishman, The Wealth Gap PLUS Debt: How Federal Loans Exacerbate Inequality (Washington, DC: New America, 2018).
- Federal Reserve Bank of New York, “Total Household Debt Rises for 19th Straight Quarter, Now Nearly $1 Trillion Above Previous Peak,” May 14, 2019, source
- Adam Looney, How Progressive is Senator Warren’s Loan Forgiveness Proposal? (Washington, DC: Brookings Institute, 2019).
- Kim Dancy and Alexander Holt, In the Interest of Few: The Regressive Benefits of Student Loan Refinancing (Washington, DC: New America, 2017).
- Judith Scott-Clayton, The Looming Student Default Crisis is Worse Than We Thought (Washington, DC: Brookings Institute, 2018).
- Alvaro Mezza and Kamila Sommer, A Trillion Dollar Question: What Predicts Student Loan Default? (Washington, DC: Board of Governors of the Federal Reserve System, 2015).
- Sandy Baum, Jennifer Ma, Matea Pender, and CJ Libassi, Trends in Student Aid 2018 (Washington, DC: The College Board, 2018).
- New America analysis of U.S. Department of Education BPS: 2004/2009 data, source
- Ibid.
- Ibid.
- Jason N. Houle and Fenaba R. Addo, “Racial Disparities in Student Debt and the Reproduction of the Fragile Black Middle Class,” Sociology of Race and Ethnicity (August 2, 2018).
- Diane Cheng and Veronica Gonzalez, Student Debt and the Class of 2017 (Oakland, CA: The Institute for College Access and Success, 2018).
- Michal Grinstein-Weiss, Dana C. Perantie, Samuel H. Taylor, Shenyang Guo, and Ramesh Raghaven, “Racial Disparities in Education Debt Burden Among Low- and Moderate-Income Households,” Children and Youth Services Review 65 (June 2016), 166-174.
- Judith Scott-Clayton and Jing Li, Black-White Disparity in Student Loan Debt Nearly Triples After Graduation (Washington, DC: Brookings Institute, 2016).
- Amy Laitinen, Rachel Fishman, and Clare McCann, Recommendations to Support Borrowers of Color (Washington, DC: New America, 2019).
- Kristin Blagg, Underwater on Student Debt: Understanding Consumer Credit and Student Loan Default (Washington, DC: The Urban Institute, 2018).
- Judith Scott-Clayton, The Looming Student Loan Default Crisis is Worse Than We Thought (Washington, DC: Brookings Institute, 2018).
- Judith Scott-Clayton, The Looming Student Loan Default Crisis is Worse Than We Thought (Washington, DC: Brookings Institute, 2018).
- New America, Young Invincibles, and the National Association of Student Financial Aid Administrators, The Case for Payroll Withholding: Preventing Student Loan Defaults with Automatic Income-Based Repayment (Washington, DC: New America, 2014).