Table of Contents
Graphics and Data Visualizations
Figure 1. Major hazards in the Indo-Pacific region

Figure 2. Disaster impacts in the Indo-Pacific region (1990-2017)
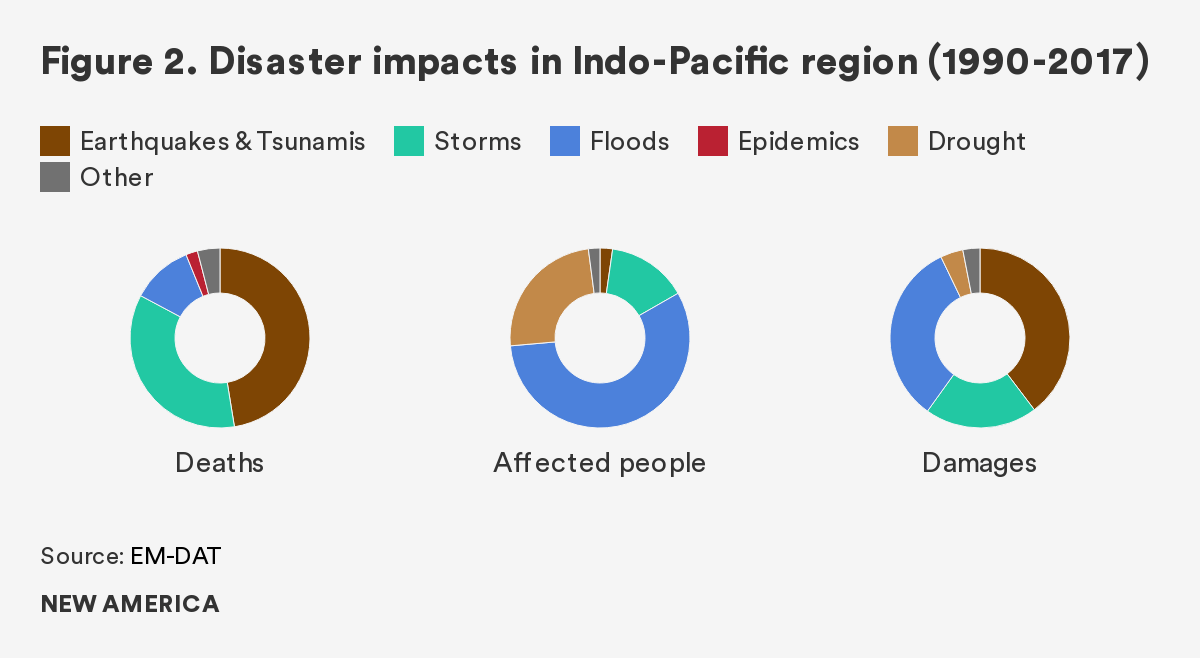
Figure 3. The majority of disaster deaths were caused by a few major events
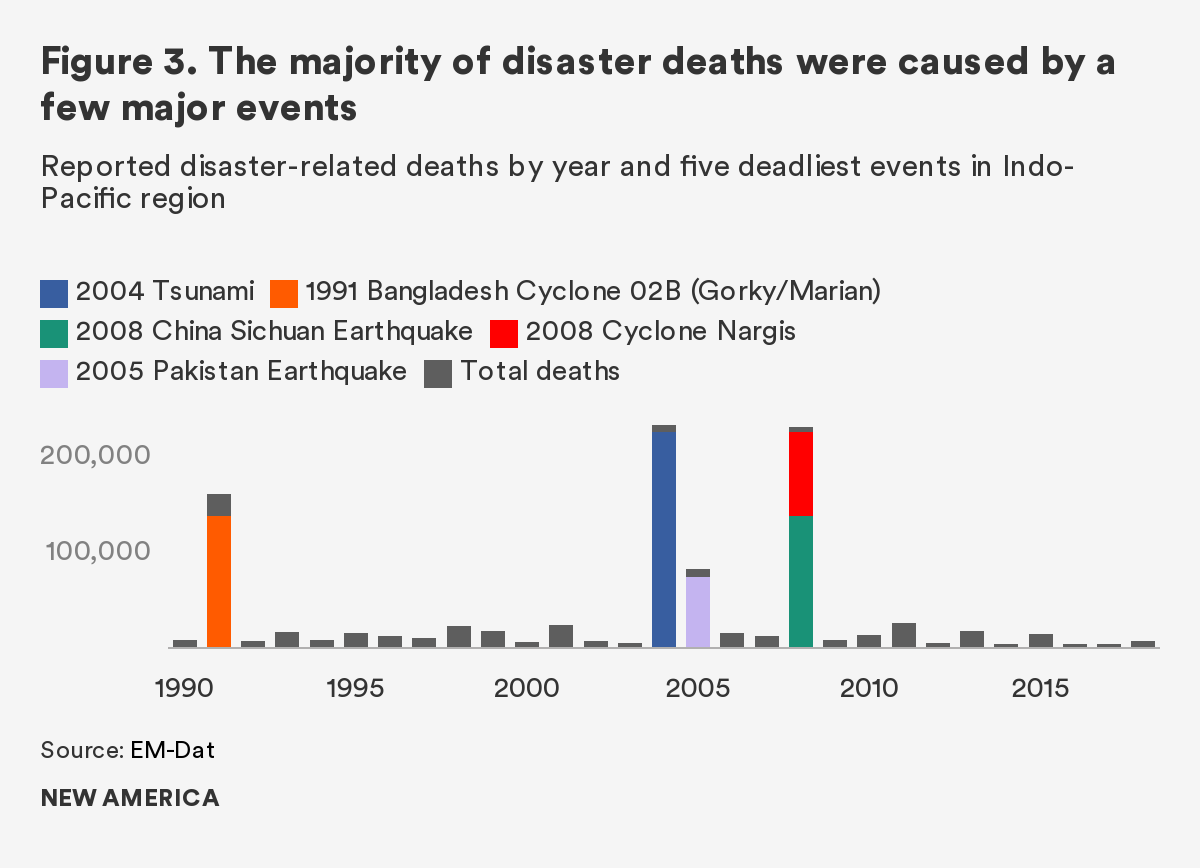
Figure 4. By 2100, sea levels could rise .5-2.5 meters (2-8 feet)
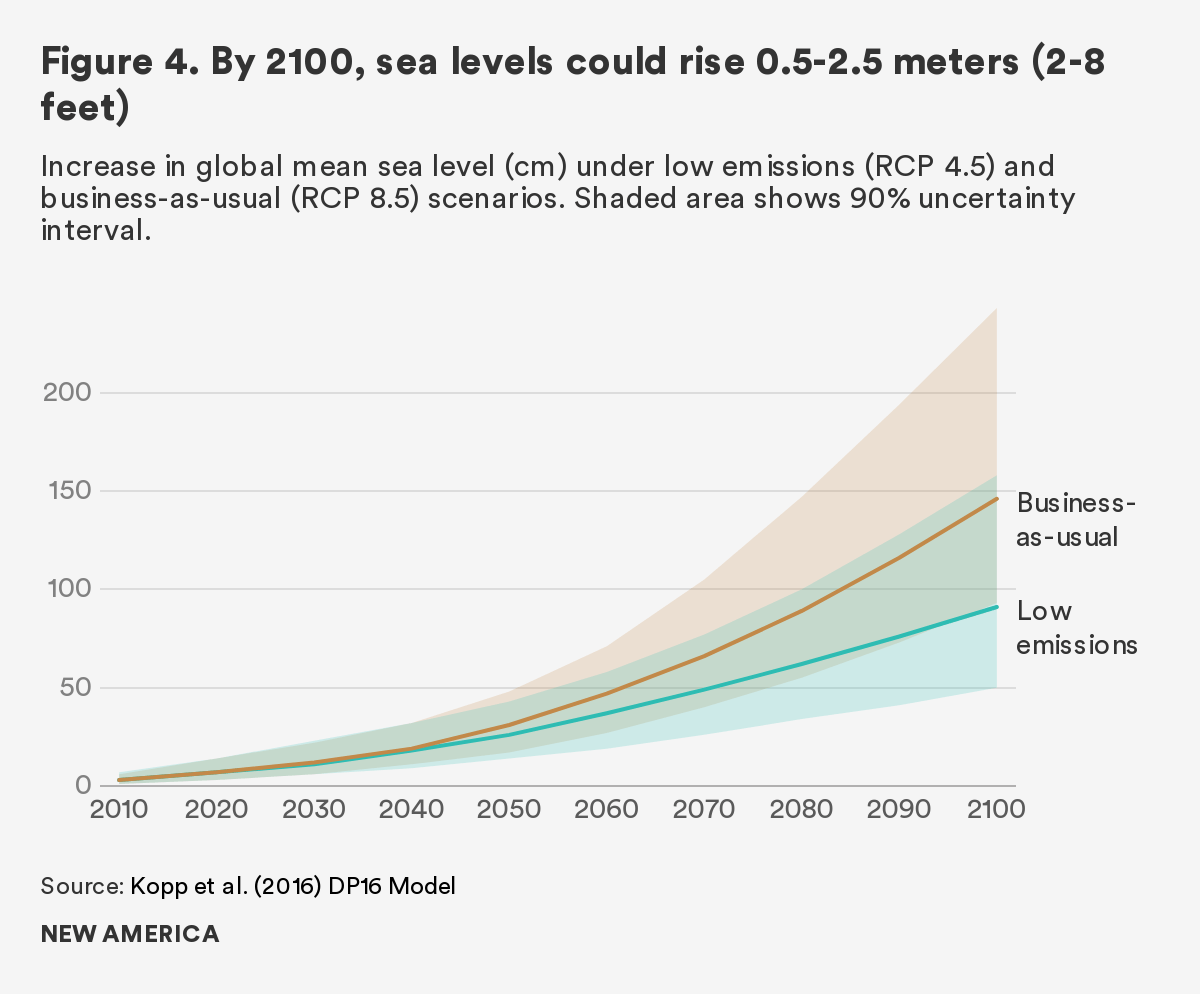
Figure 5. Though the total number of storms has not increased...
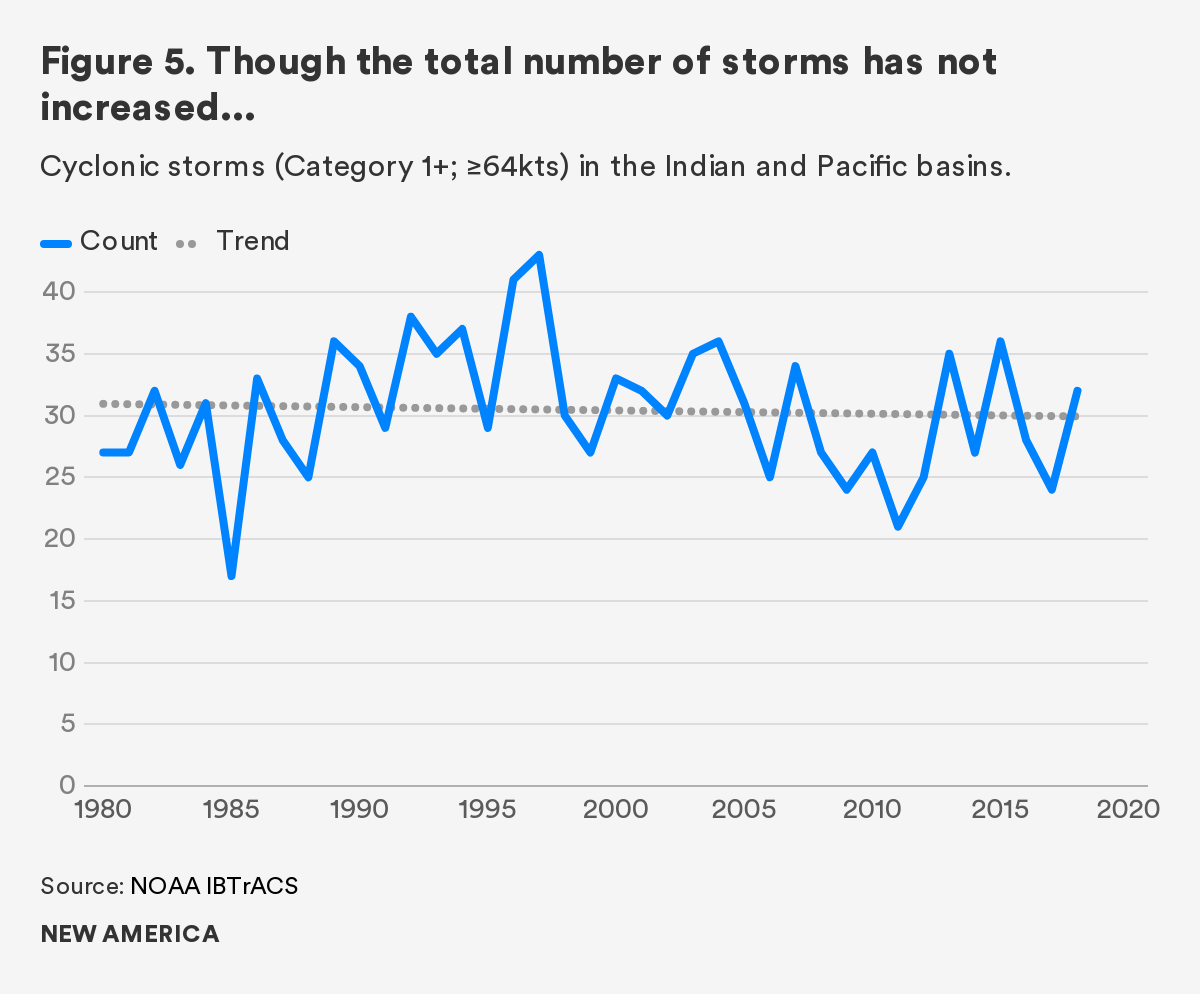
Figure 6. Severe tropical cyclones have become more frequent in recent years
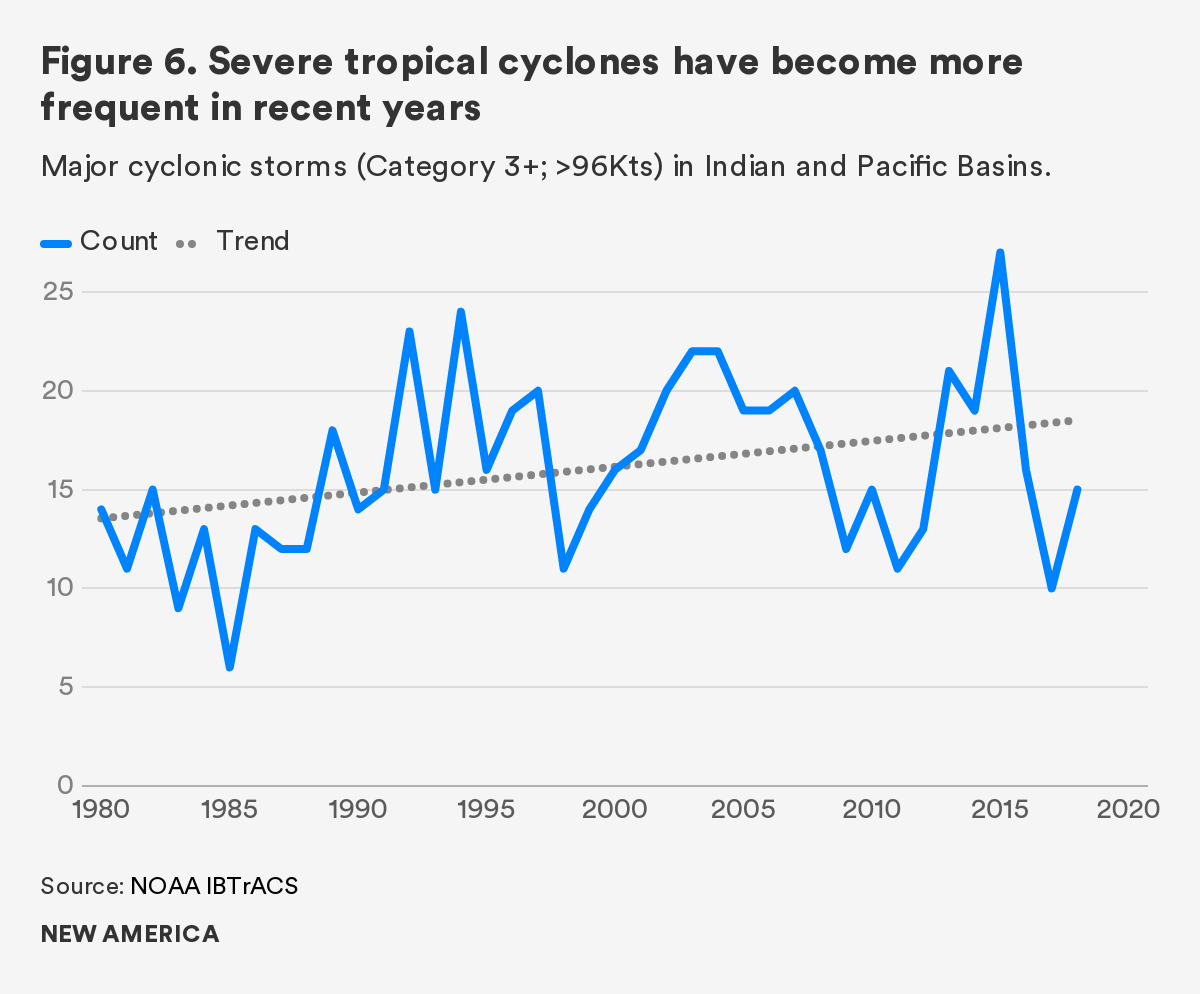
Figure 7. Ten Indo-Pacific countries with the greatest projected increase in precipitation
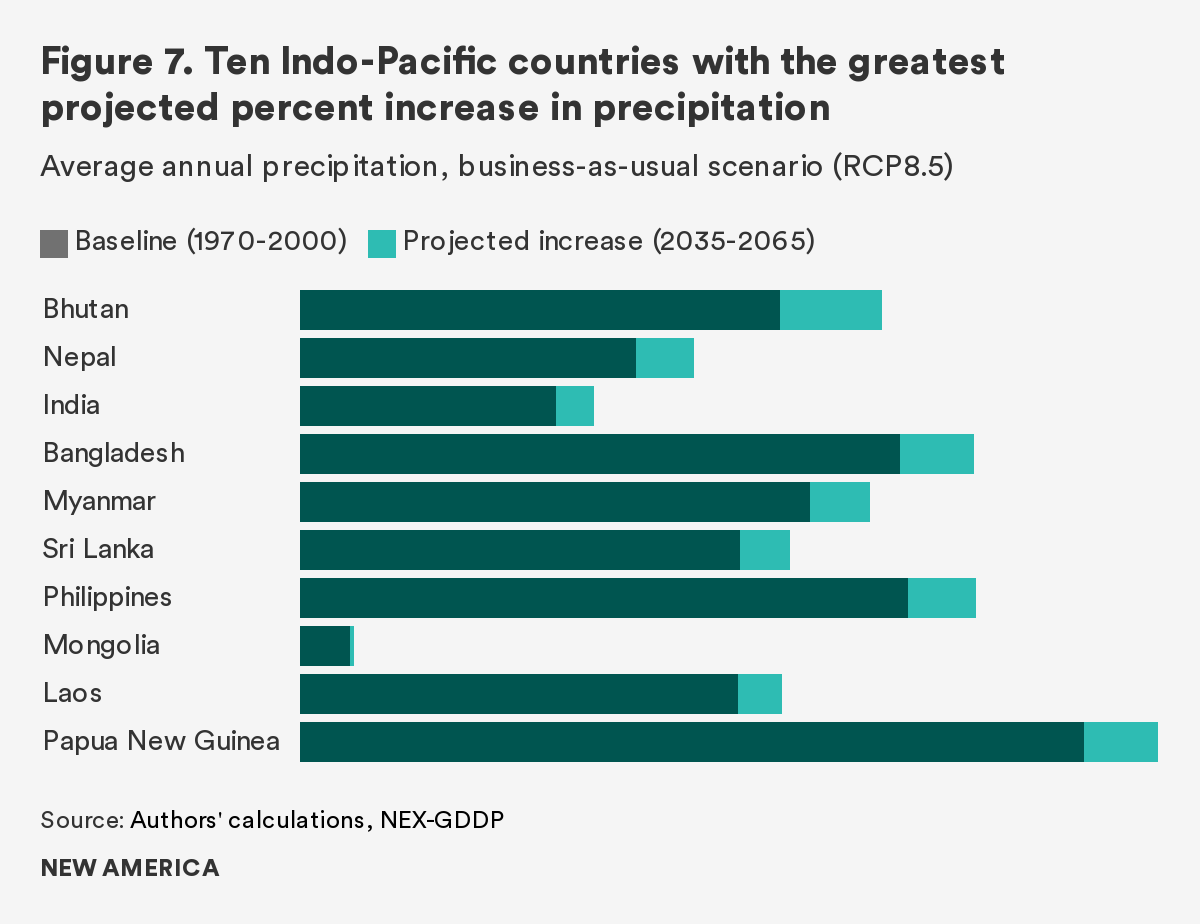
Figure 8. Ten Indo-Pacific countries with the greatest projected percent increase in extreme precipitation
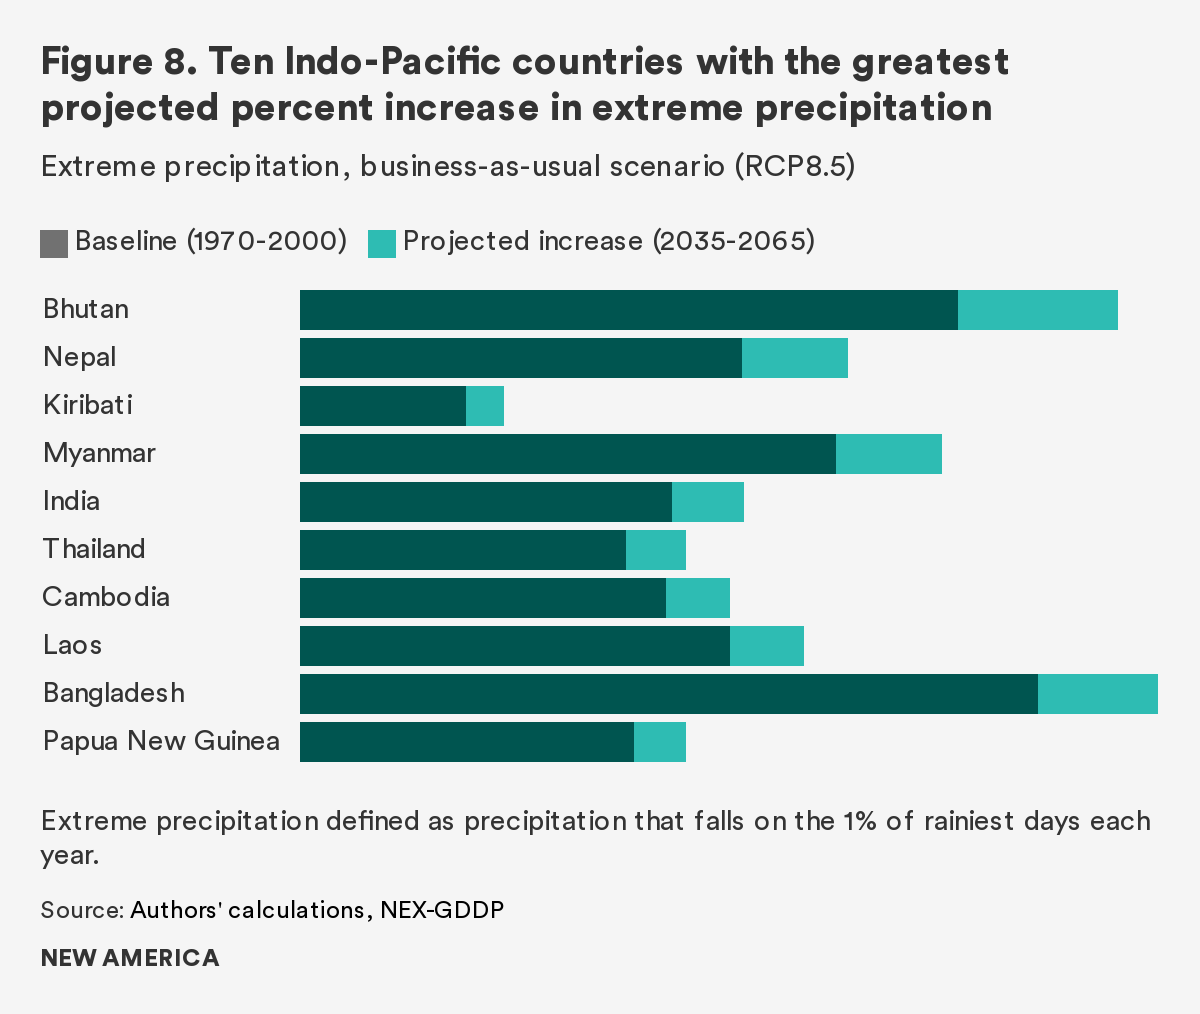
Figure 9. Flood risk is projected to increase across the Indo-Pacific region
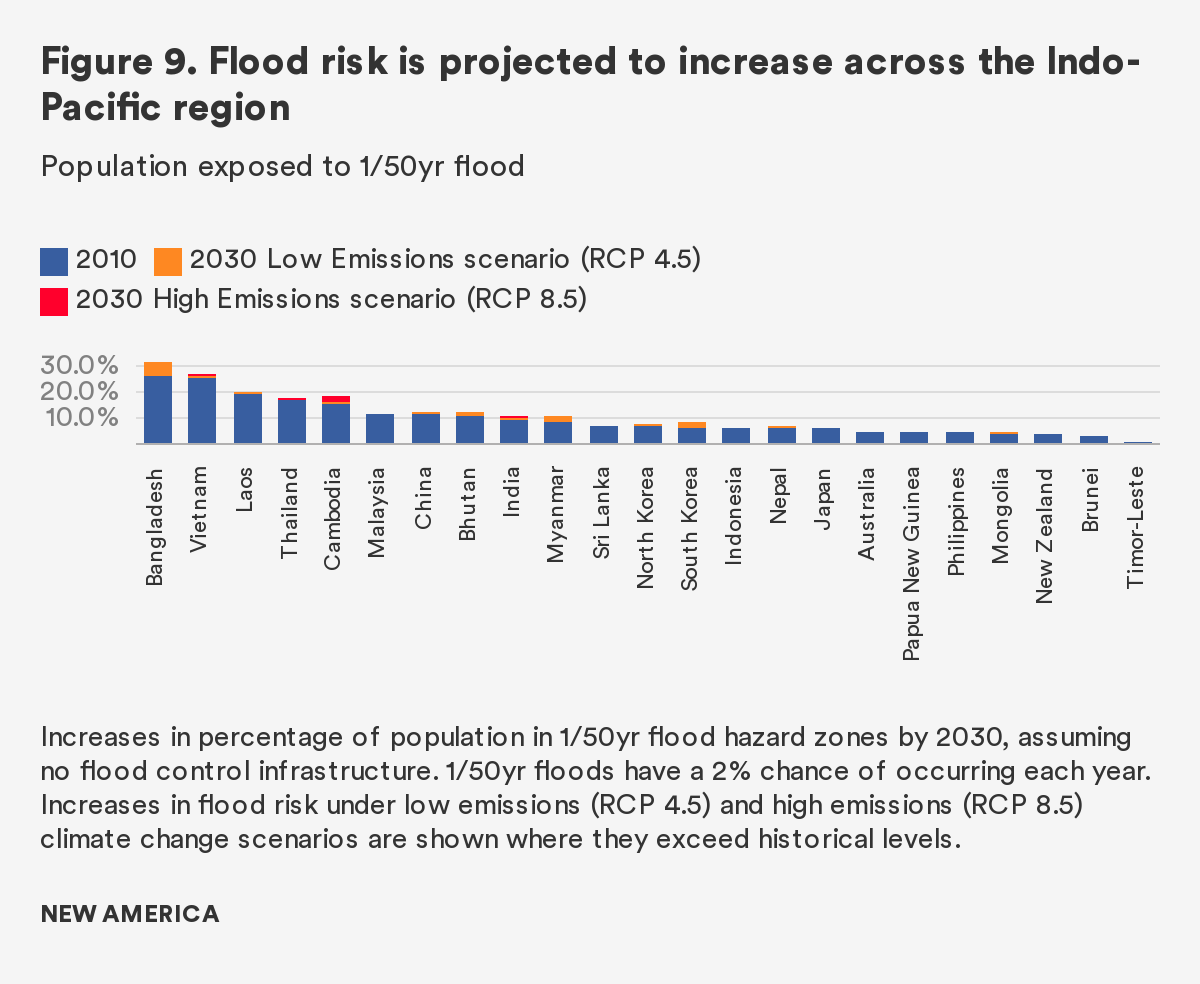
Figure 10. Megacities at risk in the Indo-Pacific region
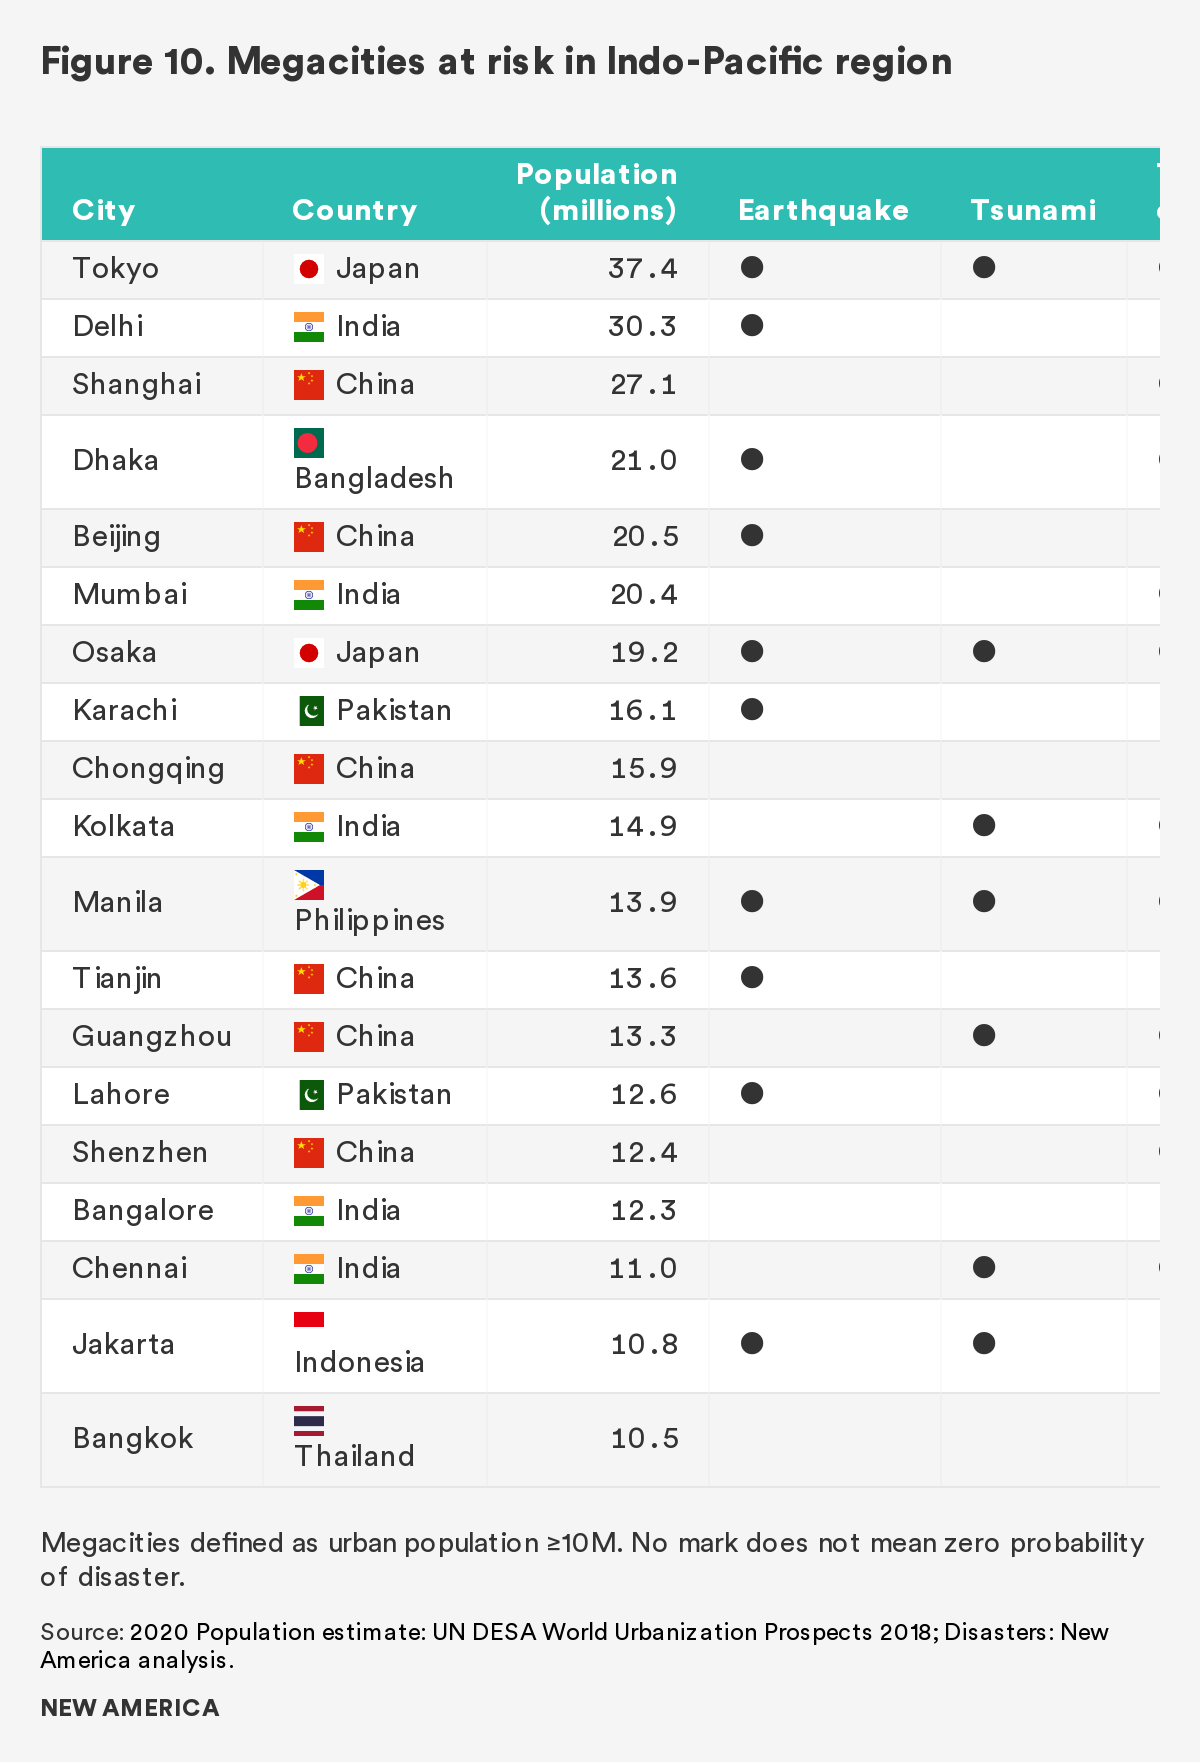
Figure 11. Overview of U.S. Humanitarian and Disaster Relief Missions 1991-2018
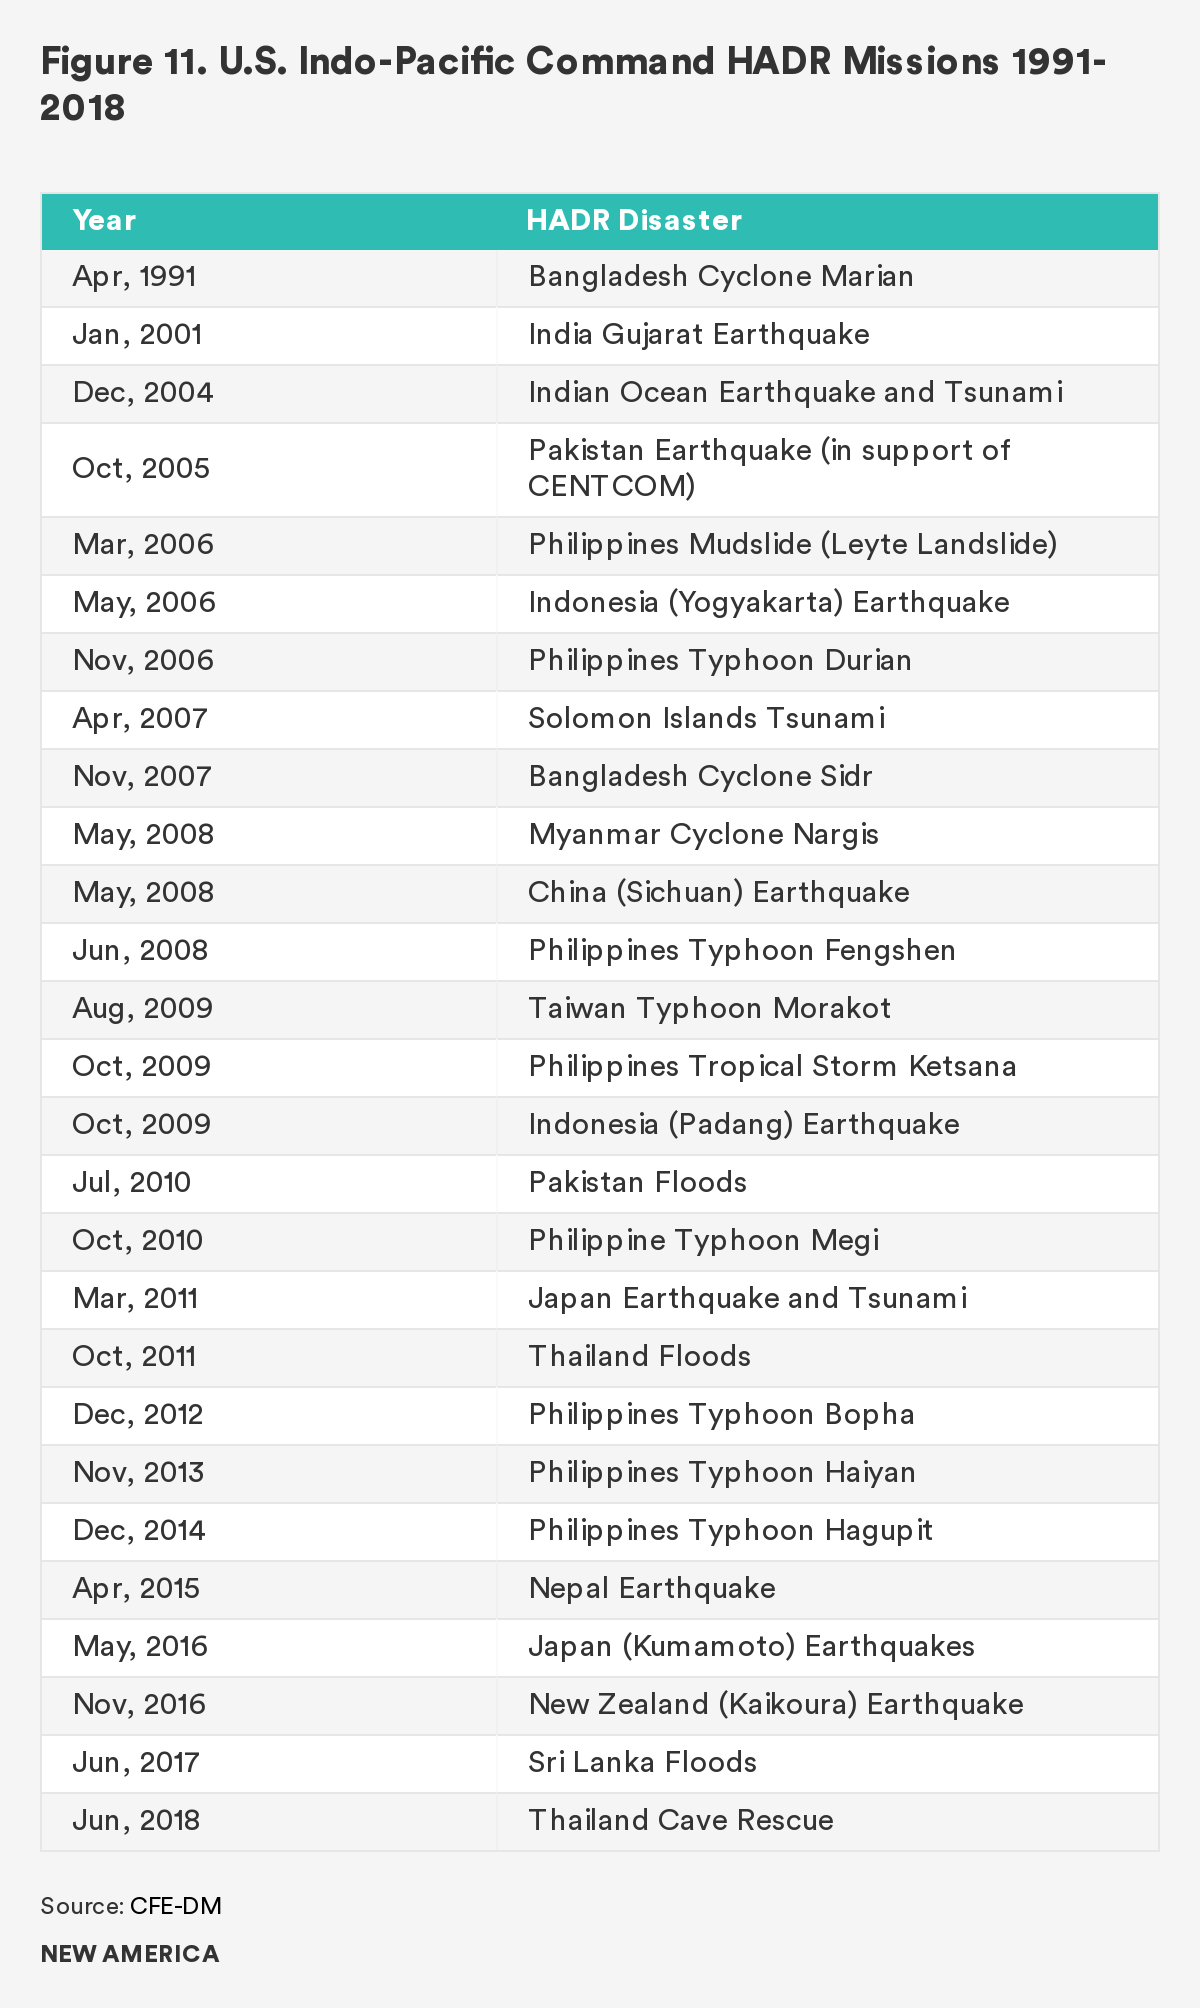
Figure 12. HADR missions were launched in response to most of the deadliest disaster in the Indo-Pacific region
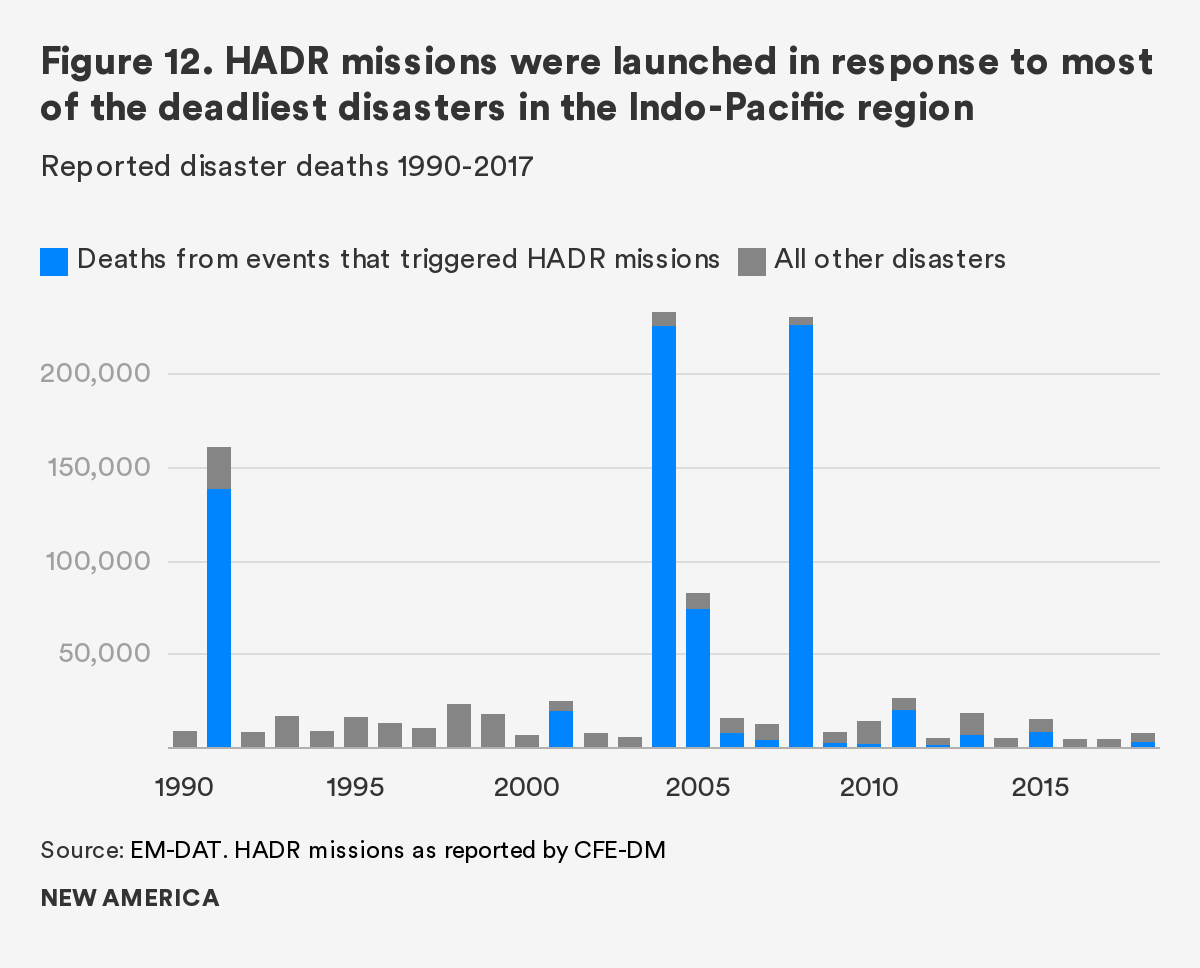
Figure 13. Military disaster relief depends on coordination before, during, and after disasters
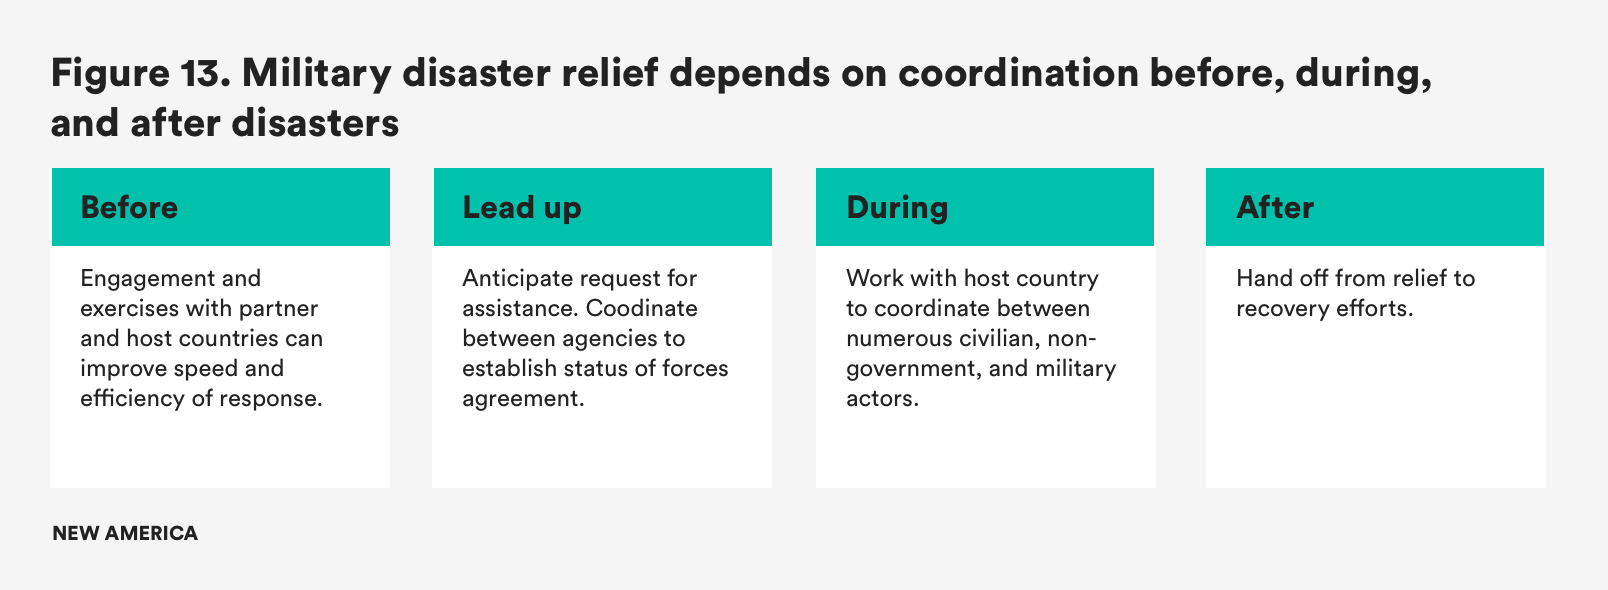
Figure 14. Standard requests for critical HADR missions
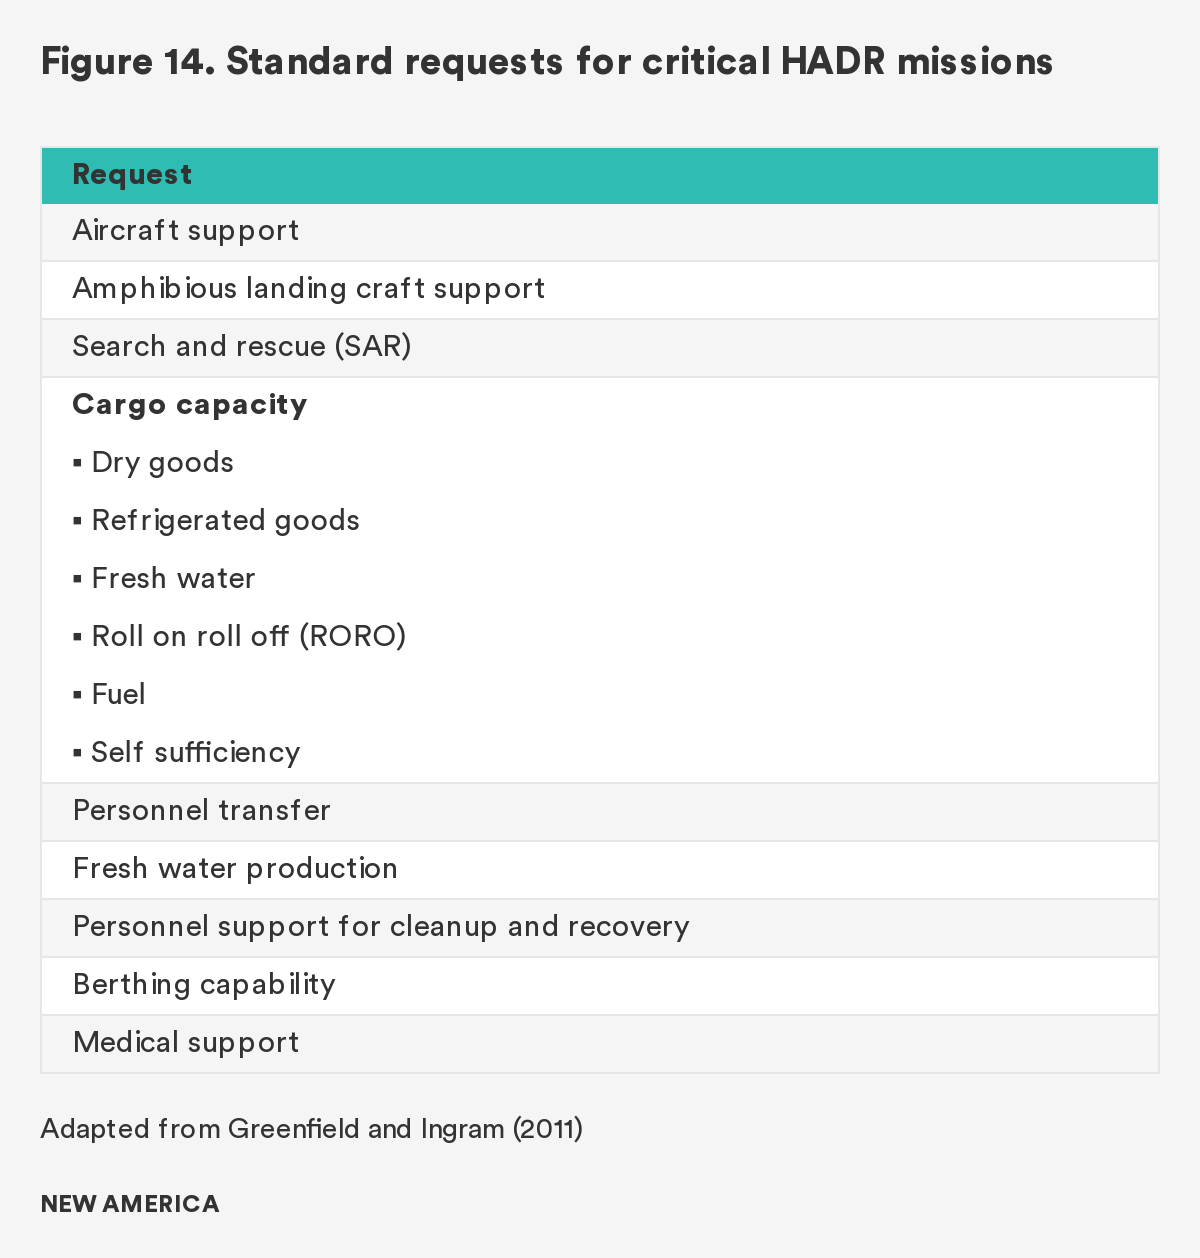
Figure 15. Overview of U.S. Indo-Pacific Command assets deployed for HADR missions (1991-2018)
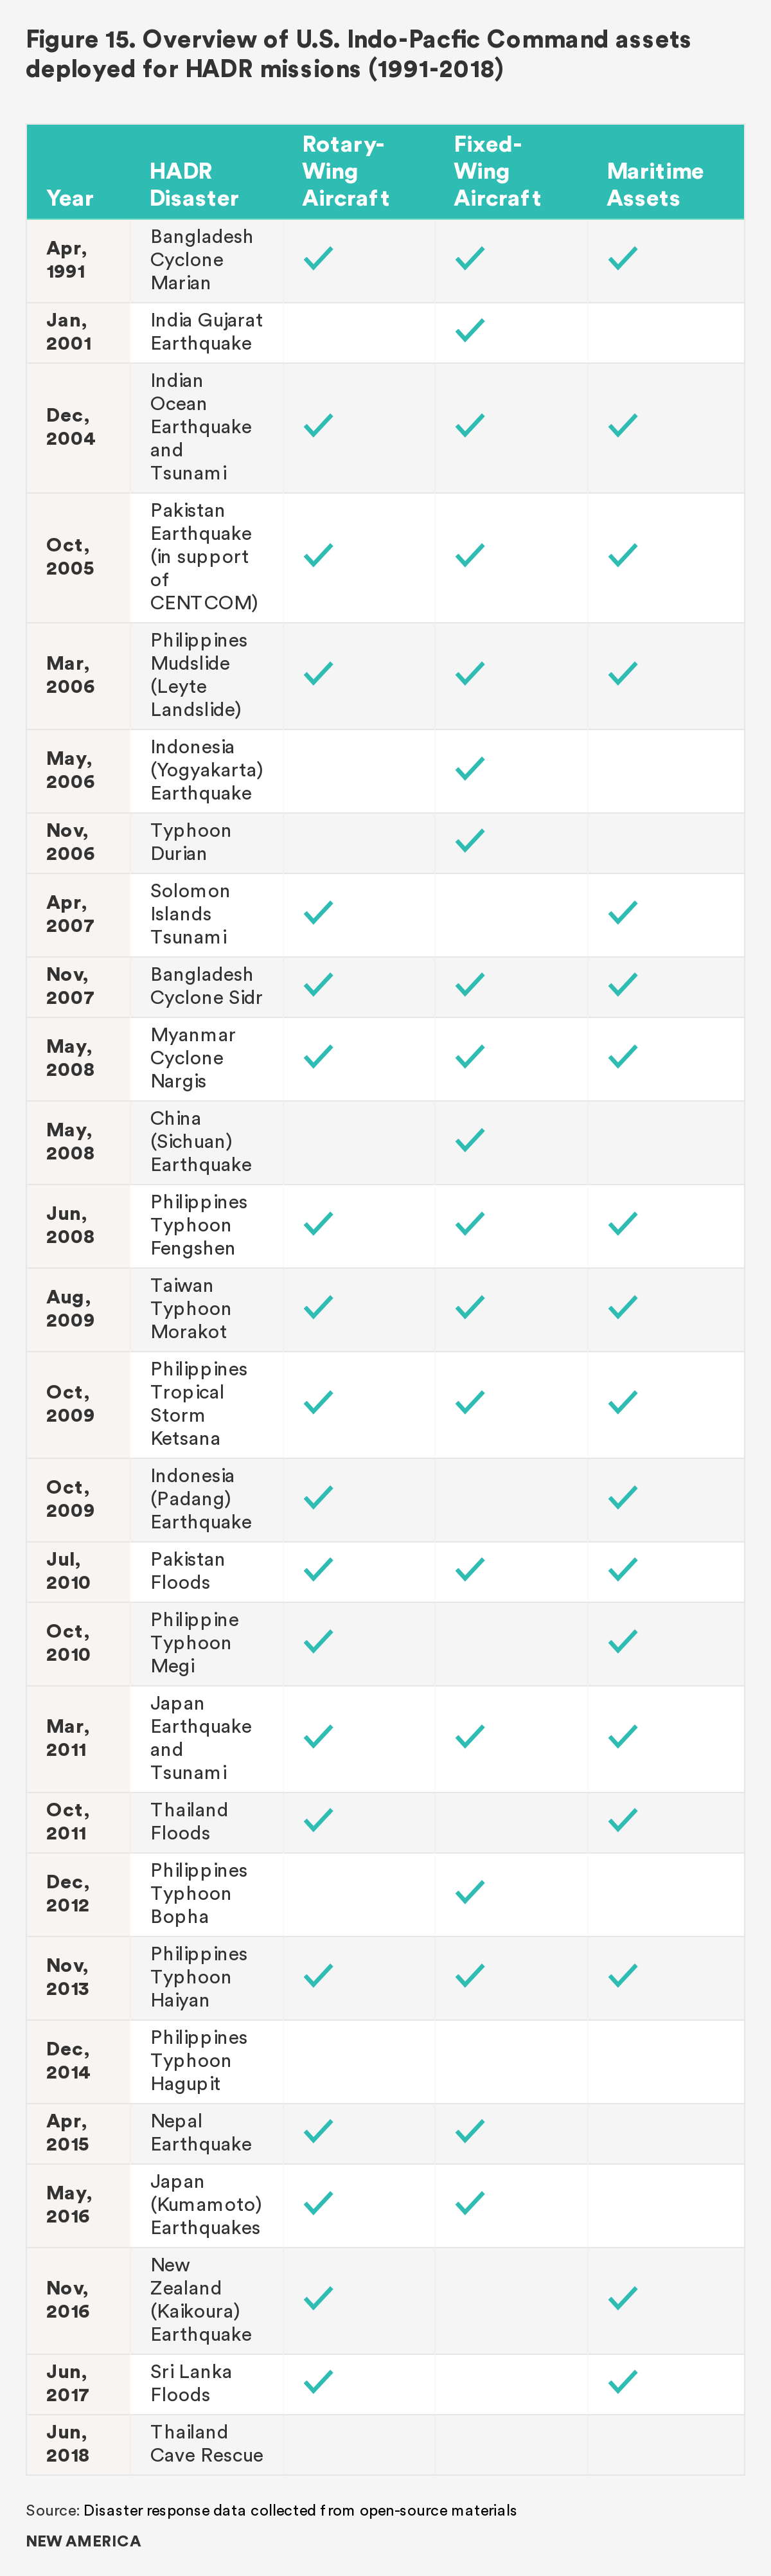
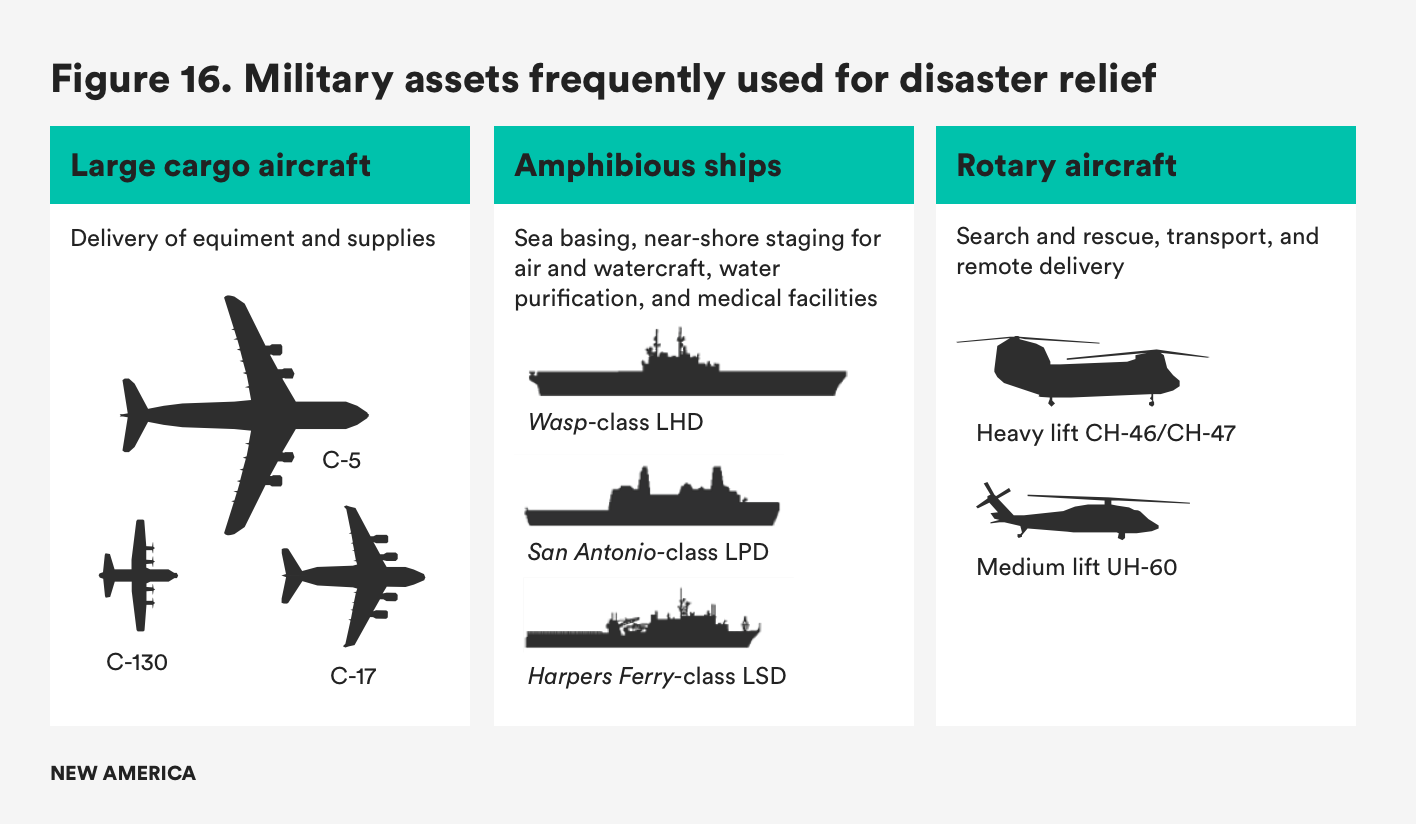
Figure 16. Military assets frequently used for disaster relief
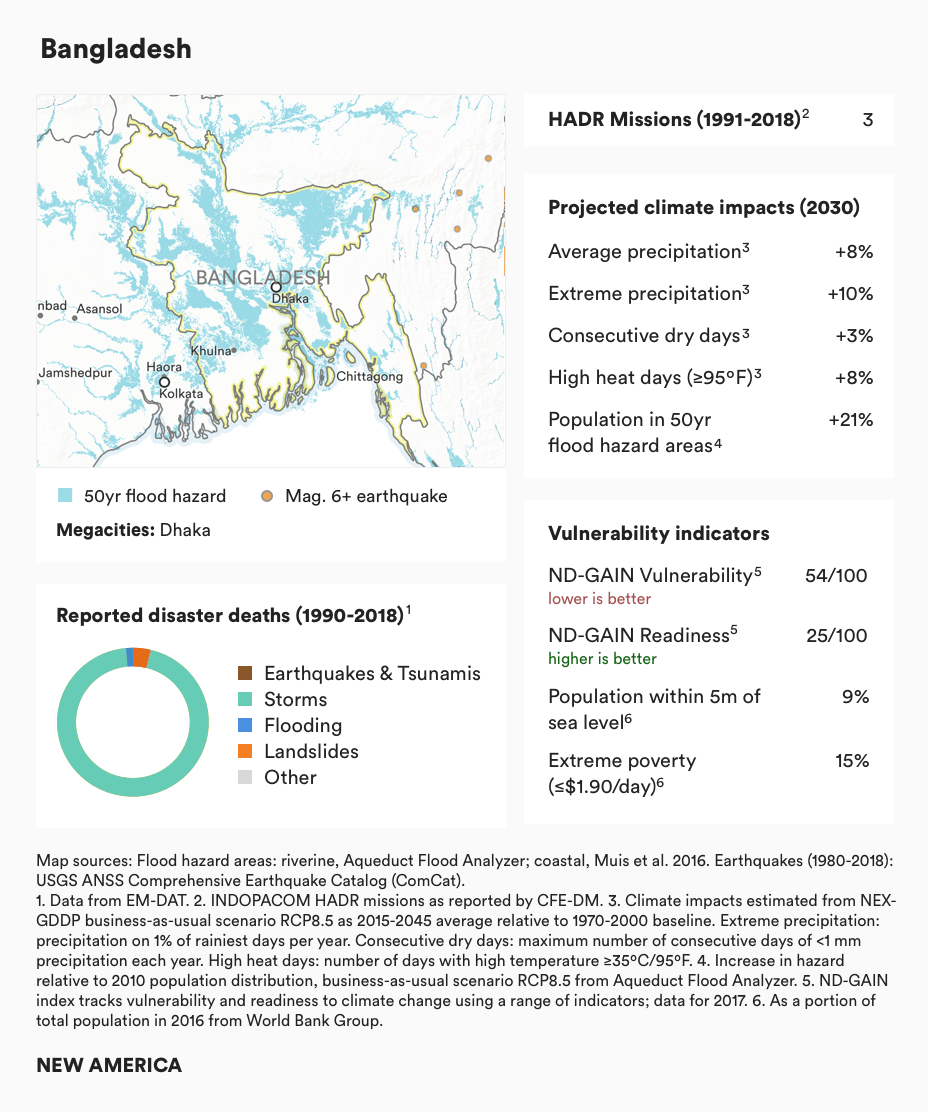
Concentrations of Risk: Bangladesh
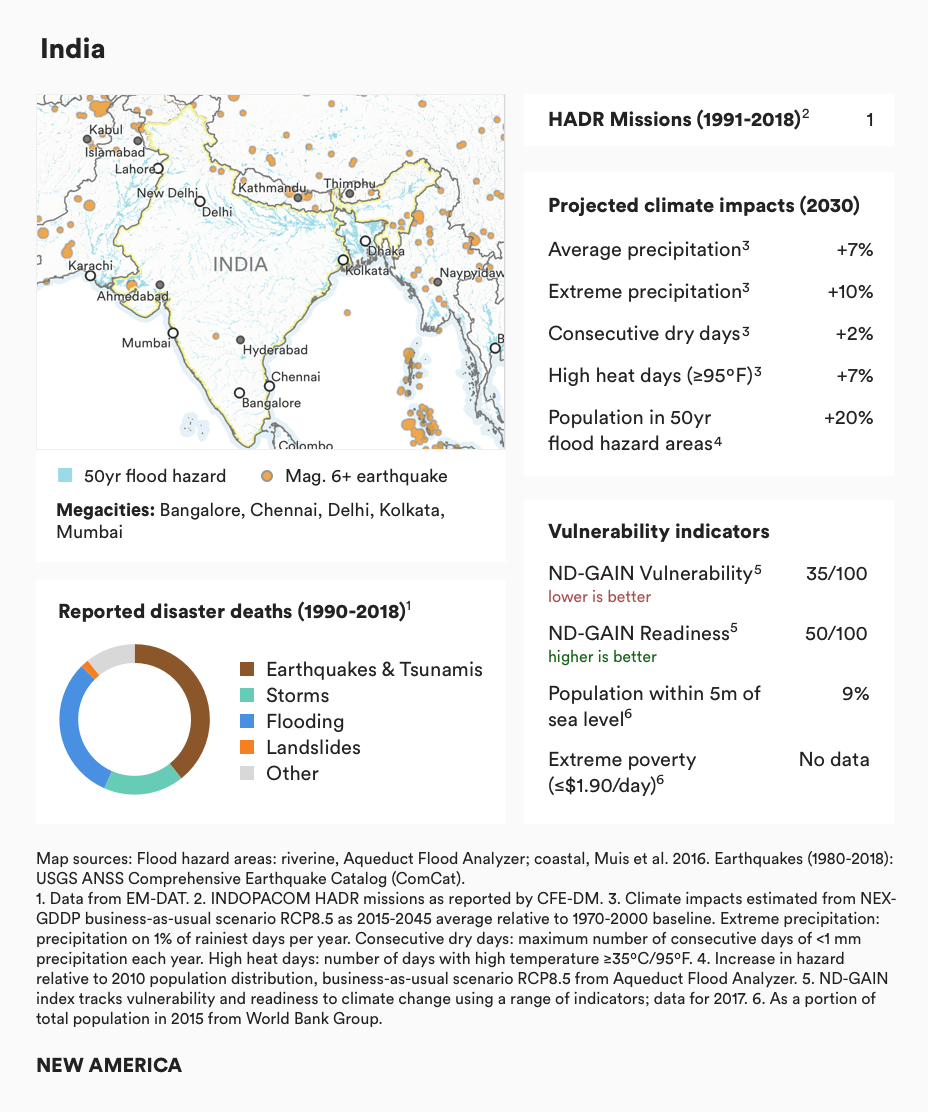
Concentrations of Risk: India
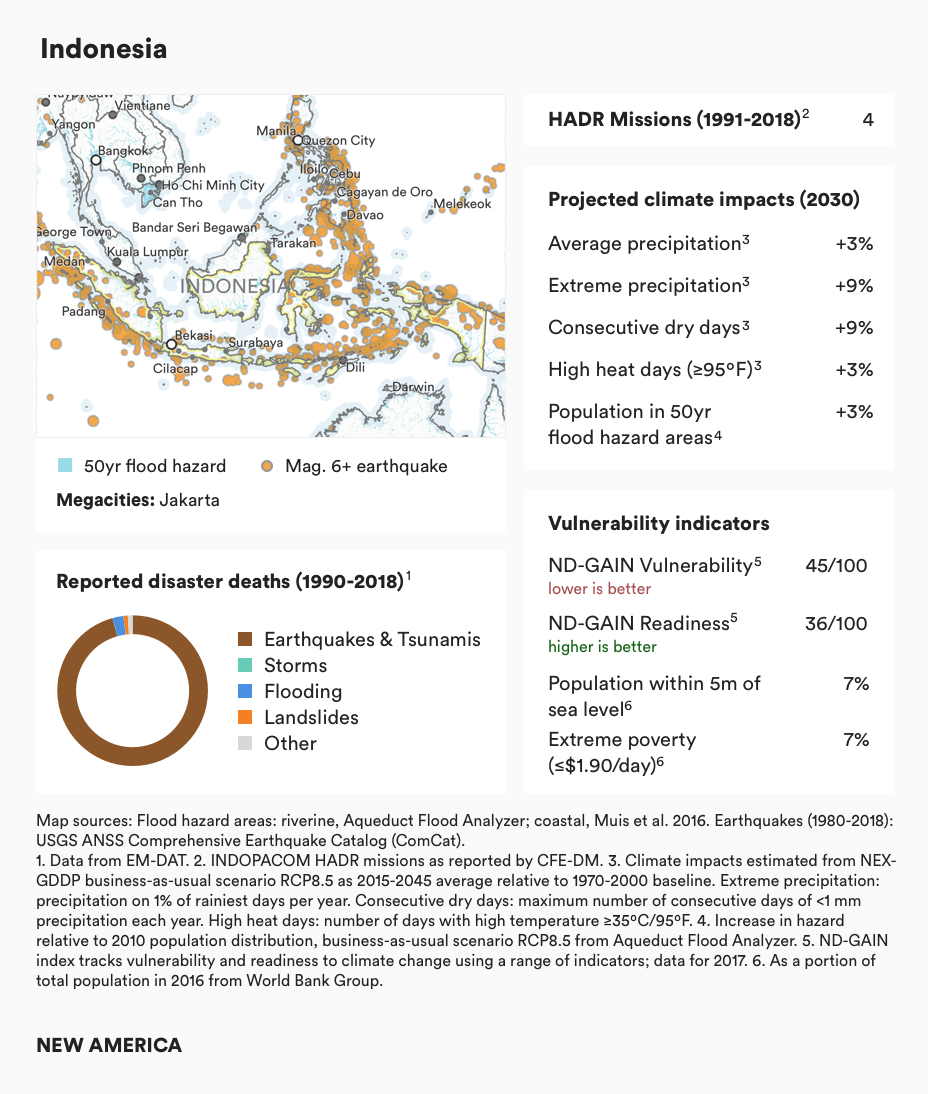
Concentrations of Risk: Indonesia
Concentrations of Risk: Myanmar

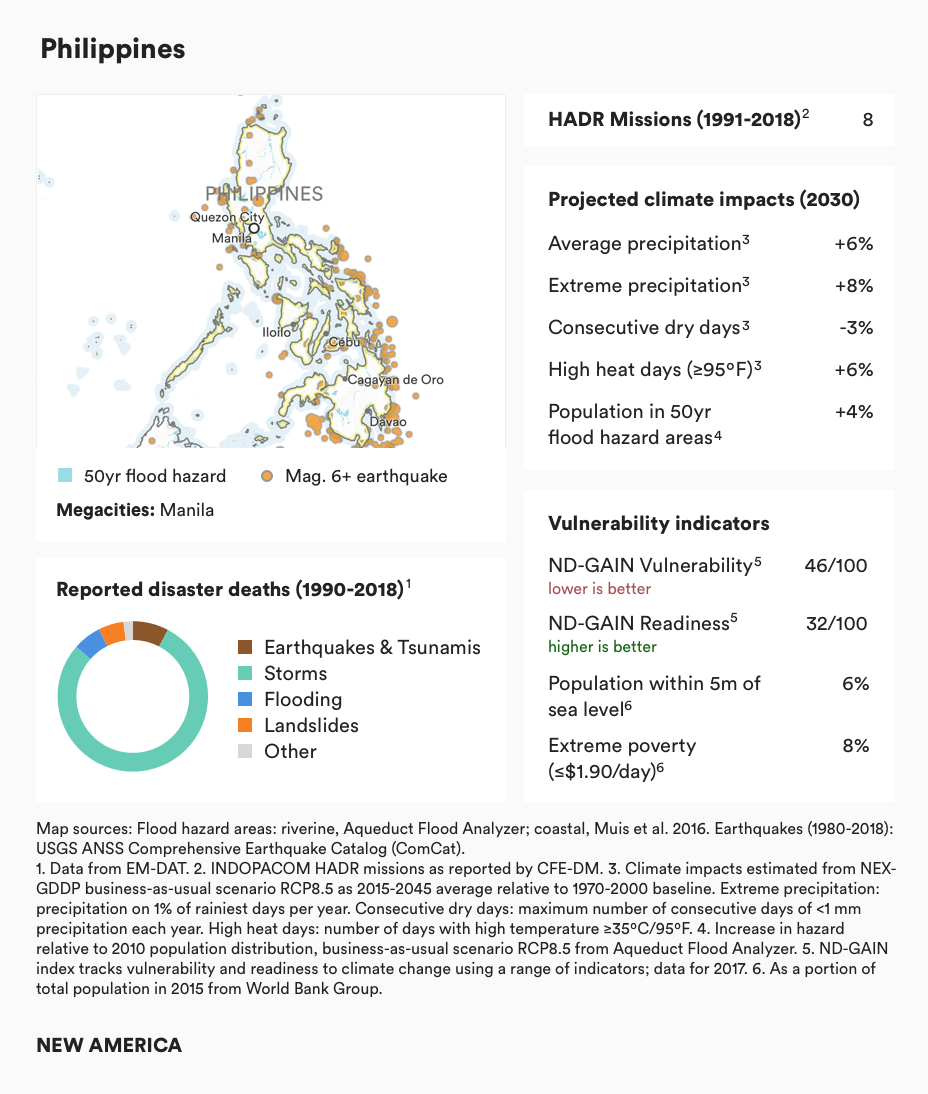
Concentrations of Risk: Philippines
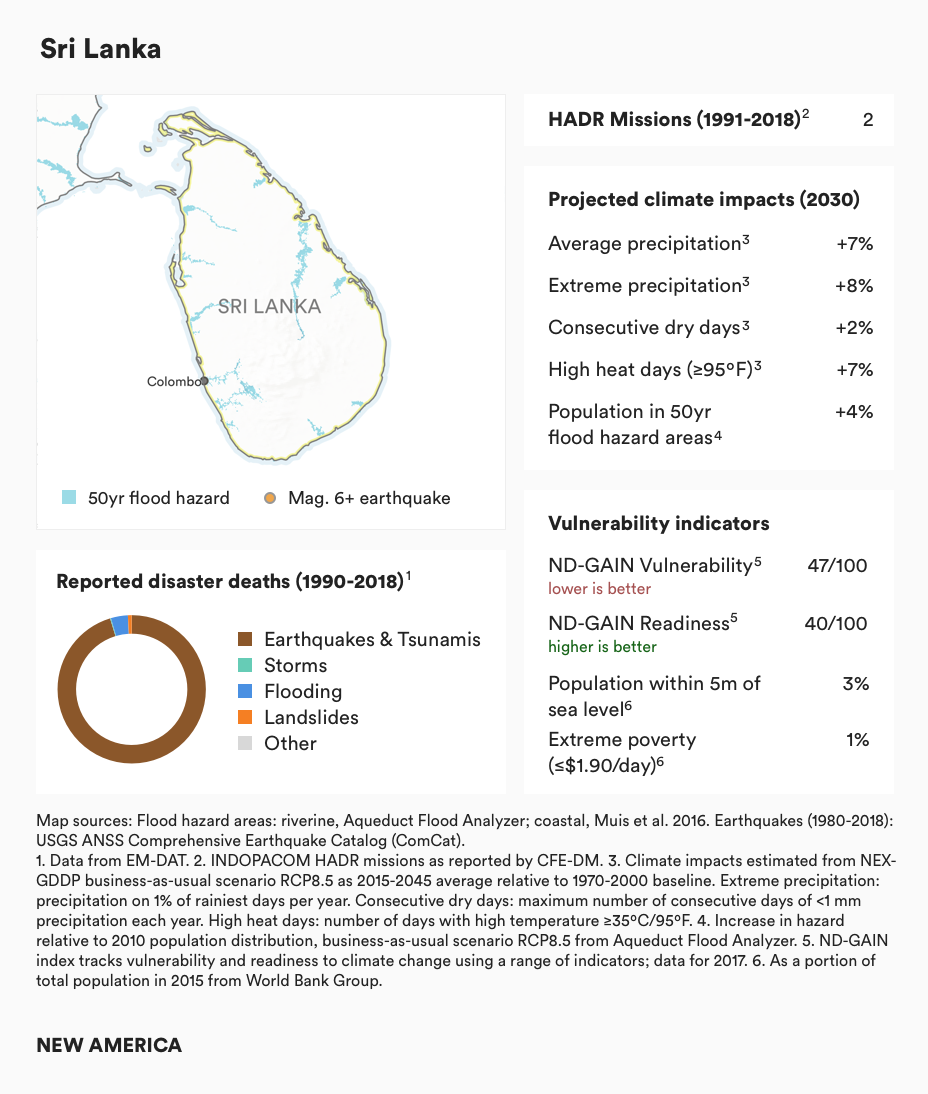
Concentrations of Risk: Sri Lanka
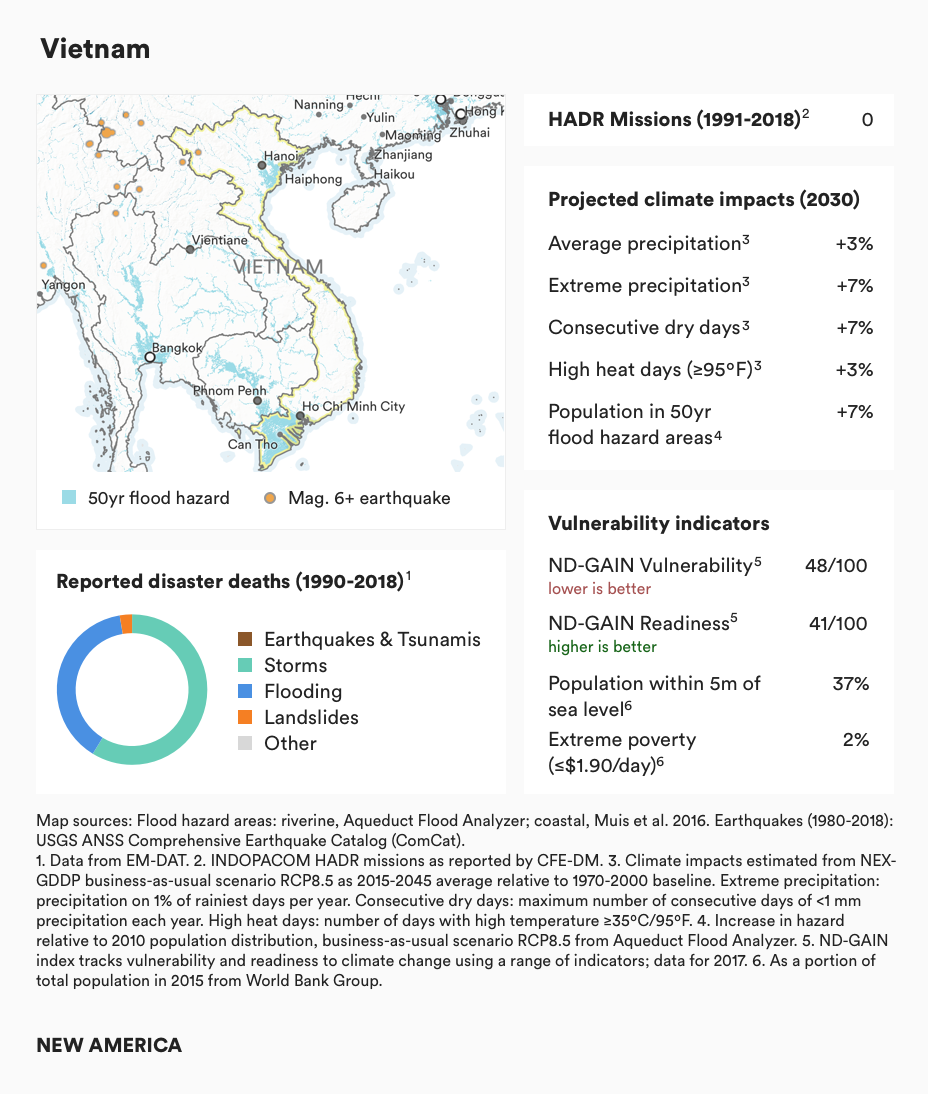
Concentrations of Risk: Vietnam