Undecided Voters: Who They Are, What They Want, and How They Decide Our Politics
Executive Summary
Every election cycle, campaigns try to persuade undecided voters to support their side. Whether undecided voters are receptive to campaigns and how they end up voting—if they turn out at all—often proves pivotal in deciding elections. But who are these undecided voters and what policies do they want? Using a rich public opinion dataset, we analyze the demographics and policy preferences of undecided voters and how they differ from partisan voters. Undecided voters tend to be younger, have lower levels of educational attainment, and lower household incomes compared to Democratic and Republican voters. Undecided voters are also less interested in politics and largely equivocal about the Democratic and Republican parties. In terms of policy, undecided voters are not unified by shared positions towards social and economic issues. Instead, they have many different combinations of policy preferences, making it challenging to determine what they want from politics. Reforms like fusion balloting or proportional representation could allow for the emergence of new parties that could find ways to engage and provide better representation for these voters.
Key Takeaways
- Undecided voters are less engaged with politics and have more ambiguous feelings about the Democratic and Republican parties.
- Undecided voters hold many different combinations of policy positions, making it harder to pinpoint exactly what they want.
- Policy positions have little effect on how undecided voters feel about the parties.
- Moving away from a winner-takes-all electoral system could help better engage and represent undecided voters and also accommodate partisan voters with conflicting views that do not fit well within the two major parties.
Introduction
For several cycles now, every U.S. election has come down to a small slice of “undecided voters.” Their indecisiveness makes them the target of intense campaigning as parties try to convince them to turn out to vote and to sway them to their side. The last-minute voting decisions of undecided voters can ultimately determine which party controls Congress. And following every election, pundits have attempted to divine in exit polls and other surveys exactly what drew these last-minute deciders to one party or the other.
Yet, a winning formula remains elusive. Despite billions of dollars spent on campaigns, polls moved very little in the handful of key races that decided the election. In this report, we examine why a winning formula for undecided voters remains so elusive, and why we should be skeptical of anyone who thinks they’ve figured out the formula.
The short answer is that undecided voters are highly idiosyncratic. They have all different kinds of combinations of policy positions, so there is no clear winning policy message. Moreover, there’s little evidence that they vote on policy. At the very least, their policy preferences are largely untethered to their attitudes towards the two major parties.
Though these voters surely have their reasons for deciding how and whether to vote, as far as we can tell, they are likely making decisions influenced by a variety of random factors.
The only characteristics that seem to be consistent among undecided voters is that they are younger, less educated, less wealthy, and less politically aware and engaged than partisans—all factors that may contribute to their inscrutable inconsistencies, compared to more predictable partisans.
Our findings raise important questions about the role of elections in contemporary U.S. politics, as well as the nature of our electoral system. If a small but decisive sliver of relatively disengaged voters are deciding electoral outcomes on what appear to be random considerations can either party ever achieve a meaningful mandate and can elections truly deliver accountability?
Because the two major parties are both increasingly so different in the values and policies they represent (particularly on basic questions of liberal democracy), and so “calcified” in their equally large coalitions, the persistence of an unpredictable and inconsistent group of undecided voters holding the balance of power raises serious questions about whether elections in the United States reflect an accurate aggregation of the people’s will or a series of lucky draws.
We also look at the attitudes of partisans, and find that a surprisingly large number are in significant disagreement with their own party—but on different sets of issues. These are cross-pressured voters, who hold progressive views on some issues and conservative views on others. The Democratic voter coalition is largely held together by agreement on economic policy, but contains considerable disagreement on social and cultural issues. The Republican voter coalition is largely held together by agreement on social and cultural issues, but contains considerable disagreement on economic policy.
But—whether because of partisanship, intense dislike for the other party, or other reasons—cross-pressured partisans are staying with their coalitions. Undecided voters, by contrast, have a mix of policy preferences and it is not clear how exactly they resolve their cross-pressures, if they do, which can ultimately decide whether an election goes for one party or the other.
About the Data
The data we use comes from the Democracy Fund + UCLA Nationscape survey. The survey fielded 77 waves from July 2019 through January 2021, reaching nearly 500,000 interviews and generating a rich dataset ideal for exploring our questions. The survey concluded in early 2021, but it is still useful for understanding undecided voters, particularly because its many waves over so many different news cycles ensures that the data provides more stable estimates of public opinion on average.1
We define undecided voters as those who were not sure what party to vote for when asked who they would vote for if elections for the House of Representatives were held on the day they were interviewed. Respondents were asked this question in 70 of the 77 survey waves, so it provides good coverage of the survey sample. The results are remarkably similar when we analyze voters who are undecided for the presidential election, which was measured in 21 waves of the survey once the candidates were defined in the summer of 2020 and up to the general election in the fall.
We can’t tell from the survey data if these undecided voters actually turned out to vote and, if they did, how they voted. The data shows that undecided voters prior to an election tend to be relatively disconnected from politics and have loose ideological views, and still, a significant share of them do vote, especially in presidential years. In 2020, 45 percent of undecided voters said they intended to vote. This is unsurprisingly much lower than for the eligible electorate as a whole, in which 67 percent voted in 2020, but undecided voters can nonetheless hold a decisive weight in close elections, which are increasingly more common. Undecided voters–precisely because of their indecisiveness and their detachment from politics–represent a voting bloc that is up for grabs, making them irresistible and unavoidable to candidates.
We built indices for social and economic issues by aggregating the responses to questions on similar topics. On the social dimension, we created indices for policy views on abortion, immigration, gun control, views towards the role of structural discrimination in society, and agreement with Christian and traditional values and positions. On the economic dimension, we created indices for respondents’ positions on environmental protections and investments, the role of government in healthcare, debt free college, the role of government in the economy, and taxation. Throughout all of our analyses, the indices have been re-coded such that the more negative values correspond with more progressive positions whereas the more positive values correspond with more conservative positions. All indices have also been standardized to facilitate comparisons.
1. How Undecided Voters Are and Aren’t Distinct from Partisans
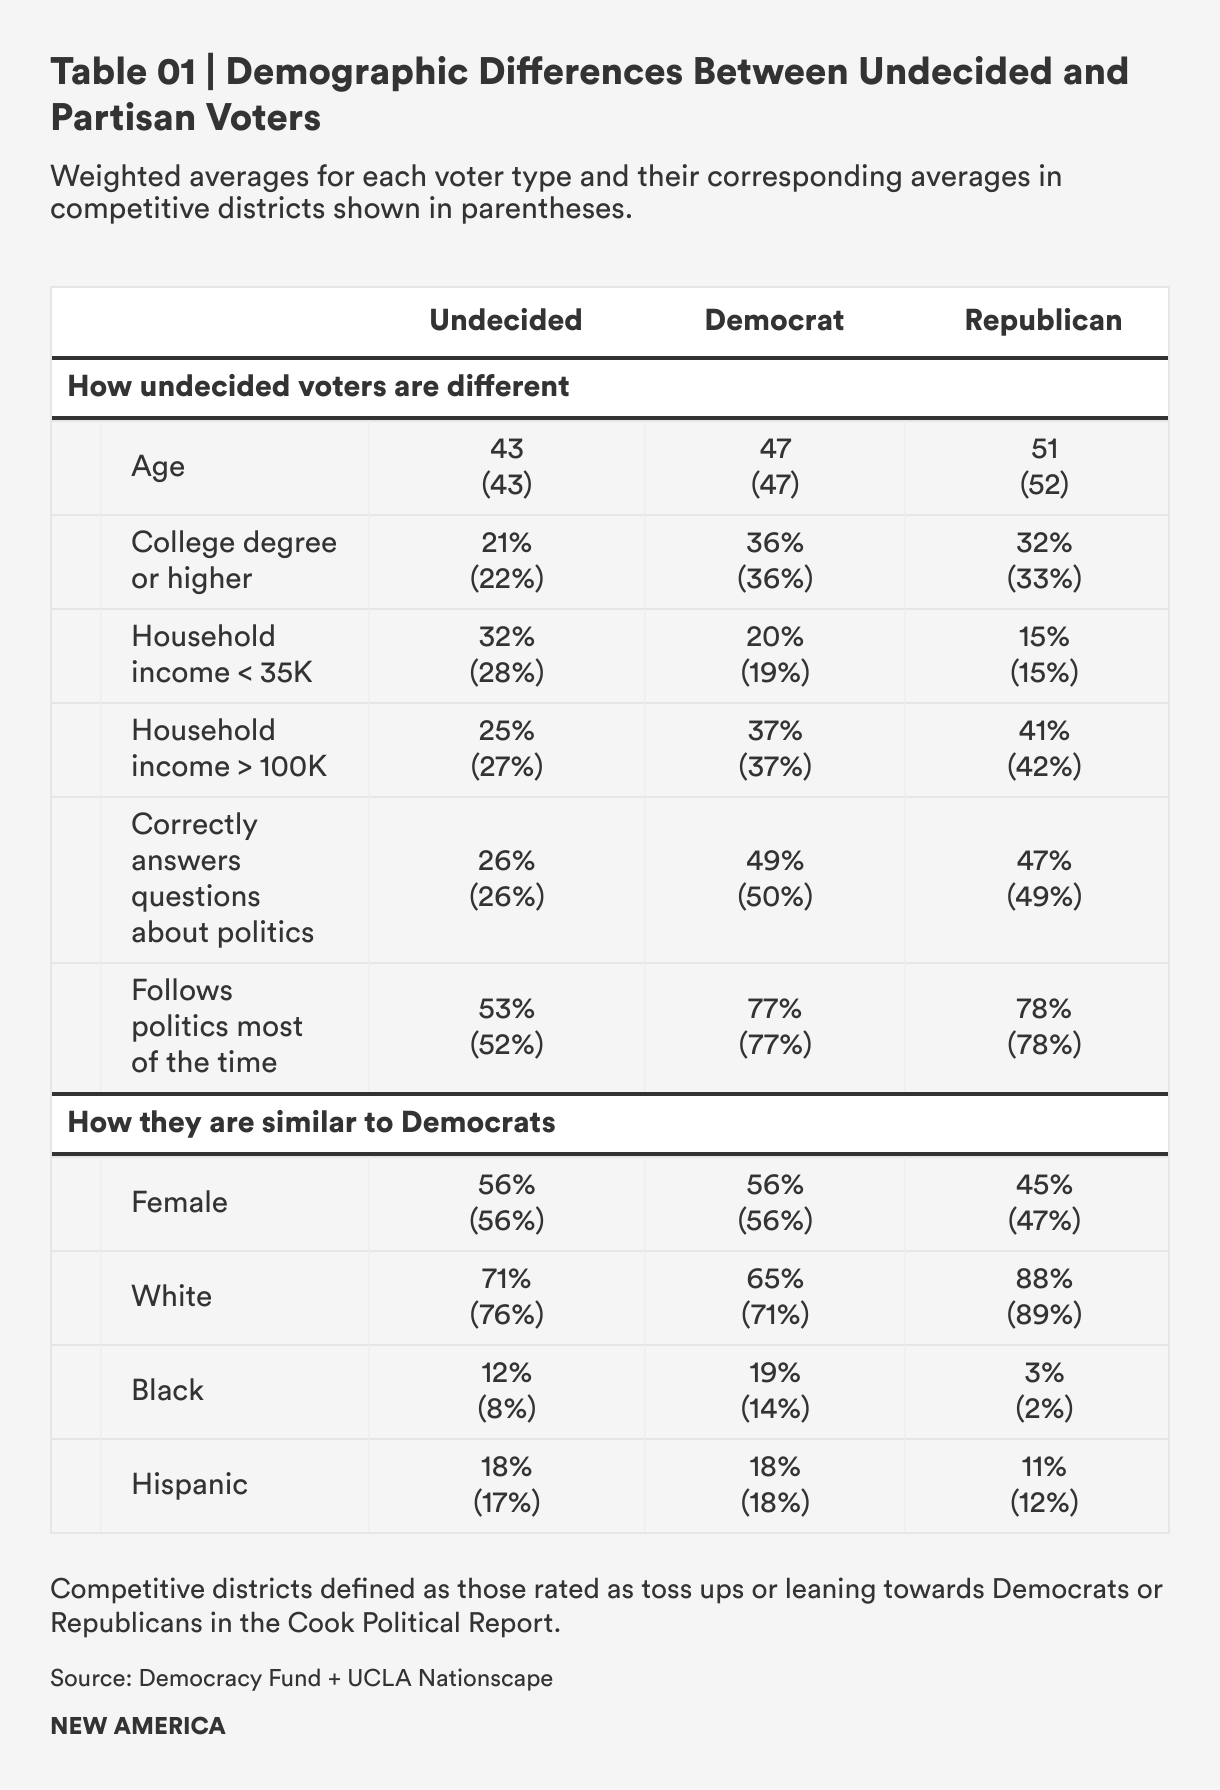
In many ways, undecided voters are in a category of their own. They tend to be younger, less well-educated and less wealthy, and less knowledgeable about politics.
But in other ways, undecided voters appear demographically similar to Democrats. Both undecided voters and Democrats have a similar share of female and Hispanic voters in their ranks. Undecided voters have a higher share of white voters than Democrats but not as high as Republicans. A smaller percentage of undecided voters are Black, though not as few as Republicans. There are no demographic categories for which undecided voters as a whole resemble Republicans. In competitive districts, which tend to skew whiter, richer, and more suburban than the average congressional district, undecided voters are whiter and somewhat better off economically.
But even in these competitive districts, which are subject to intense campaigning activity, undecided voters are no more interested in politics or more knowledgeable about politics. The lower interest in politics among undecided voters indicates that they might be more distant from political passions and have less intense feelings about politics compared to Democratic or Republican partisans. Their detachment from politics might suggest that undecided voters would have less well defined policy preferences, especially if their policy positions are not strongly informed by partisan cues or messaging. That they remain uninterested in politics even in districts where political messaging is more prevalent underscores their detachment from politics and the difficulties in creating meaningful linkages with them.
2. Undecided Voters Are Unenthusiastic but Equivocal towards the Two Major Parties
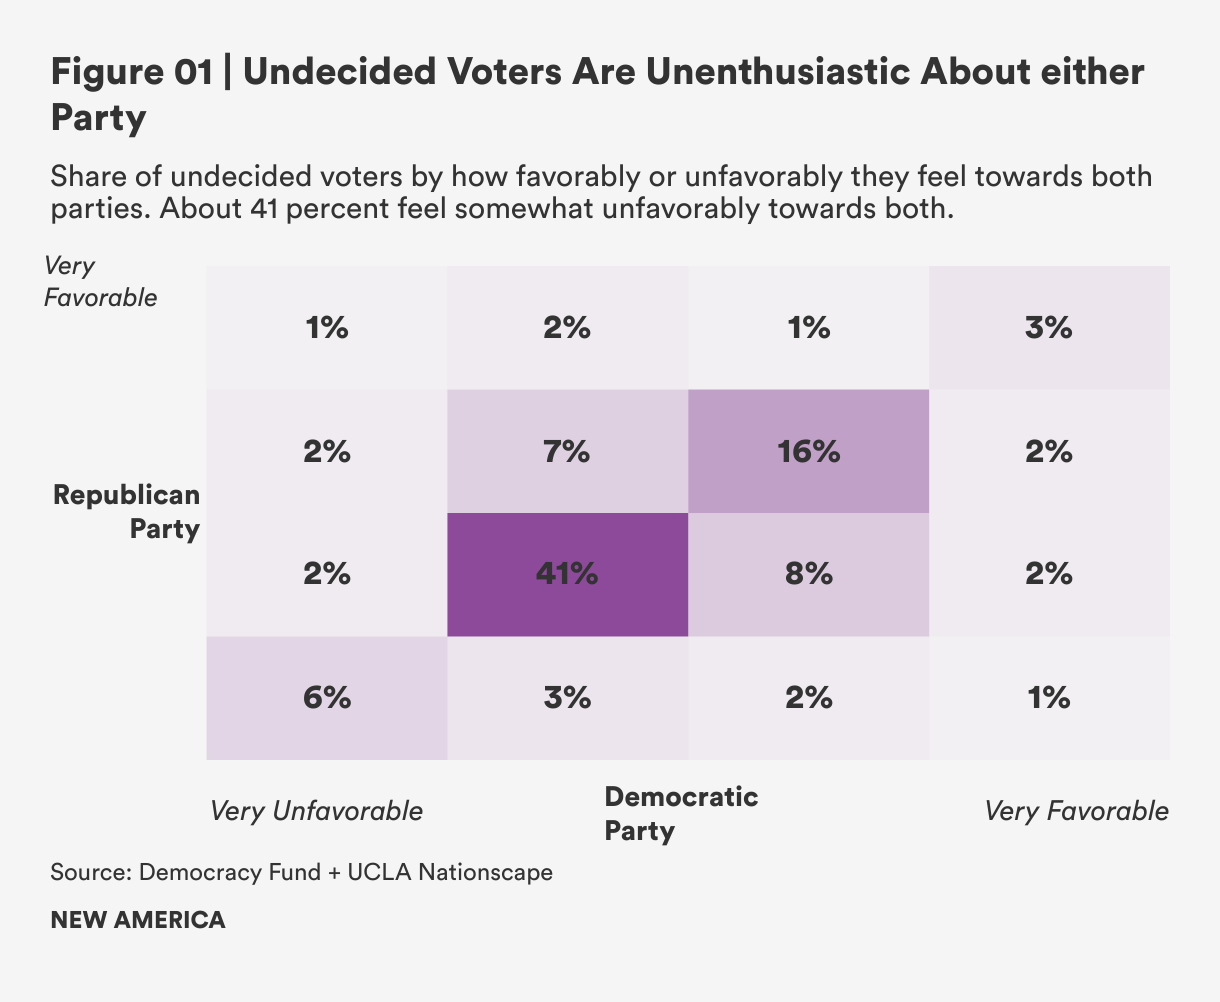
Unsurprisingly, undecided voters are on balance unenthusiastic and equivocal about both parties—they neither love nor hate either party. The lukewarm position of undecided voters likely reflects their inattention to politics or their lack of interest in learning more about parties and candidates, which given the polarizing forces of American politics would probably sort them into having very negative or very positive views of parties.
Looking at how favorably or unfavorably undecided voters feel towards the Democratic and Republican parties, we find that they mostly fall in the middle. About 41 percent of undecided voters feel somewhat unfavorable about both the Democratic and Republican parties and 16 percent report feeling somewhat favorable towards them. The ambivalence of undecided voters stands in stark contrast to how intense partisans feel towards their own party and especially towards the opposing party.
If undecided voters do not feel particularly favorable or unfavorable toward either party, their vote choice is likely not driven by positive or negative partisanship. But, as we show in a later section, the policy preferences of undecided voters don’t seem to influence their views towards parties either, further compounding efforts at understanding this voting bloc. Even if they agree with the parties on key issues, this does not seem to push them closer to the Democratic or Republican party.
3. Undecided Voters Agree a Little with Both Parties, but Not in Any Consistent Manner across Different Voters
Those looking to divine a strategy to win over undecided voters can scrutinize polls and focus groups looking for movement on specific issues. But parsing the ambiguities can feel a bit like the ancient art of reading tea leaves.
Here, we present the full complexity of undecided voters, and their many uncertainties. In short, some agree with Democrats on some issues, Republicans on other issues; others agree with Democrats and Republicans on different sets of issues. There is no clear winning strategy, which may be one reason why no clear winning strategy has yet to be discovered.
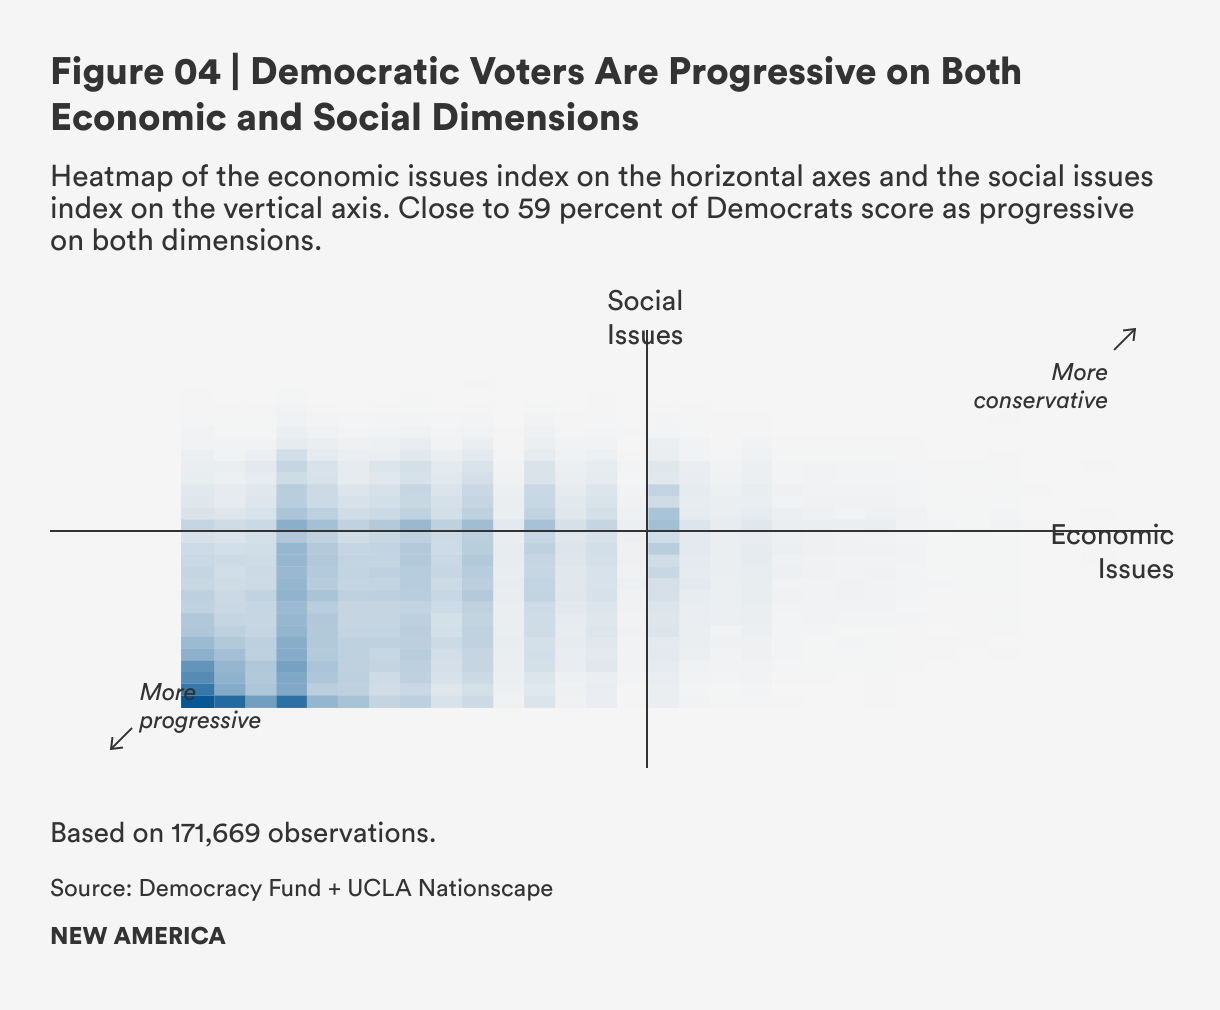
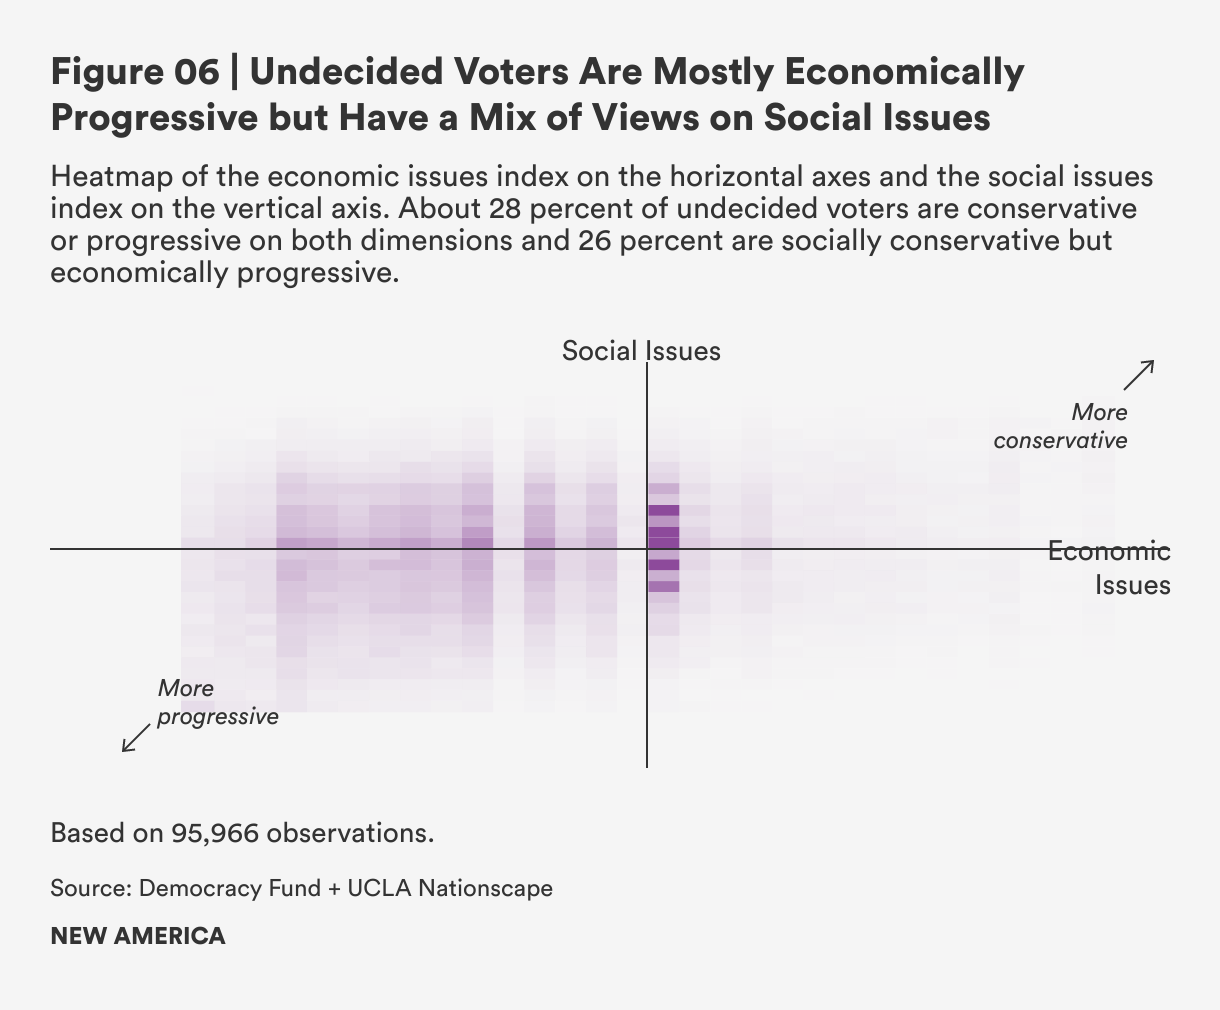
We first start by looking at how all types of voters fall on a two-dimensional policy space between social and economic issues. As expected, the majority of Democrats are concentrated in the lower left quadrant, more progressive on social issues and more progressive on economic issues. Only 10 percent of Democrats have conservative economic positions on both dimensions and 17 percent of them are socially conservative but economically progressive.
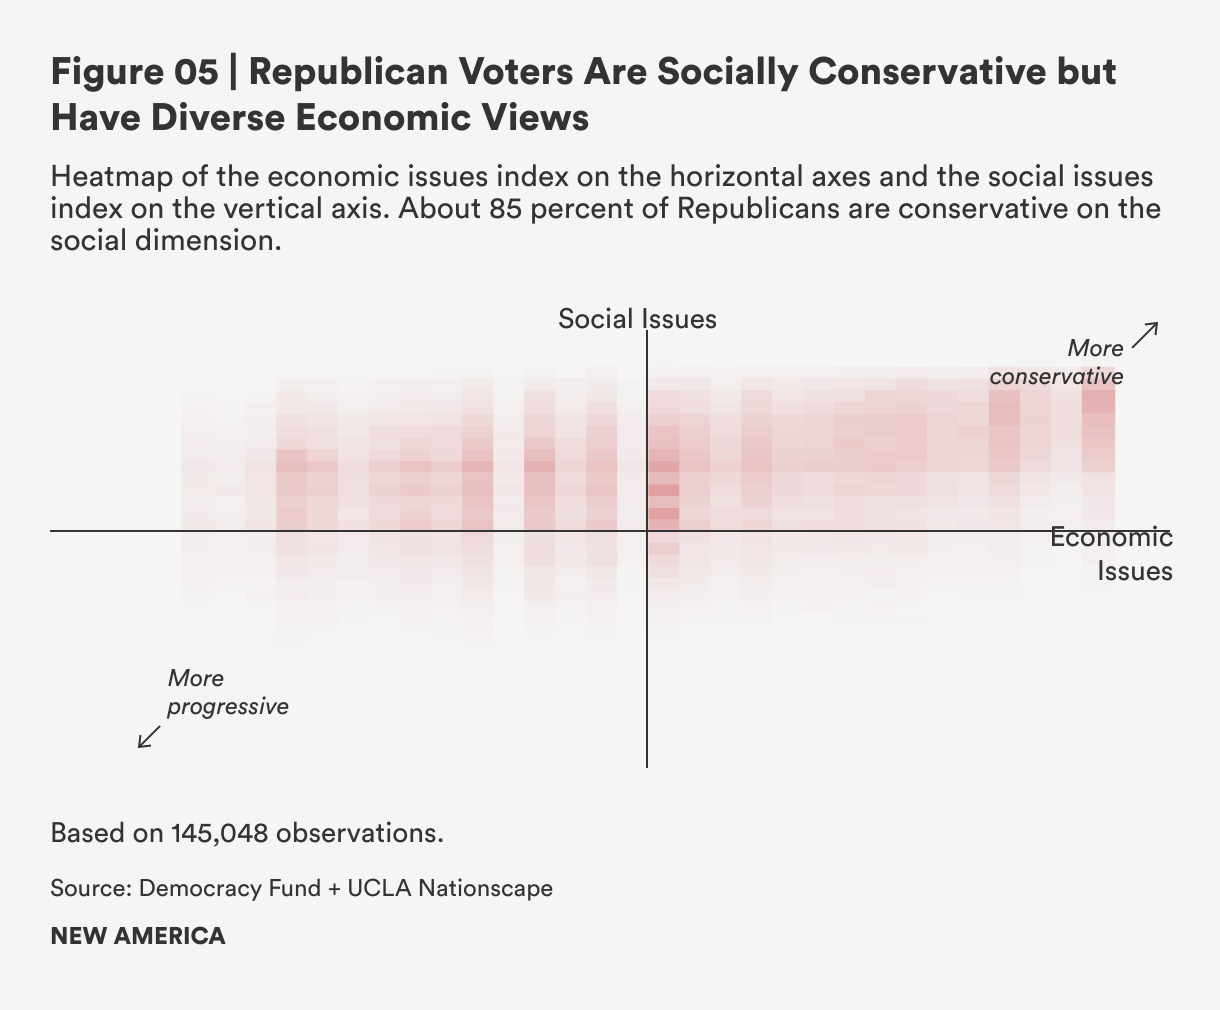
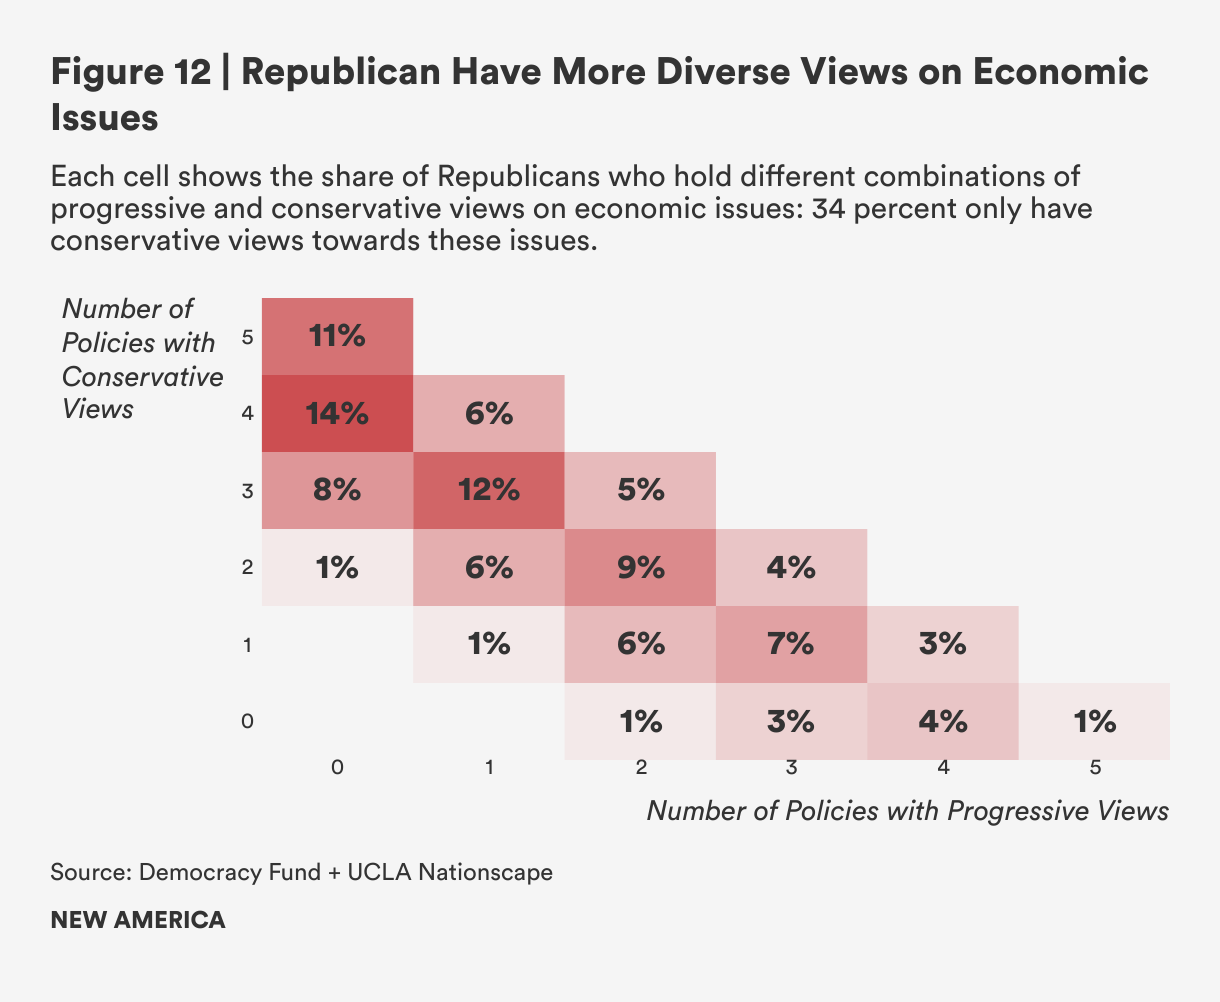
Republicans are more mixed. While 85 percent of Republicans are socially conservative, a non-trivial share of them—30 percent—have progressive positions on economic issues. This combination of Republican voters may help explain the exploitation of social issues in Republican campaigns as a strategy to appeal to voters in the Republican base that may have divergent economic policy preferences.
Undecided voters are harder to characterize. The heatmap shows a clustering of undecided voters right above the median on both economic and social dimensions, where 28 percent of undecided voters are found. But another 28 percent of undecided voters have progressive positions on both economic and social issues—they just happen to be more spread out—and 26 percent have views that are socially conservative but economically progressive. The remaining 18 percent have views that are socially progressive but economically conservative.
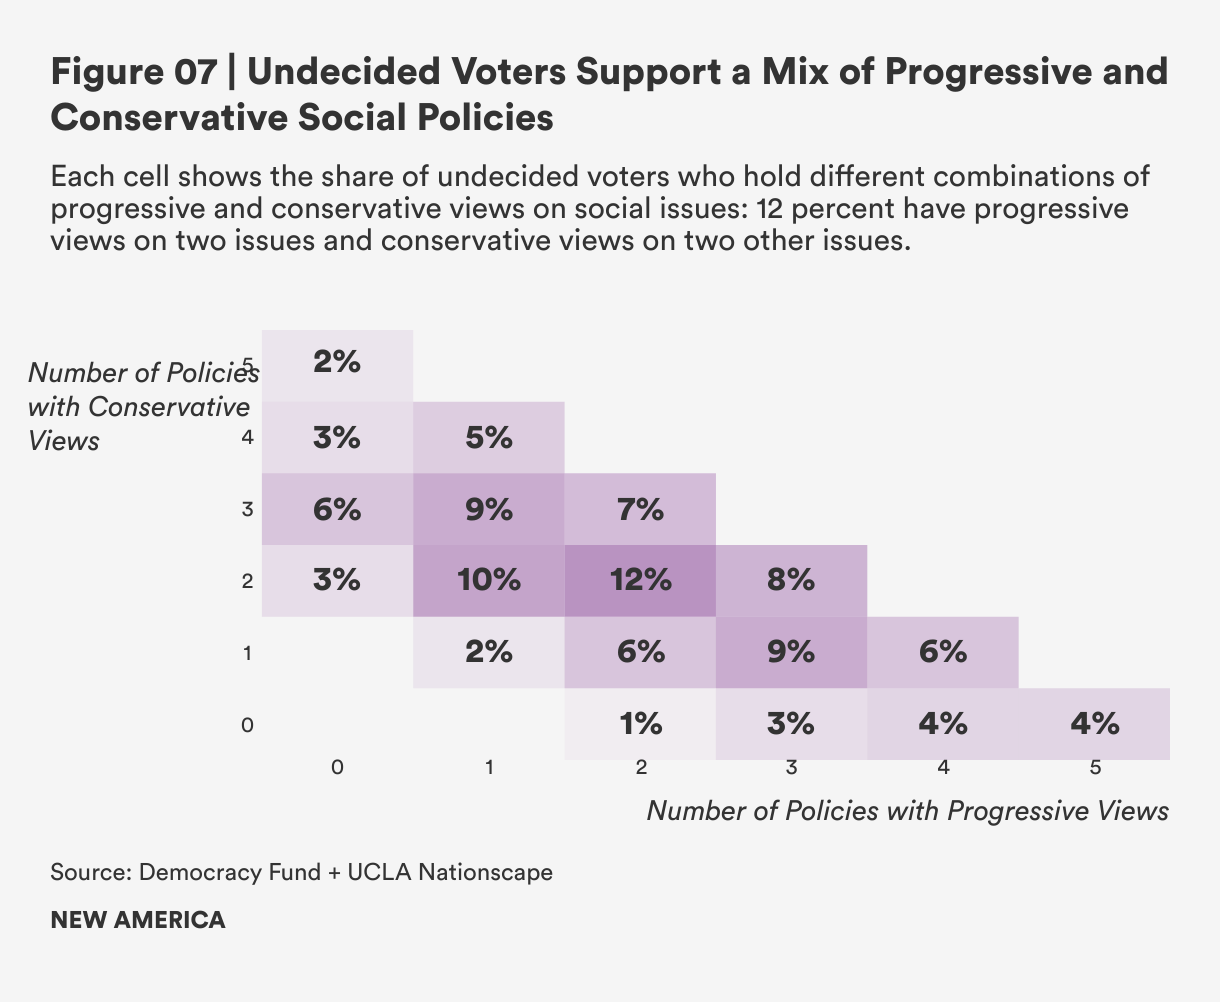
The aggregated social and economic dimensions hide important variation in the policy preferences of undecided voters within each of those dimensions. We look, then, at the number of Democratic and Republican policy positions that undecided voters support.2
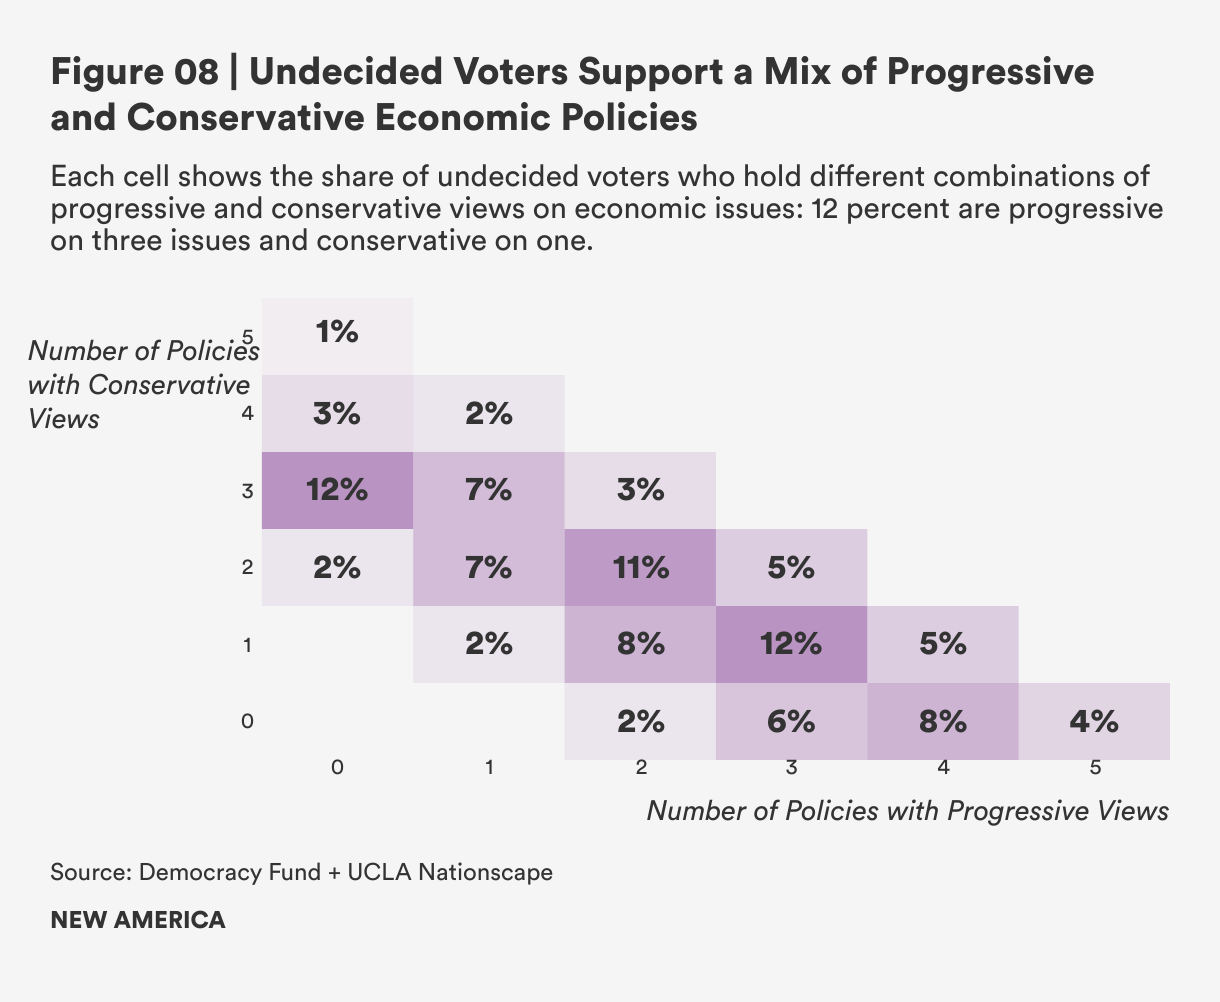
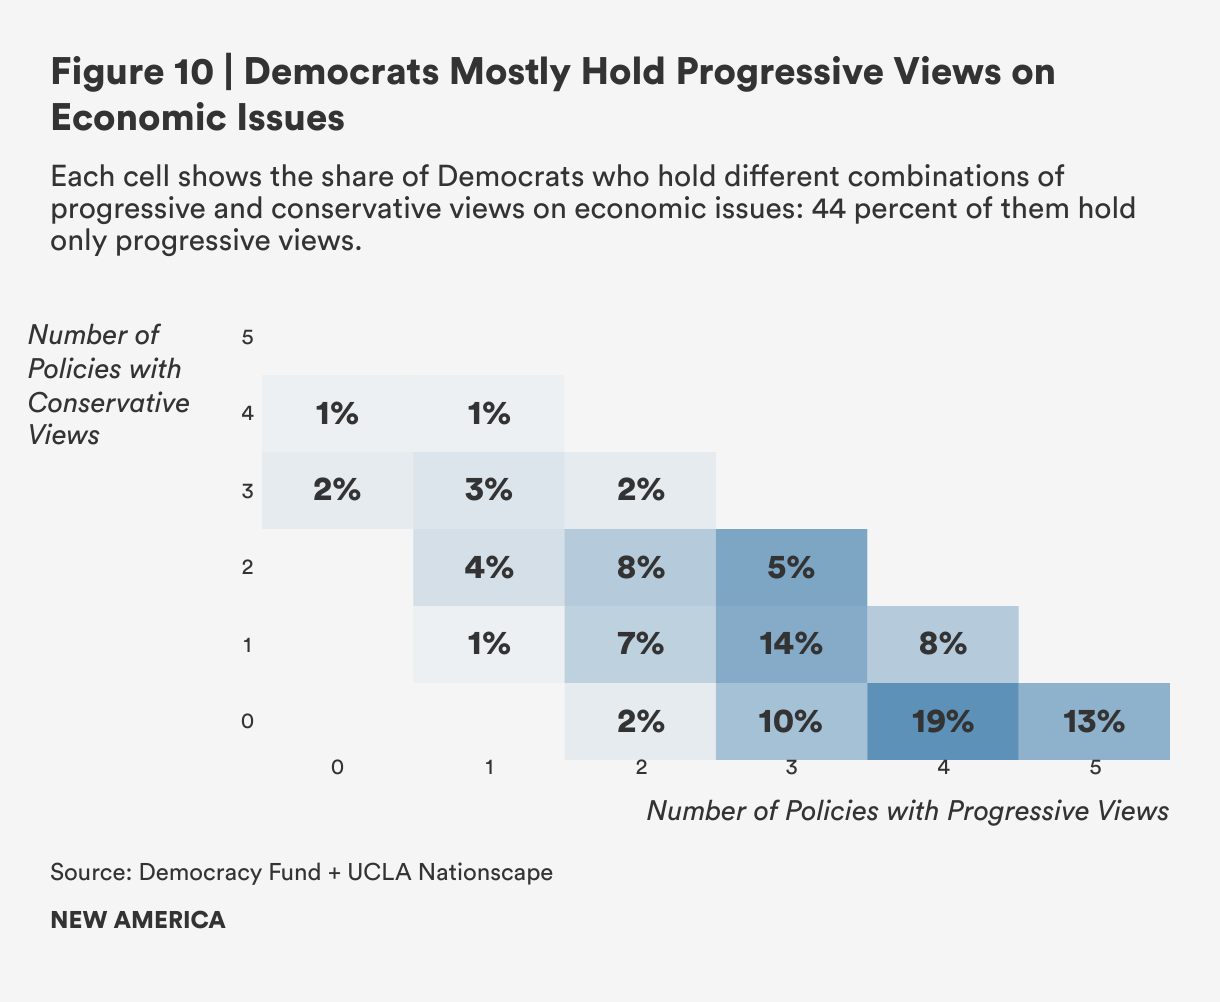
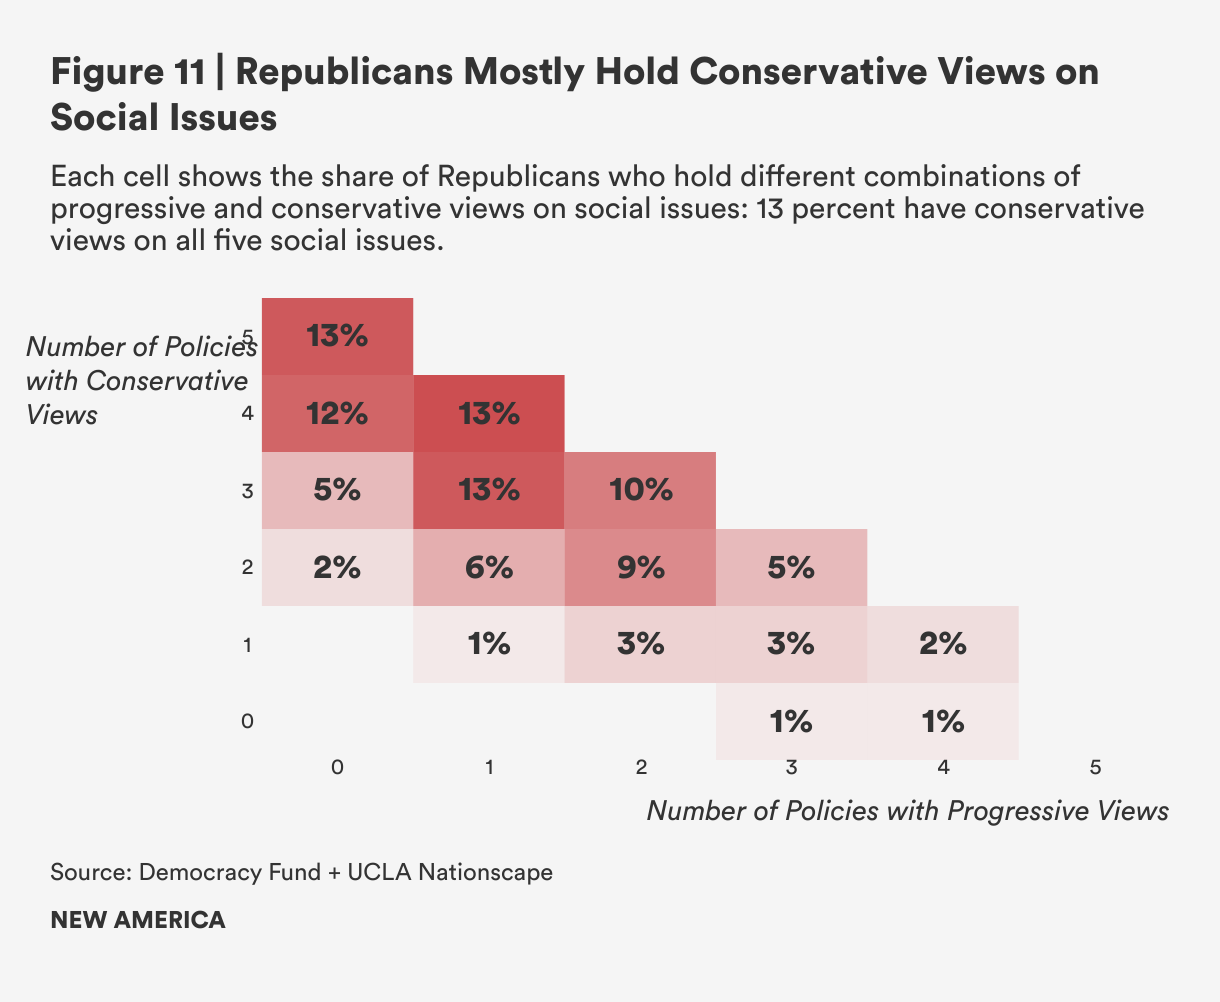
Again, no clear pattern emerges among undecided voters. If undecided voters were galvanized by one issue like, say, being pro-choice, then we would see the majority of undecided voters supporting one progressive position and a number of conservative positions, but that is not the case. Instead, making matters more complicated for understanding their policy preferences, undecided voters support different combinations of progressive and conservative issues on both social and economic dimensions. For instance, 12 percent of undecided voters support two progressive and two conservative social policies, followed by 10 percent who support one progressive and two conservative policies. A similar pattern emerges on the economic dimension, where 12 percent of undecided voters support three progressive economic policies and one conservative policy, followed by 11 percent who support two and two.
Partisans Are More Unified in Their Beliefs, but Still Disagree Plenty with Their Parties
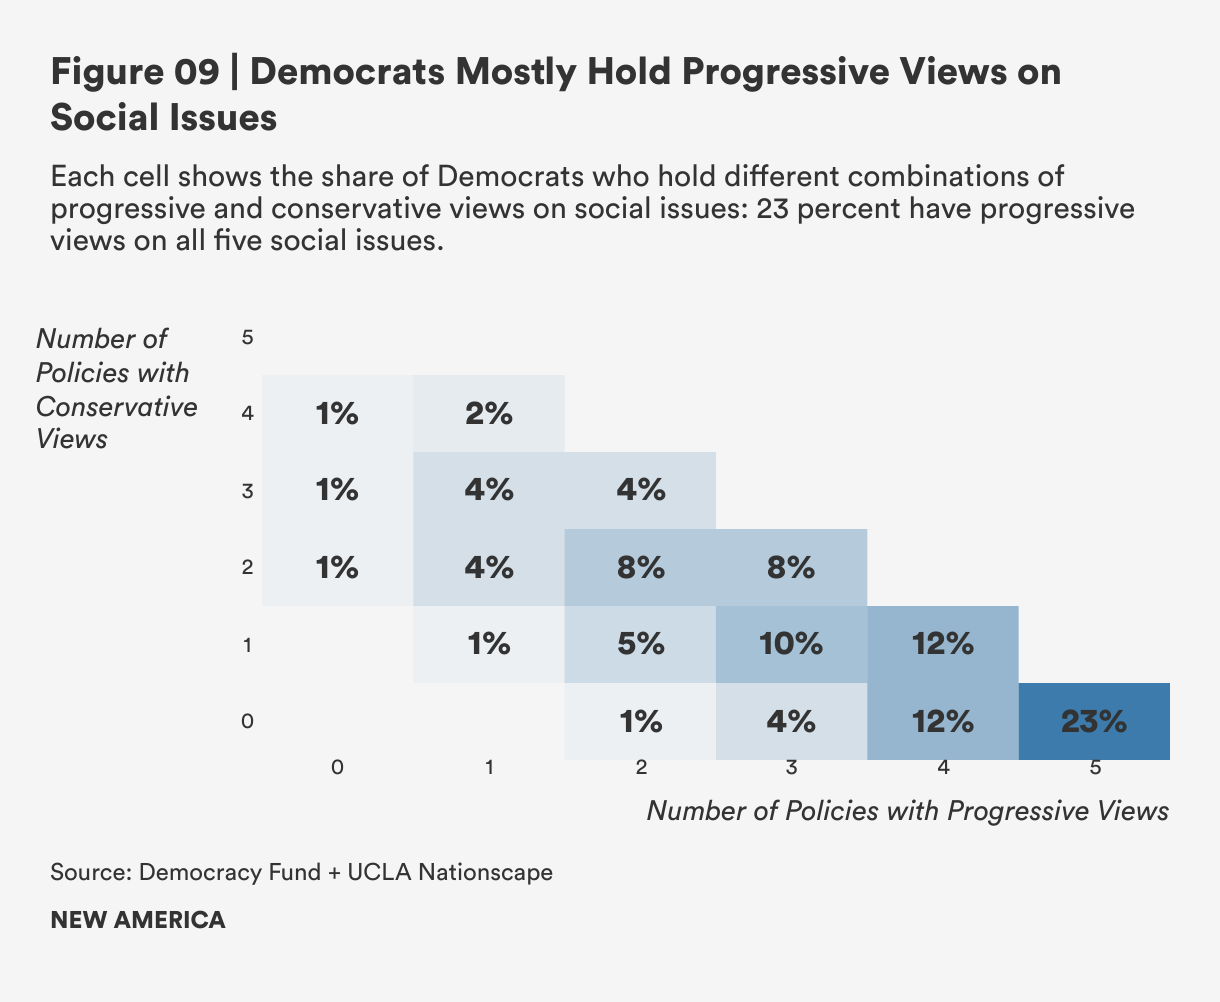
As expected, we see a more polarizing pattern when it comes to Democratic and Republican voters. Most Democratic voters support more progressive policies and most Republican voters support more conservative policies, though Republican voters do support more progressive economic positions than Democrats support conservative economic positions, reflecting the more varied economic views within the party.
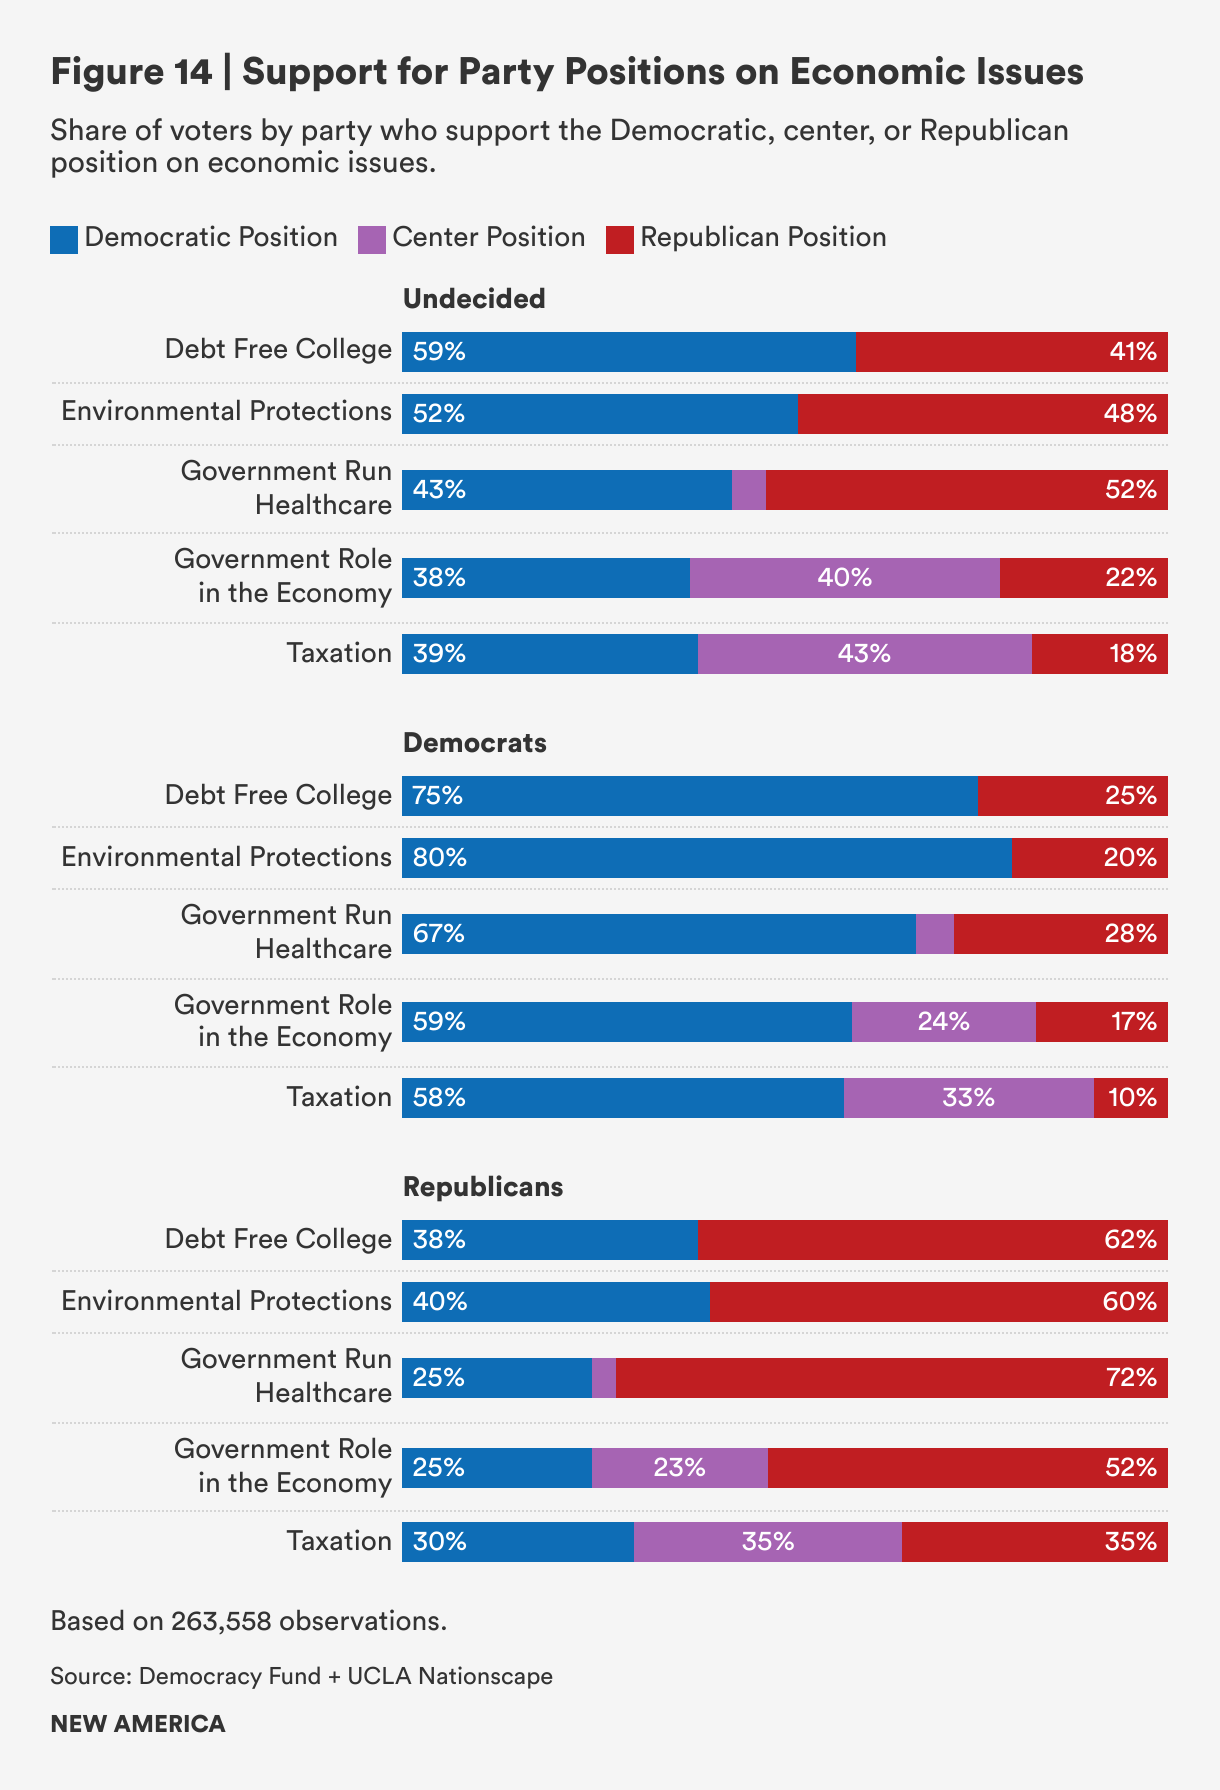
The previous graphs show how many Democratic and Republican positions voters support, but they hide an important share of voters who fall on the center between these positions. Here we include those center positions to provide a richer characterization of the policy views of undecided voters and their partisan counterparts. In doing so, we start discovering certain issues that could sway undecided voters towards one party or the other.
On both social and economic issues, undecided voters have the most centrist views. It is difficult to determine the nature of this moderation as it could be caused by different underlying processes. Some voters may be truly centrists, others may appear in the political middle because they have extreme views on both sides of the spectrum. They may also appear as having centrist views if they do not have strong policy preferences and do not feel particularly passionate about either position.
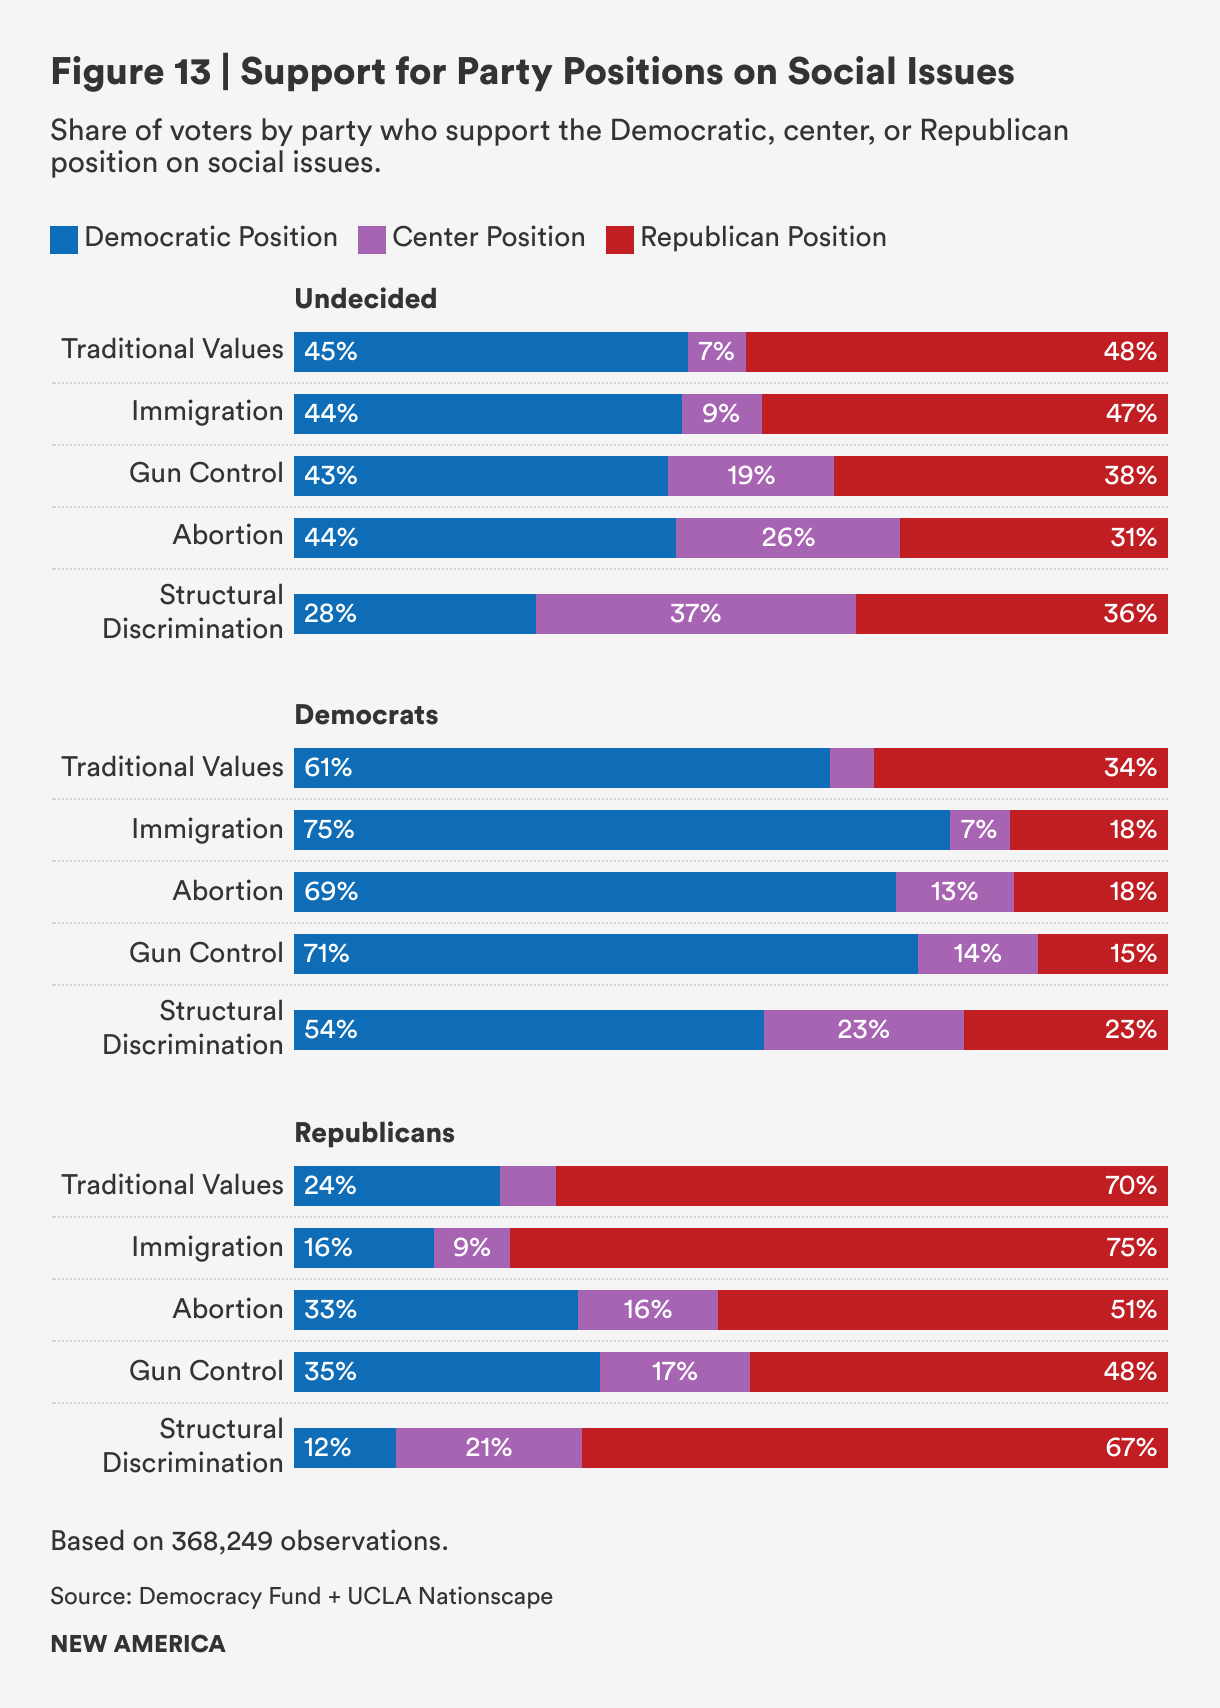
Undecided voters are the most centrist on their views towards structural discrimination, whether it is a factor that keeps Black people from succeeding or if Black people just have to try harder to get ahead. About 37 percent of undecided voters are torn between the Democratic and the Republican position, but a similar share of them are in support of the conservative position that racial discrimination is not keeping Black people behind but rather that they have to work harder to progress. The second highest share of undecided voters with centrist views is on the issue of abortion, with 26 percent of them in the middle. An important caveat is that these data come from before the Supreme Court’s Dobbs v. Jackson decision.
More undecided voters support the Republican positions on immigration and traditional values than they do the Democratic positions. In contrast, more undecided voters support the Democratic positions on gun control and abortion than they do the Republican ones.
On the economic dimension, over 50 percent of undecided voters support debt free college as well as environmental protections and investments. Moreover, although 40 percent of undecided voters have centrist views on the role of government in the economy and on taxation, very few support the Republican positions on these issues. On taxation, Republicans themselves are quite evenly split, again reflecting the growing anti-elite sentiment and economic populism of the party.
Many Voters Are Cross-Pressured across Issues in Many Different Ways—Especially Undecided Voters
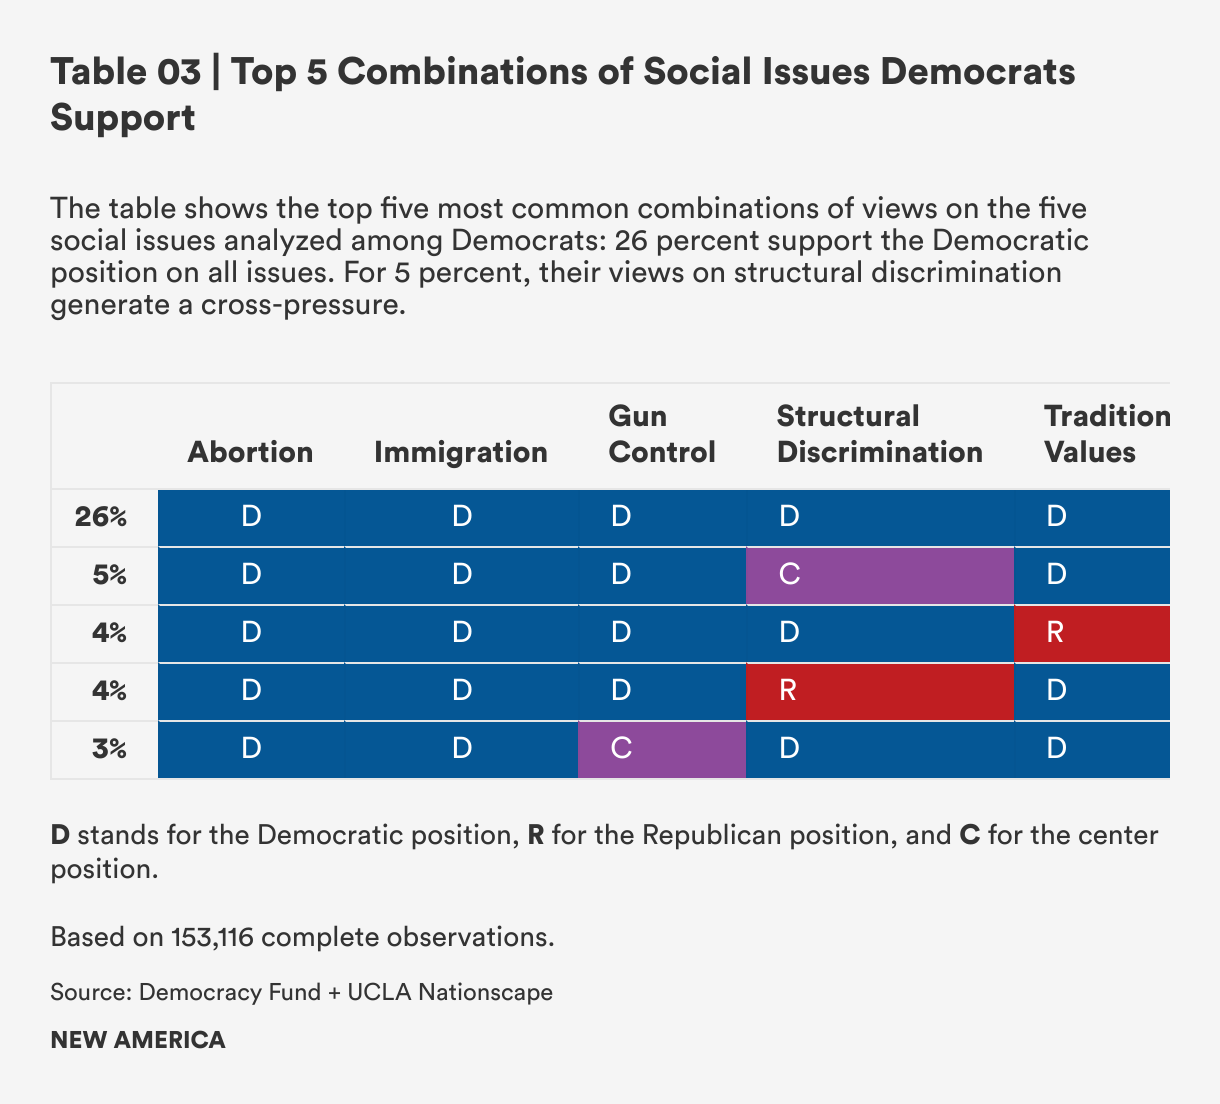
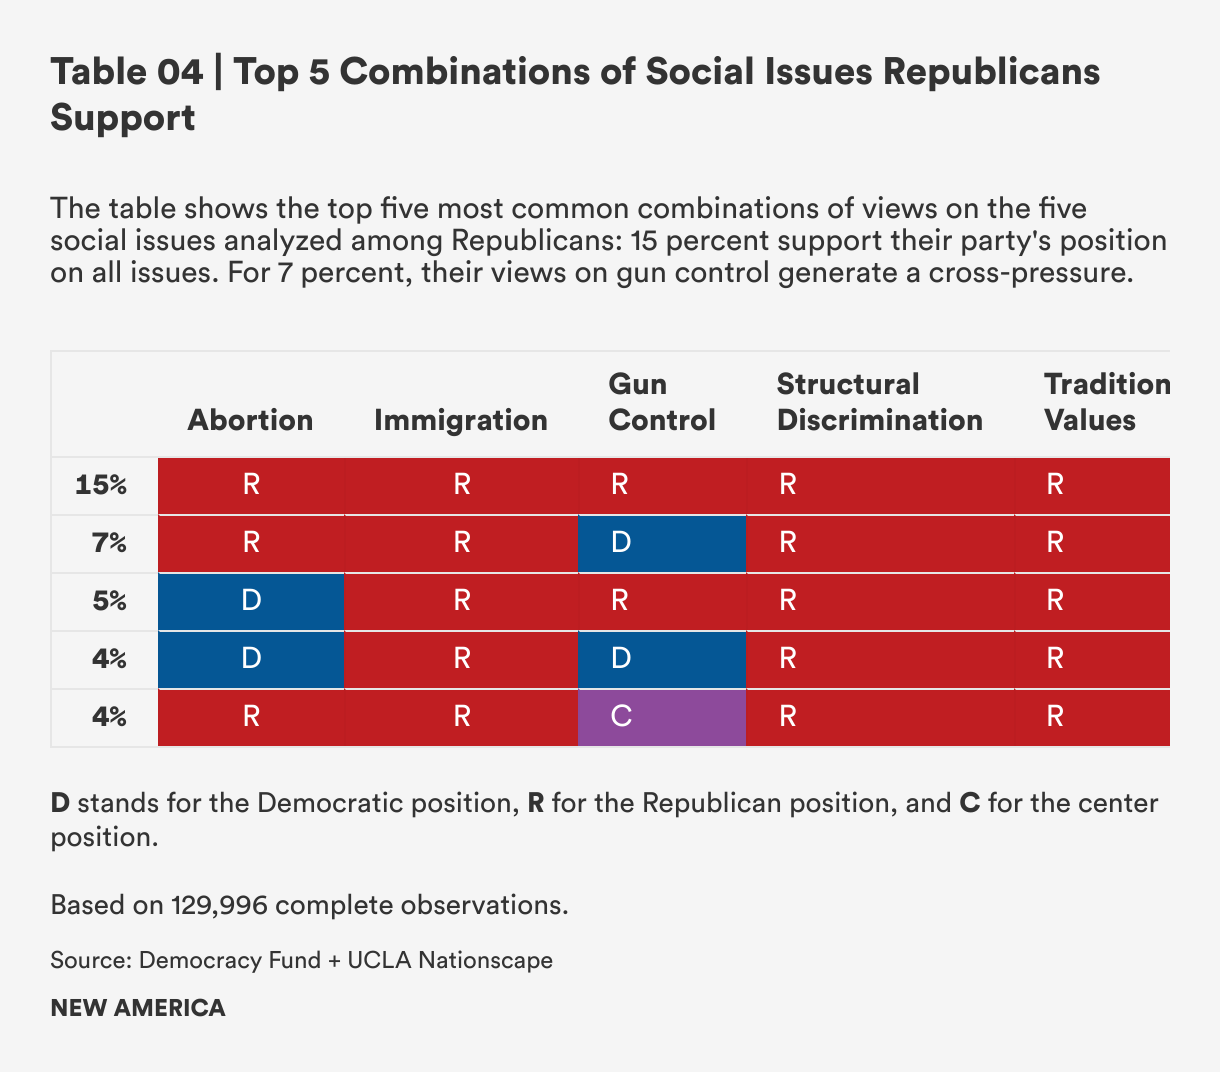
Although the top-line numbers provide a clue about where undecided voters stand on a variety of social and economic issues, it is harder to tell what exactly undecided voters want when considering all the issues together. All types of voters have cross-pressures in their preferences, supporting some progressive and some conservative positions. But Democrats and Republicans have a higher share of voters who only support Democratic or Republican positions across these issues. About 26 percent of Democrats support only Democratic positions on social issues and about 15 percent of Republicans support only Republican positions.
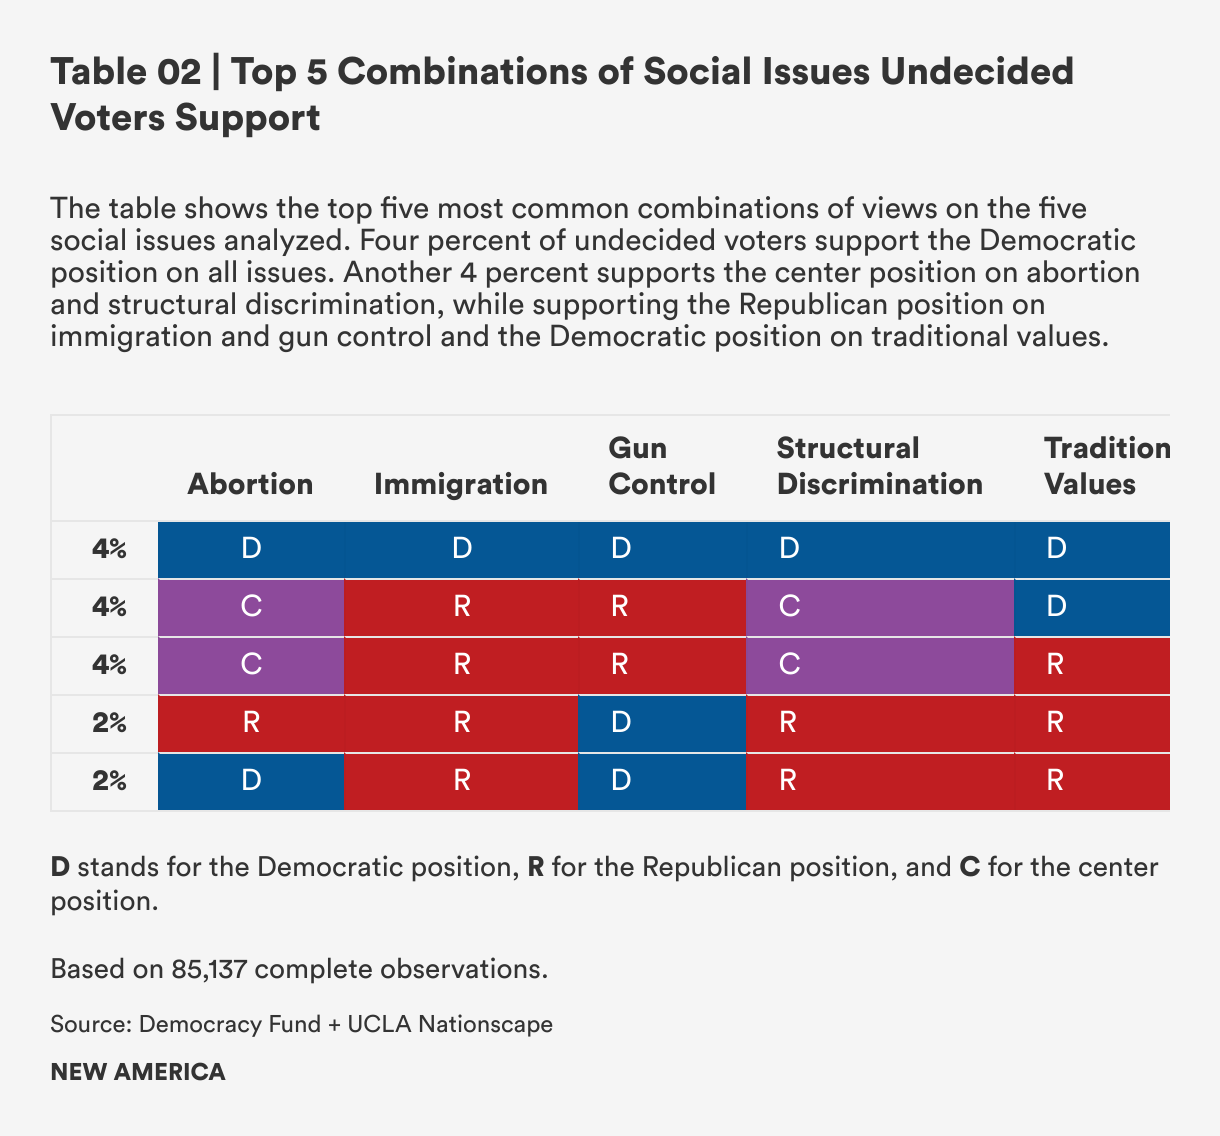
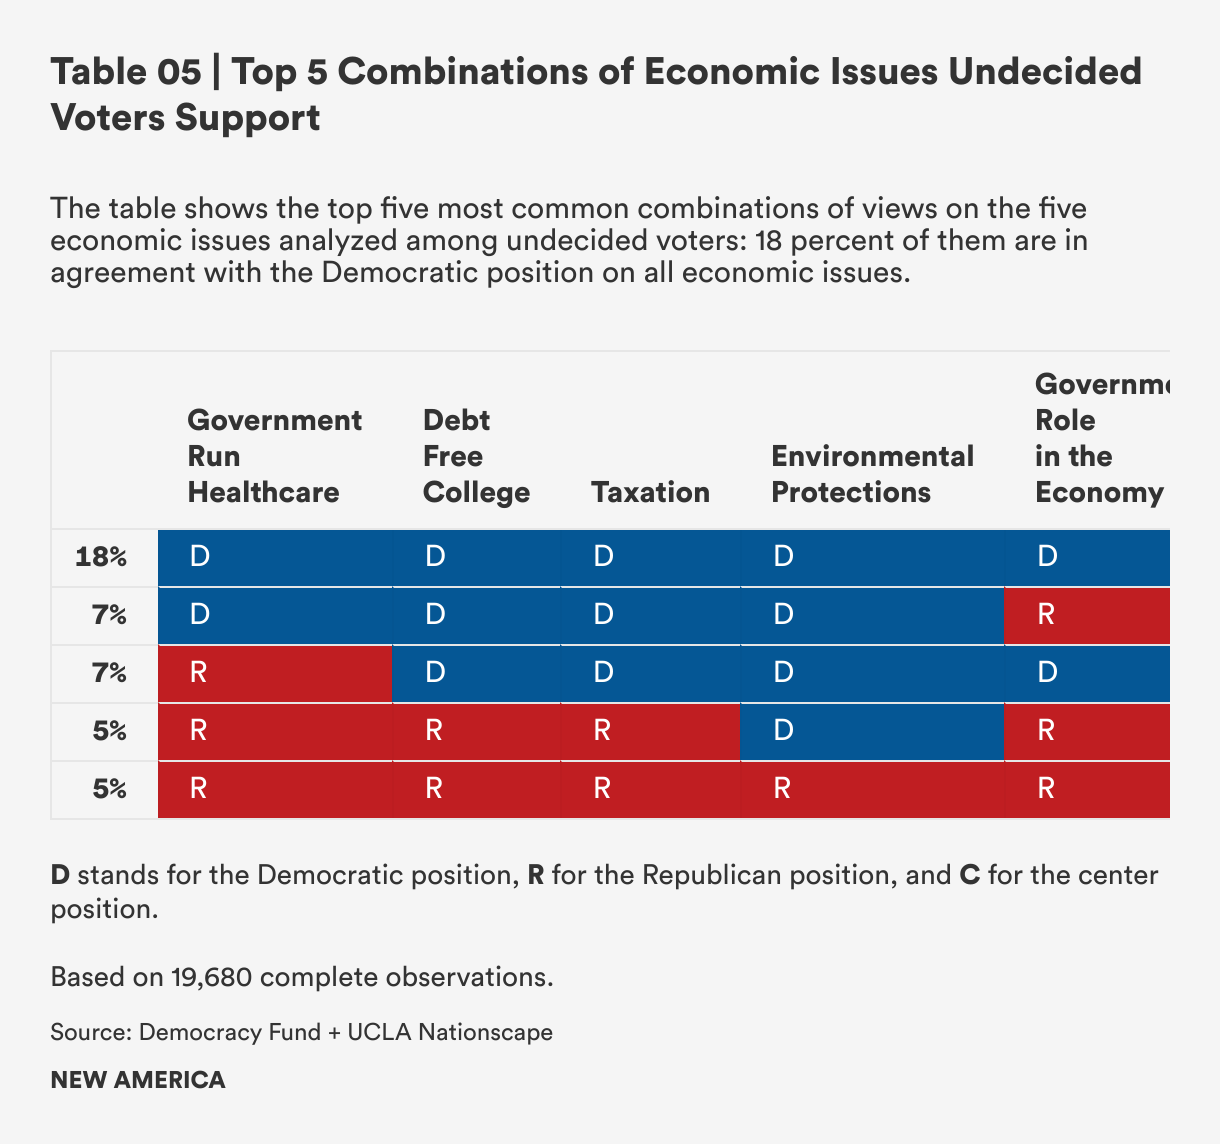
In contrast, only 4 percent of undecided voters are consistent in their views, and they happen to be all Democratic positions. The rest support a variety of combinations of policies. We show only the top five combinations of issues here. About 4 percent of undecided voters have centrist positions on abortion and structural discrimination, Republican positions on immigration and gun control, and Democratic positions on traditional values. That the share of undecided voters is so low across these top five combinations of issues highlights just how splintered they are on their policy preferences.
On the social dimension, several issues generate the most cross-pressures for undecided voters: abortion, structural discrimination, and traditional values. For Democrats, it’s structural discrimination and traditional values; for Republicans, it’s gun control and abortion.
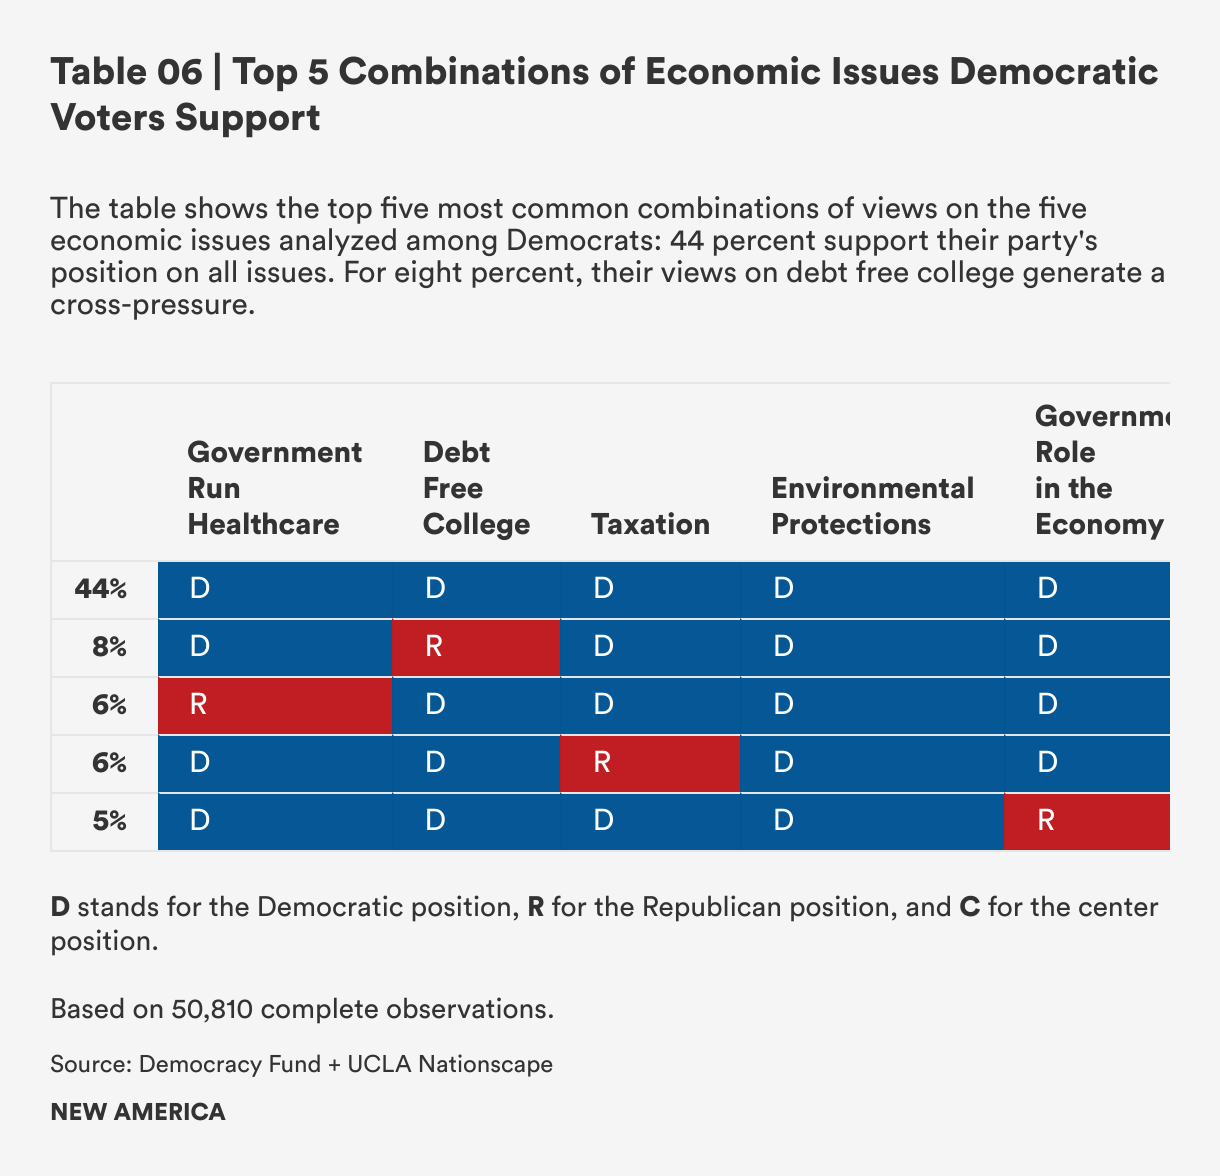
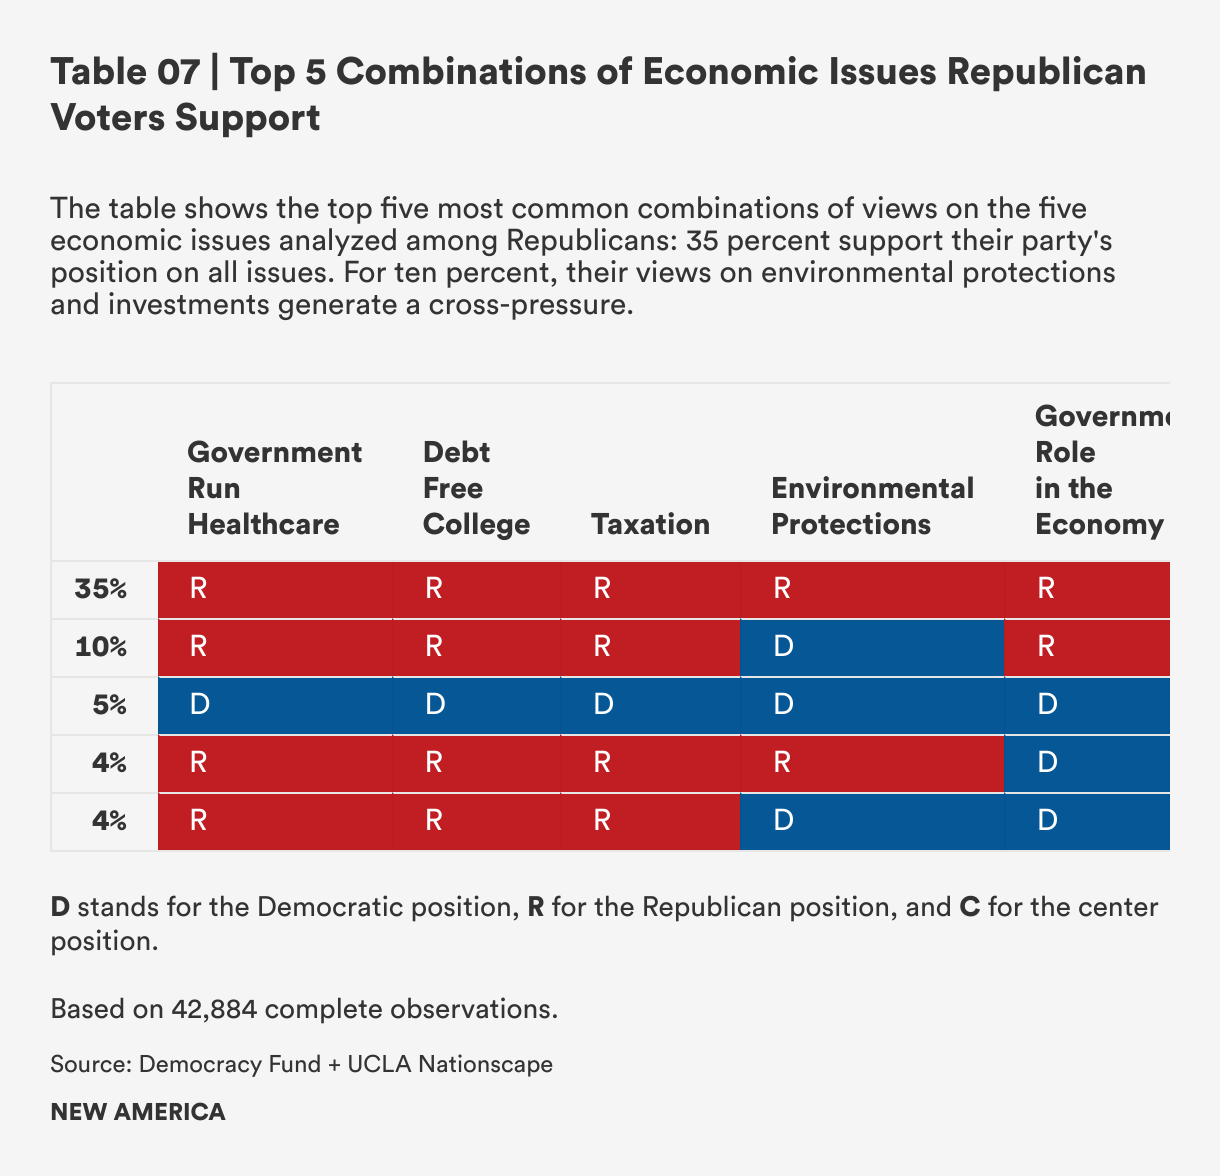
Voters are more in agreement on the economic dimension than in the social dimension. Of Democratic voters, 44 percent have Democratic positions on all issues we analyzed, while 35 percent of Republicans have Republican positions. Again, undecided voters align more closely with Democrats, with 18 percent of them having Democratic positions on all economic issues. For undecided voters, the issues that most cause cross-pressures are those regarding the role of government in healthcare and the economy.
Why Aren’t There More Undecided Voters?
It is perhaps not surprising that voters who don’t consistently agree with one party or the other across issues would not be sure which party to vote for. What is more surprising, however, is that many partisans don’t necessarily agree with their own parties so much, particularly Republicans. Republicans have long been less ideologically consistent than Democrats, which underscores both their ideological diversity and simultaneously the power of partisanship at driving voting decisions and preventing them from becoming undecided.3
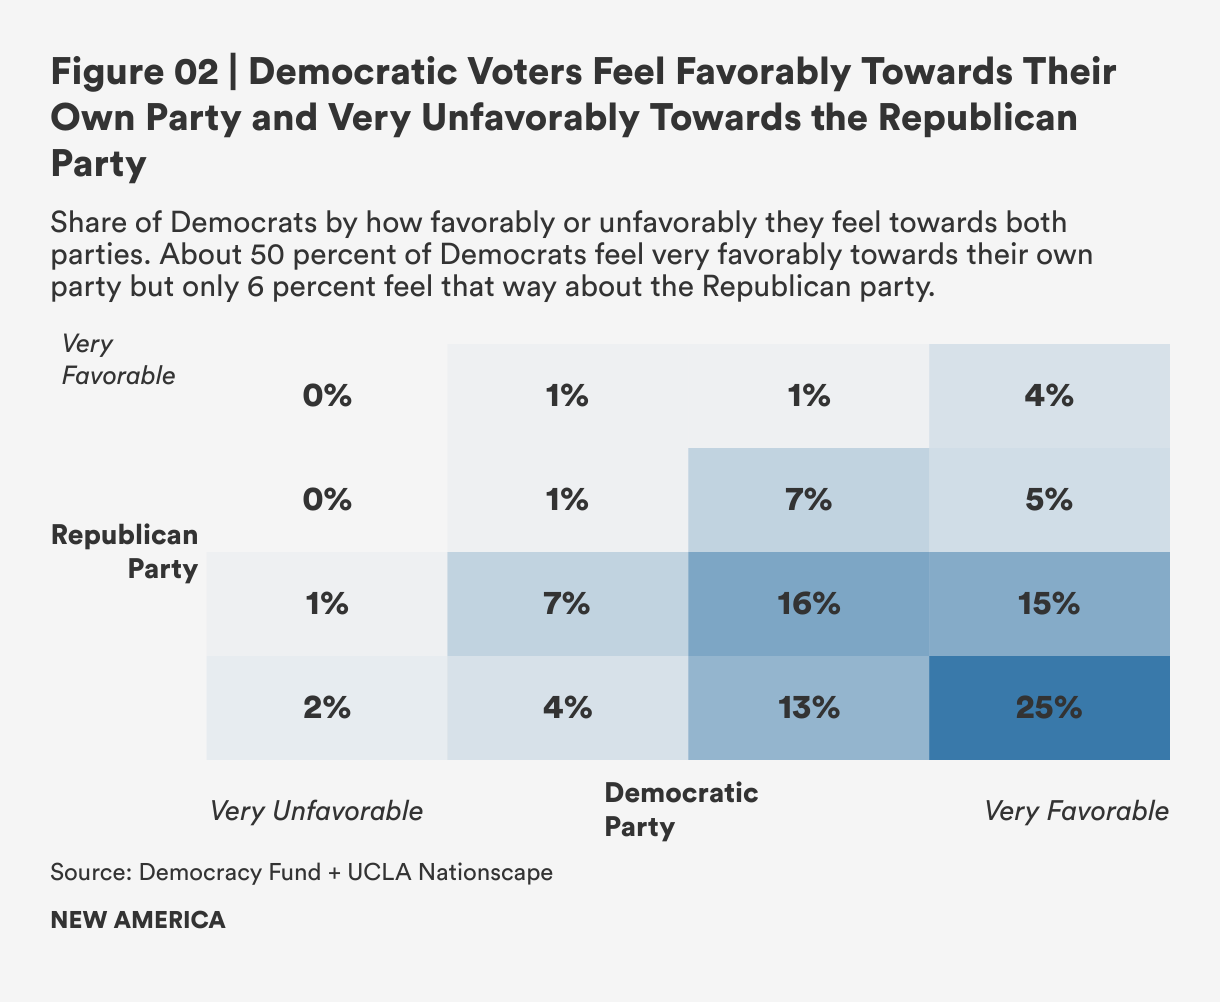
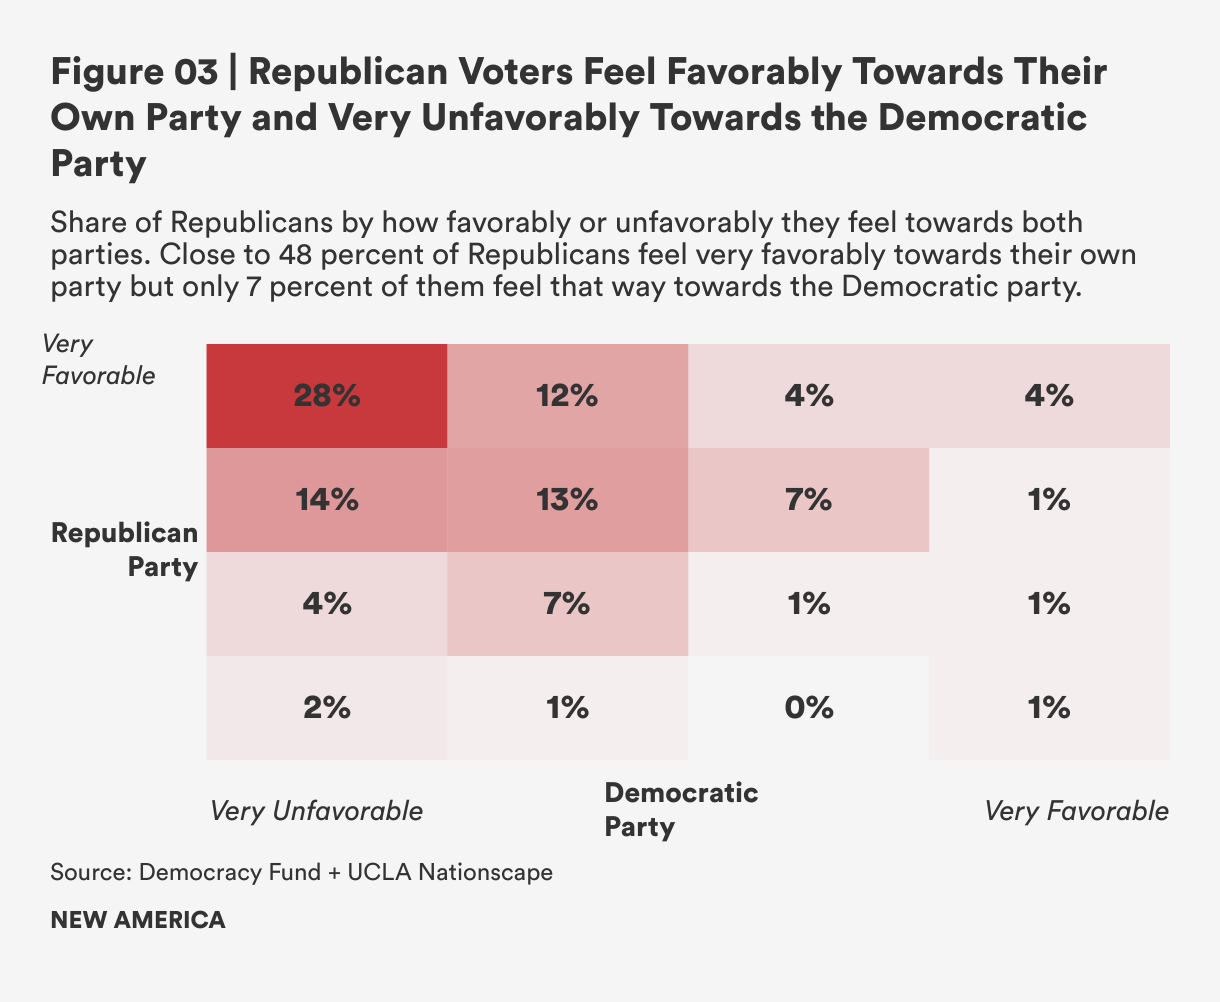
When it comes to favorability towards the parties, Republicans and Democrats look similar. Among Republicans, 44 percent have very favorable views of their party, 4 percent have unfavorable views of their own party and 48 percent are somewhere in between. About 49 percent have very unfavorable views of the Democratic party. Among Democratic voters, 49 percent have very favorable views of their own party and 3 percent have a very unfavorable view of it while 50 percent are equivocal in their views of their own party. About 44 percent of Democrats have very unfavorable views of the Republican party. It is these high levels of unfavorability towards the other party that likely keep partisans from feeling ambivalent and expressing indecisiveness in their vote choice.
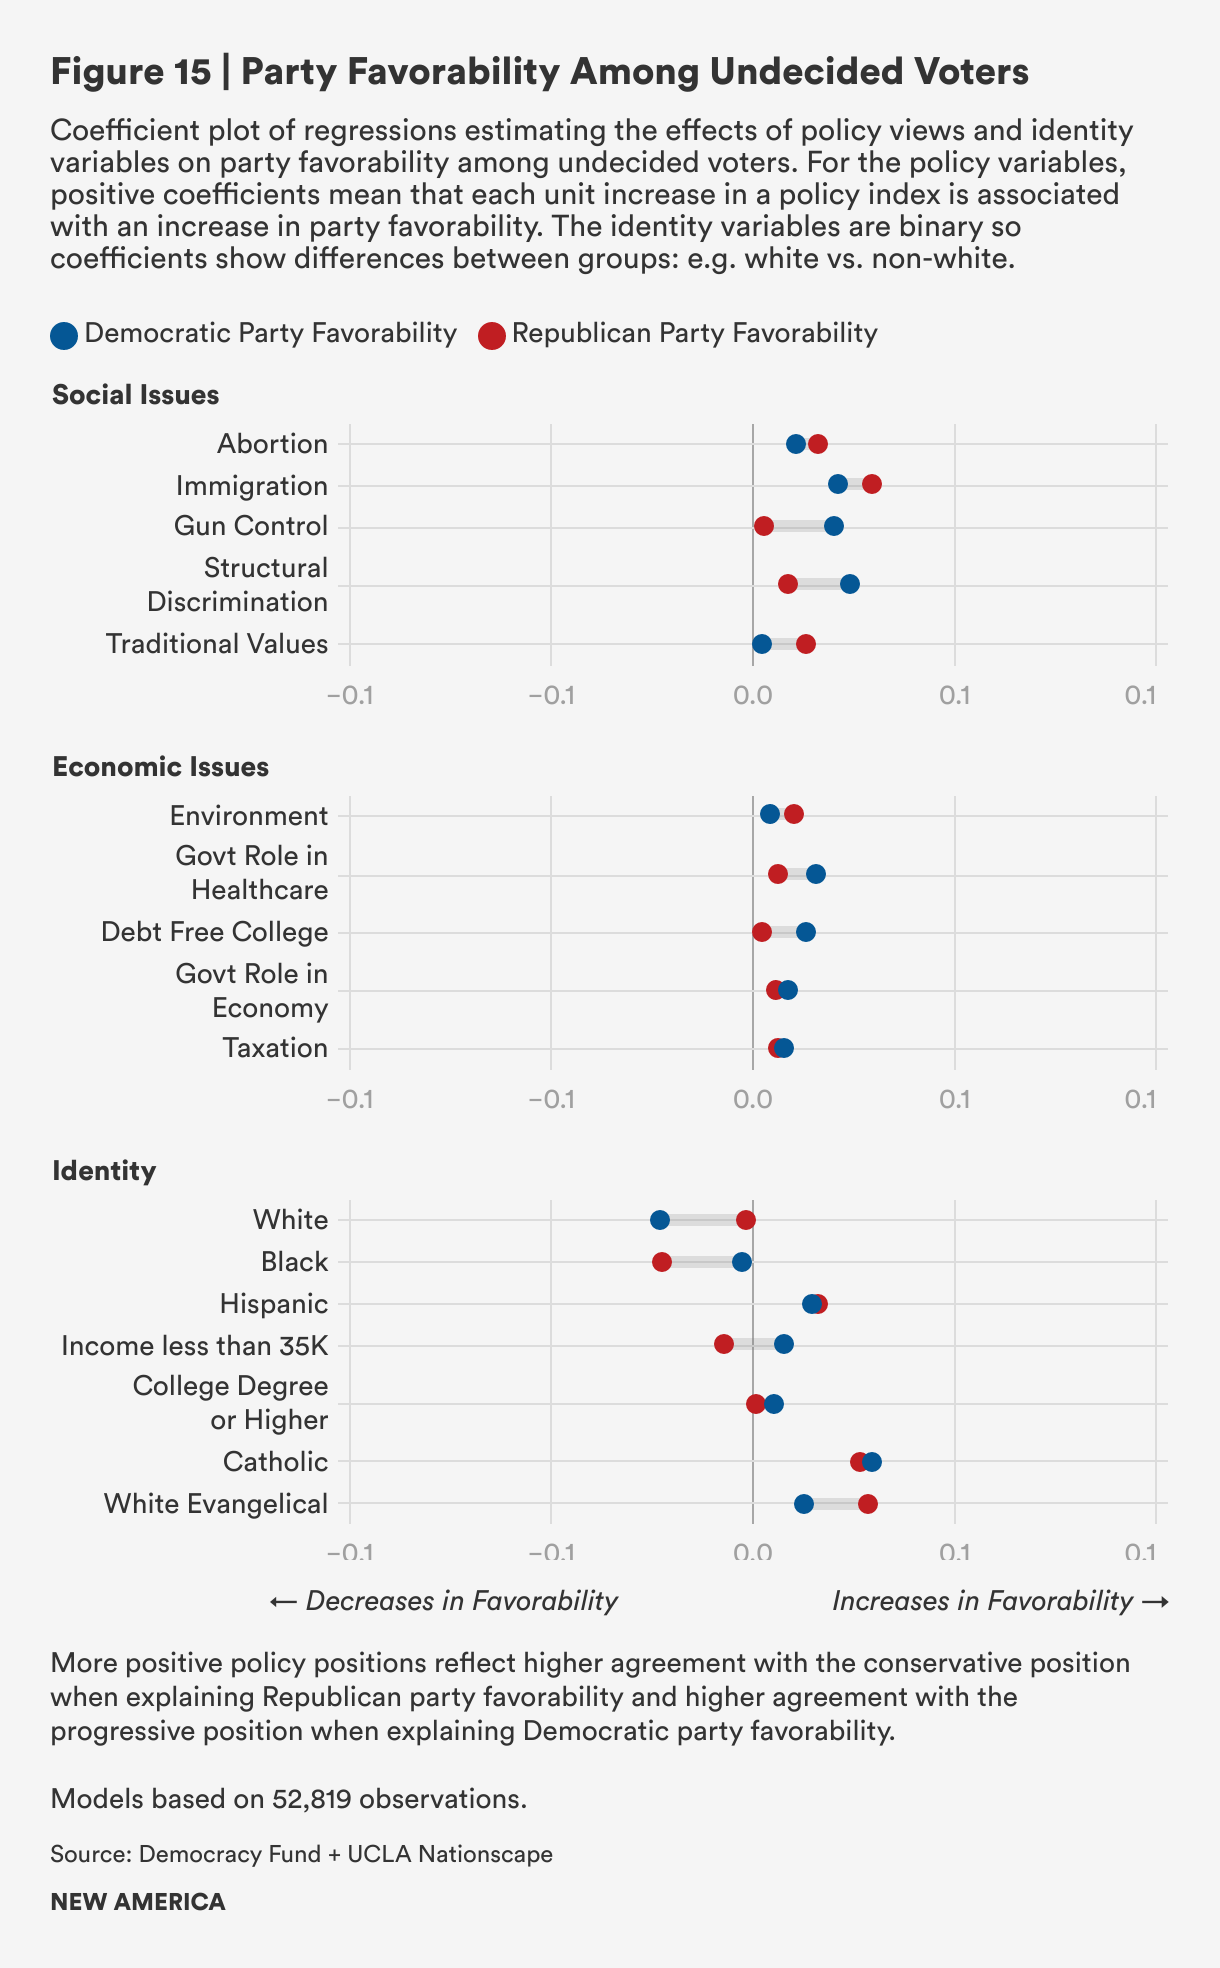
Another consideration is that social and economic policies may not inform voters’ views of parties. We find evidence for this phenomenon when looking at how policy positions affect favorability ratings of parties among voters.
Among undecided voters, how progressive or how conservative they are on policy issues has very small effects on how favorable they feel about the Democratic and Republican party, respectively, controlling for various identity related variables. We find similarly small effects among partisans: small effects of policy positions on how favorably partisans see their own parties and slightly larger, but still small, effects on how unfavorably they see the other party.
4. Undecided Voters and the Future of U.S. Elections
Over the last several decades, the share of undecided voters in U.S. elections has declined. So has the share of swing voters, as has the share “floating voters”—different names for more or less the same phenomenon—the pivotal slice of the electorate that can’t be reliably counted upon to cast their ballots for one party or the other, and therefore becomes the target of all persuasive efforts to build an electoral majority.
Yet, despite endless scrutiny, their preferences and attitudes cannot be reduced to simple averages. They are largely disengaged from politics and hold beliefs that are idiosyncratic mixes of Democratic and Republican policies. Whether they are disengaged from politics because no party represents them well, or their beliefs do not conform to either party because they don’t pay enough attention to politics to hold anything close to a coherent belief system is difficult to say. But clearly, the two reinforce each other.
The seemingly random nature of this group raises obvious questions for the meaning of U.S. elections. The post-election rush to claim a mandate will inevitably happen, but it will rely on flimsy data. We should not be fooled. What counts for a mandate in U.S. electoral politics in 2022 is nothing more than random noise on the edges of two deeply divided and entrenched voter coalitions, with a small group of idiosyncratic voters showing up at the last minute. They have defied a coherent winning formula for elections because they lack anything close to ideological coherence as a group.
This analysis should raise questions about whether the current U.S. electoral system makes any sense, given the ways in which it can narrowly award total power to one side or the other.
By contrast, a political system with more parties would give undecided voters who don’t fit easily within either party’s value system more opportunities to find a party that more closely reflects their values. It also might give them a way to get engaged in politics in ways that neither of the two parties currently do.
Additionally, as we see in our analysis of data, the many voters who hold moderate-to-conservative views on social issues and moderate-to-liberal views on economic policy have no party to represent them. More parties would give more voters a party where they could feel well-represented.
Finally, with more parties, and governing coalitions that form after the election, the future of the country does not need to hinge on which side gets a narrow majority, as if almost by random.
Acknowledgments
We thank Mark Schmitt, Maresa Strano, and Lizbeth Lucero for helpful comments and editing support.
Thank you also to Naomi Morduch Toubman and Joe Wilkes for their graphics and communications support.
Funding for this work was provided by the Hewlett Foundation and Democracy Fund. All positions are those solely of the authors.
Downloads
Citations
- For more information on the survey’s methodology, see source">source.
- We consider respondents as supporting a Democratic position if their position on that issue falls below the median and as supporting a Republican position if they are above it. We consider all respondents, even those who may have skipped questions or who were not asked those questions in the survey in which they participated. Many voters have some policy positions in the middle. To facilitate the analysis, we only show support for the partisan positions and then proceed to analyze the centrist views.
- Robert N. Lupton, William M. Myers, and Judd Thornton, “Analysis | Republicans Are the Party of Ideological Inconsistency,” Washington Post, December 7, 2021, source.
More About the Authors

Oscar Pocasangre
Senior Data Analyst, Political Reform Program

Lee Drutman
Senior Fellow, Political Reform Program