
Table of Contents
- Frequently Asked Questions
- Moving Forward: Voices from the Field
- Introduction
- Landscape of Early Care and Education Financing
- Current Financing for Early Care and Education: Financing a Highly Qualified Workforce
- Current Financing for Early Care and Education: Affordability & Equitable Access
- Current Financing for Early Care and Education: Ensuring High Quality Across Settings
- Estimating the Cost of High-Quality Early Care and Education
- A Vision for Financing Early Care and Education
- Behind the Numbers
- Putting it into Context
- Learning from States and Other Countries
- Tools and Resources
- Graphics and Data Visualization
- Glossary
Behind the Numbers

According to the Transforming the Financing report, the total cost of offering accessible and affordable ECE with a highly qualified workforce in the U.S. amounts to at least $140 billion per year. This “Behind the Numbers” section explains the assumptions the committee made to estimate the cost of a high-quality ECE system, such as child-to-staff ratios, staff compensation, and length of school day. It also breaks down and explains the different types of costs that are incurred when providing high-quality ECE, such as personnel costs and costs related to workforce development. Finally, this section explains how the cost of providing high-quality ECE is distributed between the public sector and contributions from families under different scenarios.
1. What assumptions does the committee make to estimate the total cost of a high-quality ECE system?
The calculation serves as an example for decision-makers working to implement the major recommendations of the Transforming the Workforce for Children Birth Through Age 8: A Unifying Foundation (2015) report. The committee has specified an array of quality-related assumptions to estimate the total cost of a high-quality ECE system, tied to these six principles:
- Financing a Highly Qualified Workforce
-Staff levels and structures: reflect the child-to-staff ratios recommended by NAEYC
-Qualifications: all ECE professionals meet competency-based requirements
-Compensation: all staff, including ECE educators, directors, specialists, and other staff, receive
compensation that reflects their education level, qualifications, and responsibility12 - Affordability and Equitable Access
-Full-day, full-year (40 hours per week, 52 weeks per year3) of ECE services
-Includes young children from birth to kindergarten entry - Easy-to-Administer Financing with Incentives for Quality
-A harmonized system where all costs are lumped and financed together - Variety of High-Quality Service Options
-High-quality, financially sustainable delivery options, including home-based and center-based services - High-Quality Facilities
-Facilities that offer young children opportunities for cognitive, emotional, and physical development
-Immediate costs for modernizing or building facilities (or transition costs) and long-term costs (occupancy costs) for maintenance or rental costs of the space - Quality Assurance and Improvement
-Monitoring and regulation systems
-Quality improvement and accountability systems
2. What costs are needed for high-quality ECE?
Total costs = on-site costs + system-level costs
a) On-site costs:
- Personnel costs (aggregate service delivery costs): staff compensation and benefits, on-site staff supports, and professional development Personnel Costs = unit cost per child-hour x hours of ECE Utilized
- Unit cost per child-hour
- Assume that the transition to high-quality early care and education will occur over a four-phase process
- Hourly costs by age group and by four phases, at each phase:
- A higher share of staff with desired qualifications
- Higher wage linked to each level of education
- Hours of ECE Utilized (see Figure 6-1 on the report)
- Non-personnel costs: include facilities occupancy costs, such as rent and utilities; education equipment and supplies, including technology; office supplies; and food and kitchen supplies
Non-personnel Costs = 8 percent added to the first phase, amount constant across the four phases6
- Reserve (Adjustment Factor): to cover inefficiencies like temporary drops in enrollment, delays in state reimbursement, or nonpayment by families
Reserve (adjustment factor) = A constant 10 percent is added to personnel (i) and non-personnel (ii) costs
b) System-level costs:
- related to system-level workforce development supports and quality assurance and improvement, such as monitoring and regulation, quality and systems improvement and accountability, data systems, and licensing and accreditation
System-Level Costs = a constant factor of 8 percent was added to the aggregate service delivery costs (i) at each phase
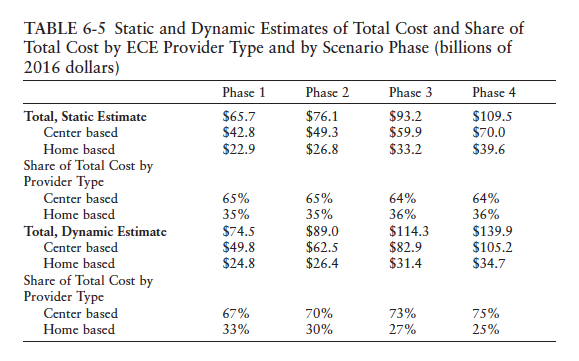
3. How much is the total cost, under dynamic estimate?
a) The annual cost of a high-quality ECE system is $140B, under dynamic estimate
4. Who will pay for ECE?
Total costs = public and private resources + family contributions
a) Possibilities
- Progressive family schedule: targets resources to those most in need, reduces public costs, and retains an additional revenue stream
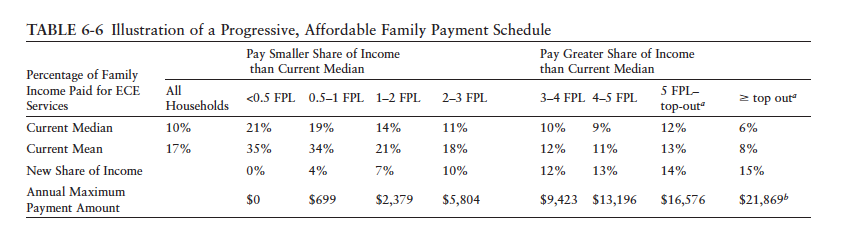
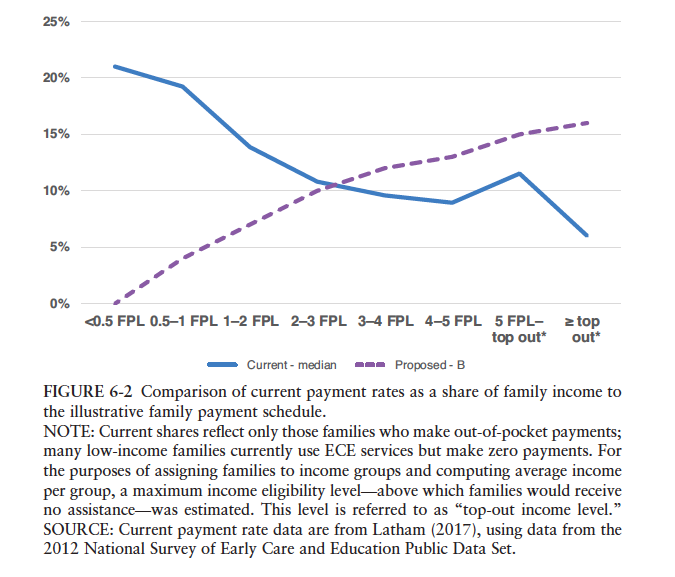
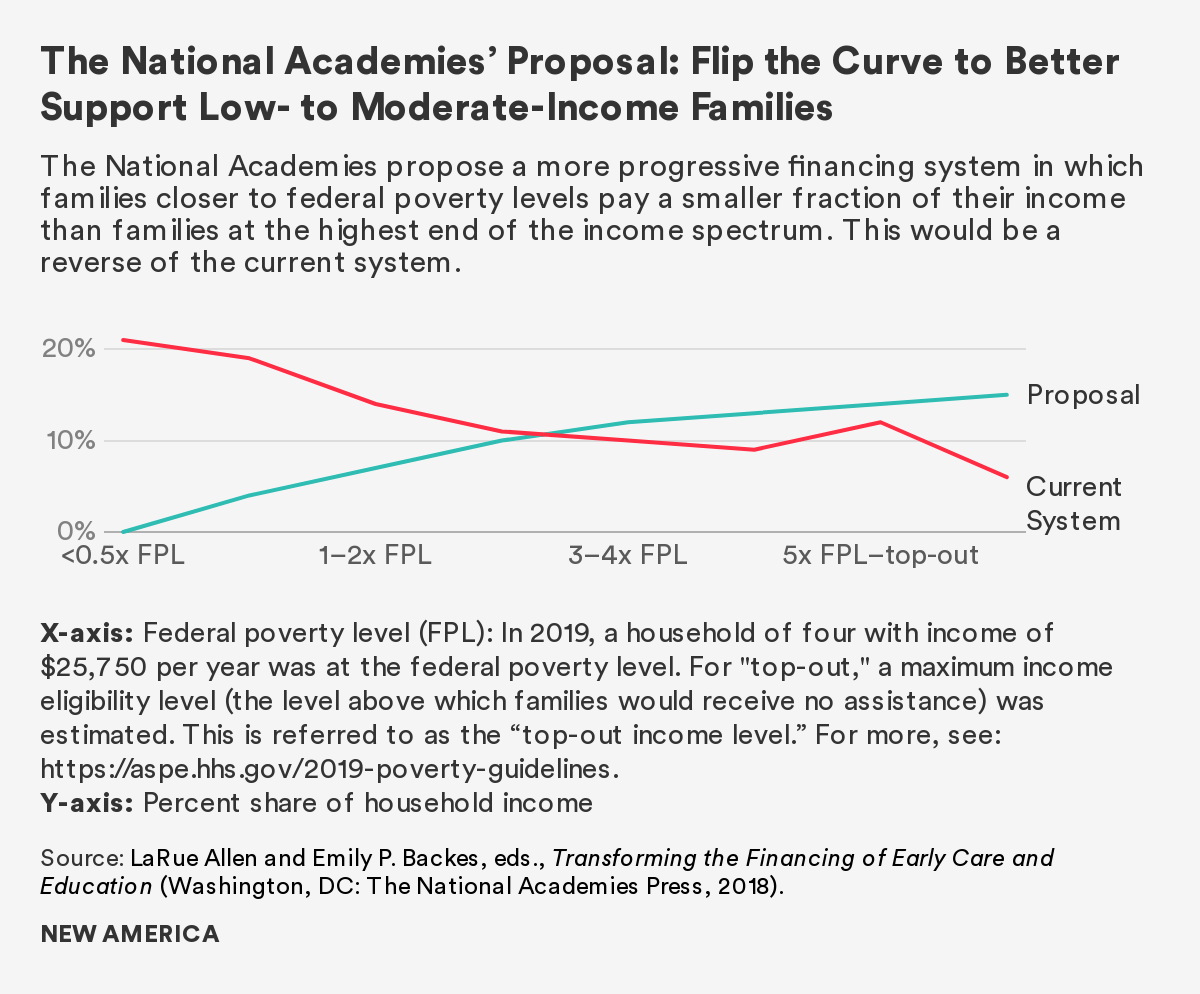
- No fee for families: reduces or eliminates financial barriers to ECE participation, but not charging fees transfers resources from the public to the affluent; target efficiency could be improved if tax revenues for the public share of ECE costs are generated progressively
5. Contextualizing the numbers
If families pay according to the progressive scale, the public/private share will be 58 percent ($82 billion) under the dynamic estimate, which is $53 billion over current public/private expenditures.
| Phase 1 | Phase 4 | |||
|---|---|---|---|---|
| Static | Dynamic | Static | Dynamic | |
| Total Costs in Billions/Year (% of GDP) | 65.7(0.35%) | 74.5(0.4%) | 109.5(0.59%) | 139.9(0.75%) |
| Family Share (%) | 49% | 55% | 36% | 42% |
| Public Share (%) | 51% | 45% | 64% | 58% |
See the Glossary for key word definitions.
Citations
- The committee took a national-level perspective on the cost of implementing high-quality ECE, acknowledging influences from various factors, including complexity in the marketplace; local variations; types of service (center-based, home-based); various kinds of funding and sponsorship, organization structure, and size; and varying costs of providing services to different groups of children. Therefore, the true costs incurred by individual service providers can be very different.
- Adequate levels of compensation include an increased level of benefits (applied equally for all staff positions) and paid non-child contact time and release time for professional development.
- The committee defined key salary levels as: (1) ECE educators with a bachelor’s degree: equivalent to child-family social workers with a bachelor’s degree by phase 2; equivalent to kindergarten educators by phase 4, though not annualized for a full year (12 months) of ECE service. (2) Lead educators: equivalent to kindergarten educators for a 9-month contract in phase 4.
- For the hourly cost calculation, costs were computed on the basis of full-time (40 hours per week), full-year operation (52 weeks per year). For the aggregate cost calculation, two different measures of duration were applied. The weekly hours were multiplied by 52 weeks, then decreased by 5 percent to account for an anticipated decrease during the summer in demand for ECE services.
- For the static analysis, the committee applied the current average hours per week in each type of ECE setting by child-age group, based on Latham (2017) using 2012 data from the NSECE Public Data Set. This result is calculated separately for each family income category.
- The dynamic analysis assumed that as affordability improves, the average weekly hours of ECE used by enrolled children would increase for all age and income groups. Whereas prekindergartners currently spend more time in unpaid ECE settings than younger children, the dynamic estimates assumed a higher participation in full-time programs for prekindergartners.