Table of Contents
Findings
By providing each state a total score, we were able to rank states from 1 to 51 across the four categories. In addition, we ranked each state from 1 to 51 within each of the four categories. This findings section details the total state rankings and each of the category rankings, with specific state mentions and highlights. A deeper analysis can be found in the discussion section of the report.
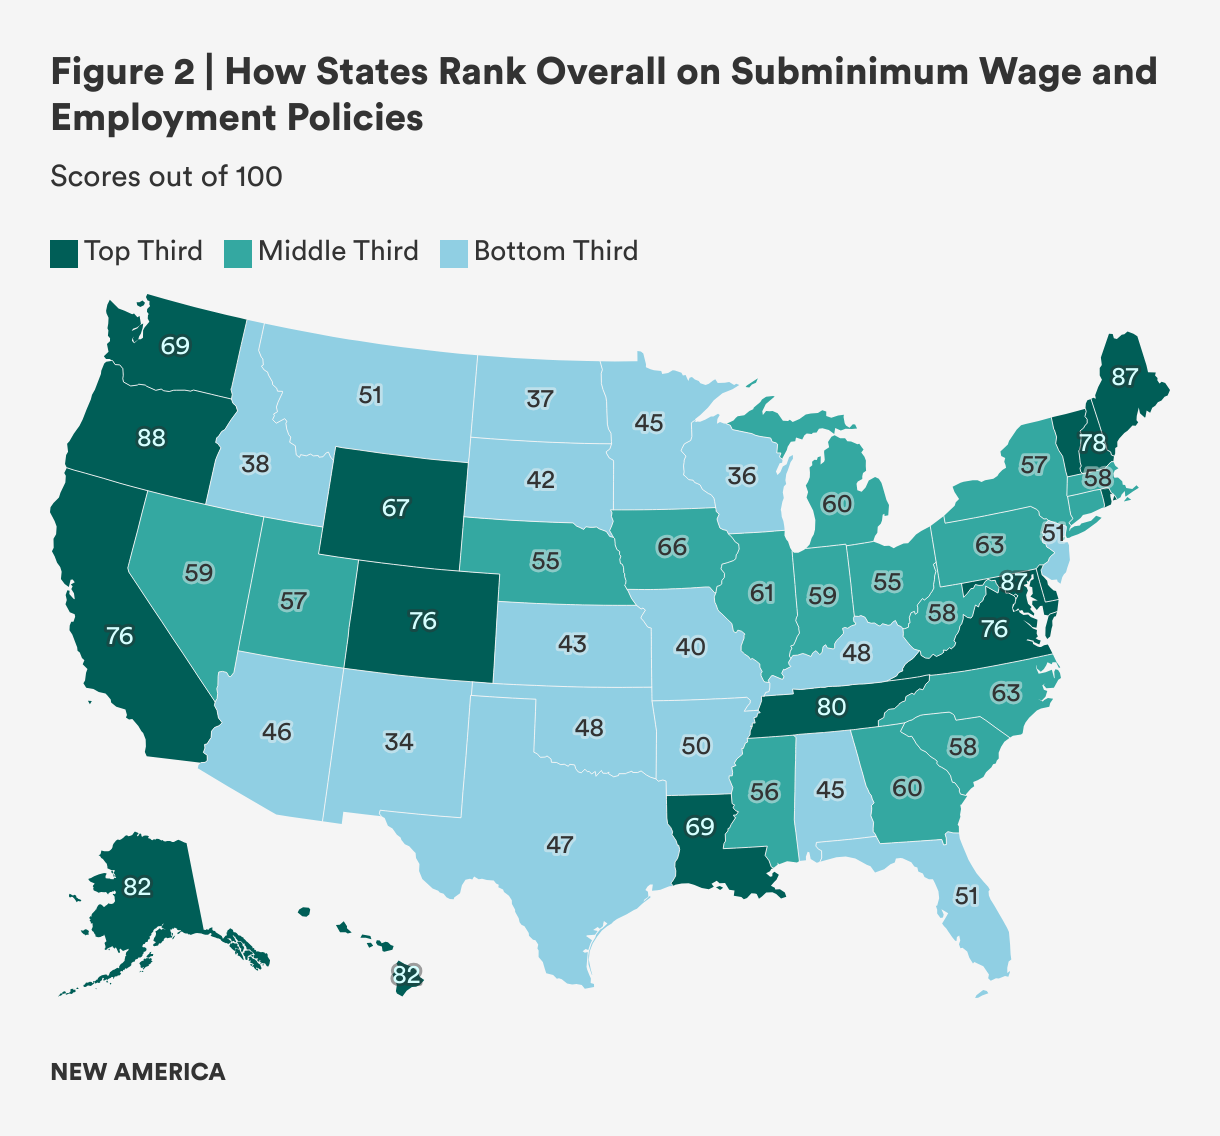
Figure 2, shown above, is a map of the United States showing the total subminimum wage score for each state from the average of all four categories. It also shows states rankings color-coded into the top third of states, middle third of states, and bottom third of states by scores.
Total State Rankings
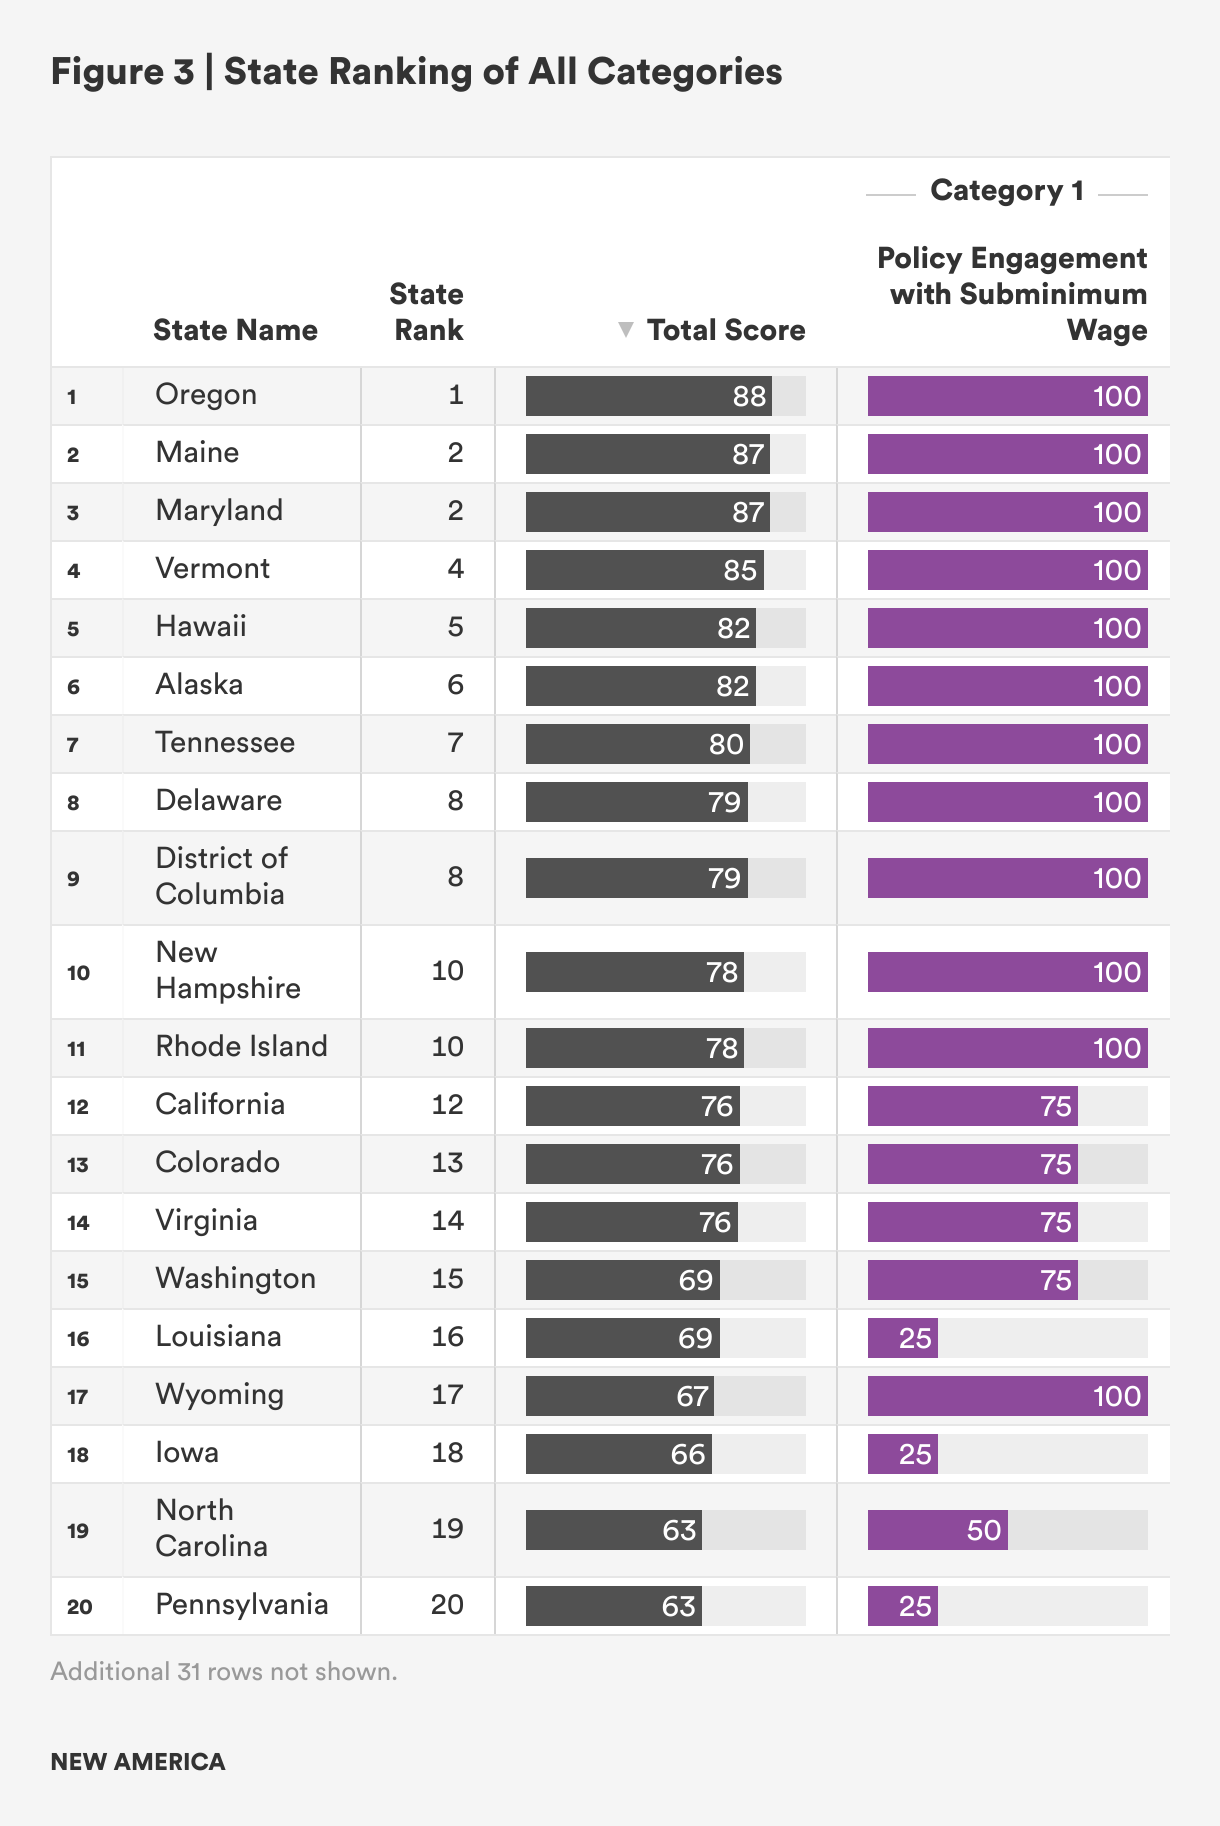
Figure 3 displays the state rankings and total scores across the four categories. Figure 3 also displays the scores for each state within each category that resulted in the total score. Oregon, Maine, Maryland, Vermont, Hawaii, Alaska, Tennessee, Delaware, DC, New Hampshire, and Rhode Island received the top 10 scores, respectively, with Maine and Maryland receiving the same total score to both rank second, Delaware and DC both ranking eighth, and New Hampshire and Rhode Island receiving the same total score to both rank 10th. Ranked lowest, from 42nd to 51st, are Arizona, Alabama, Minnesota, Kansas, South Dakota, Missouri, Idaho, North Dakota, Wisconsin, and New Mexico (note that in February 2024 after the report had been finalized, the Kansas governor signed legislation to phase out the subminimum wage; this would likely impact Kansas's ranking in future analyses). Some states have the same overall ranking, as it was possible to receive the same total score. While clustering was more common within the categories discussed below, there were a few instances of clustering in the total scores.
The total possible score was 100, with the highest scoring state, Oregon, receiving 88.19. The lowest scoring state, New Mexico, received 33.96. The range in the top 11 states (top 10 ranking) was only approximately 10 points and the range within the states with the lowest scores was approximately 11 points.
Rankings by Category
Figures 4 through 7 demonstrate state scores and rankings for each of the four categories.
Figure 4 shows the results of the rankings for Category 1: Policy Engagement with Subminimum Wage. This category included data related to maintaining or phasing out subminimum wage. Based on the data calculated, each state received a score and rank displayed in Figure 3. Many states had the same score and states are listed alphabetically if they have the same rank. Alaska, Delaware, DC, Hawaii, Maine, Maryland, New Hampshire, Oregon, Rhode Island, Tennessee, Vermont, and Wyoming all received a 100 and tied for rank 1. These states have eliminated subminimum wage. This grouped California, Colorado, South Carolina, Virginia, and Washington in the next rank (13) with a score of 75, the next highest score. This group of states have active phase-out procedures underway. A score of 50 was equivalent to having ongoing efforts to remove subminimum wage. A score of 25 was equivalent to using subminimum wage at this time without information available on an active process to remove. Kansas and Missouri both scored 0. These two states received no points, as instead of trying to eliminate the subminimum wage, they were acting to maintain and use subminimum wage at the time of our analysis.
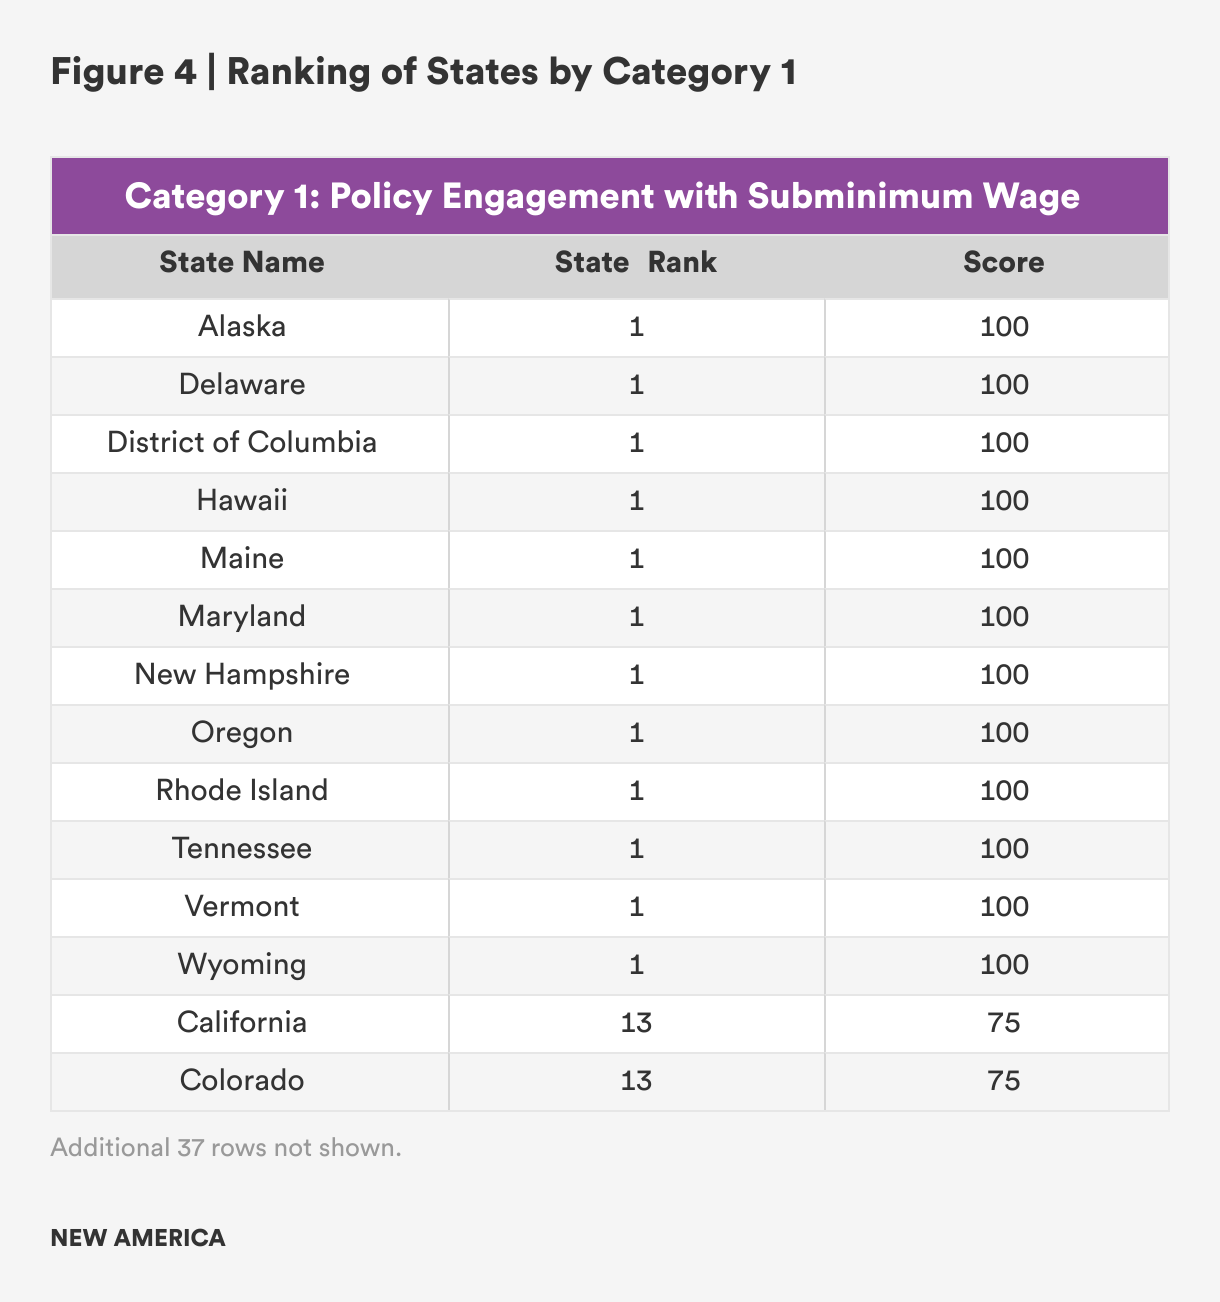
Figure 5 shows the second category, on the use of subminimum wage, with data from July 2018 and July 2023. There was some clustering of scores and ranks at the top, with more variation throughout the rest of the category. States that had previously eliminated subminimum wage (New Hampshire and Vermont) and states that moved to eliminate it (Alaska, Delaware, DC, Hawaii, Maine, Oregon, Rhode Island, Tennessee, and Wyoming) all received a score of 100 out of 100 and ranked 1.
This category showed change over time. More reduction and change resulted in a higher score, as we measured and scored percentage of change from 2018 to 2023 for workers paid under the 14(c) certificates and the number of issued certificates to employers. States that began with low numbers and still made a significant reduction received a high score, just as states that began with high numbers and made a significant reduction. States that kept numbers steady had less of a percent reduction and earned a lower score.
Twenty-three states had scores of 75 or higher in this category. Fifteen states had scores less than 50. Missouri had the least overall change in number of workers employed under 14(c) certificates and reduction in use of certificates, resulting in a ranking of 51 and score of 19.7.
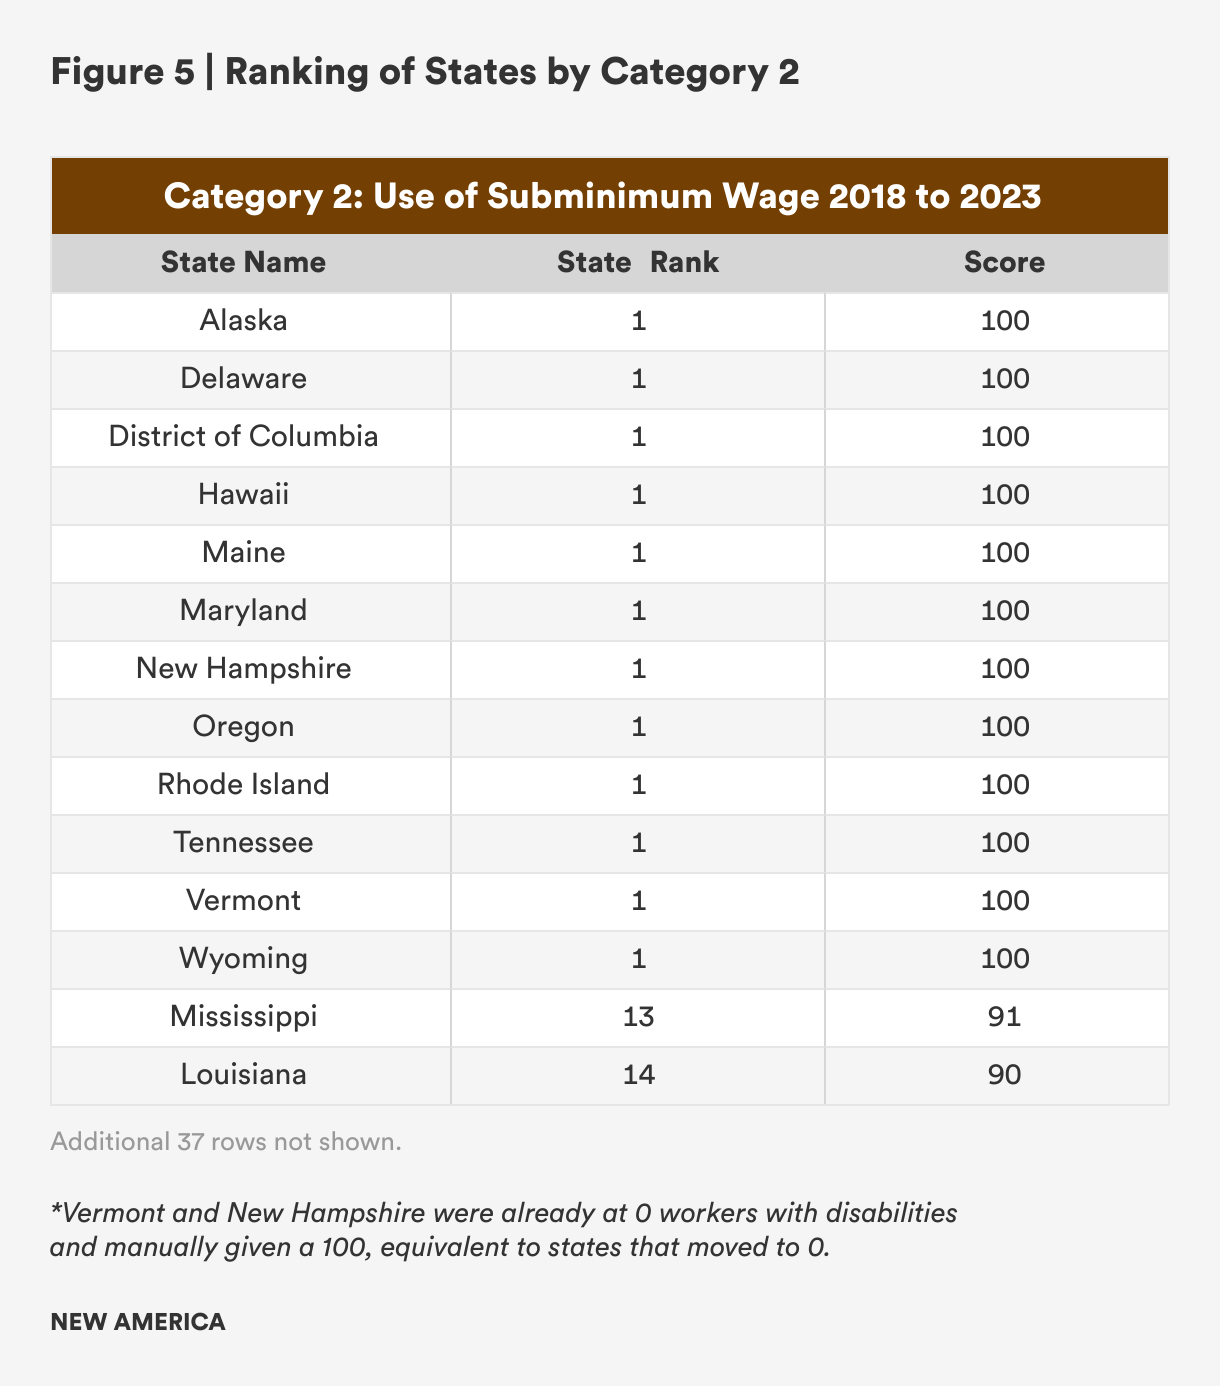
Figure 6 represents the third category, proactive employment policy and funding initiatives. This category included information from three distinct groups of data: the DIF, Employment First, and Medicaid expansion. Despite three separate elements of data used to build this category, there was still quite a bit of clustering because of the binary nature of the scoring. The total score displayed for each state is the average of the three elements. Thus, the category represents state employment system supports for the (a) reduction of subminimum wage, (b) expansion of employment opportunities for disabled workers, and (c) appropriate support within employment.
California, Illinois, Pennsylvania, Vermont, and Virginia received the highest score of 88.9 out of 100 and each received a rank of 1. Alabama, Mississippi, and Tennessee received a 33.3, the lowest score of the states and a rank of 49. Most states clustered around ranks 20 and 30, with scores of 66.7 and 61.1, respectively. The majority of the states, 37, scored 61.1 or above. This was a very strong category for most of the states.
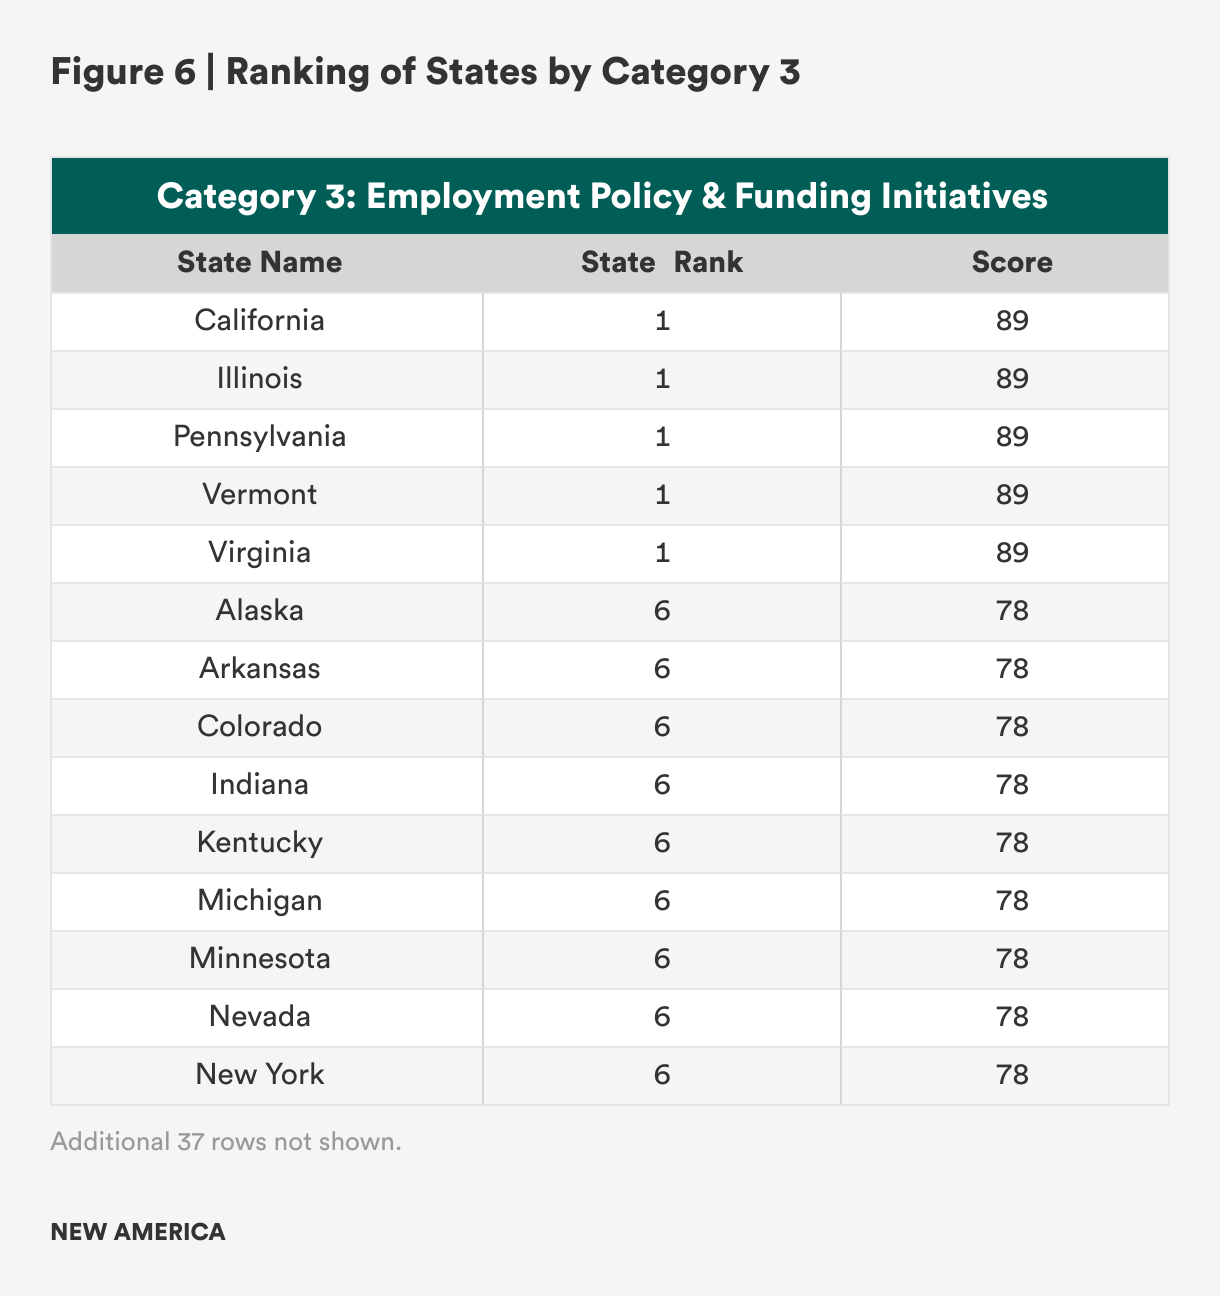
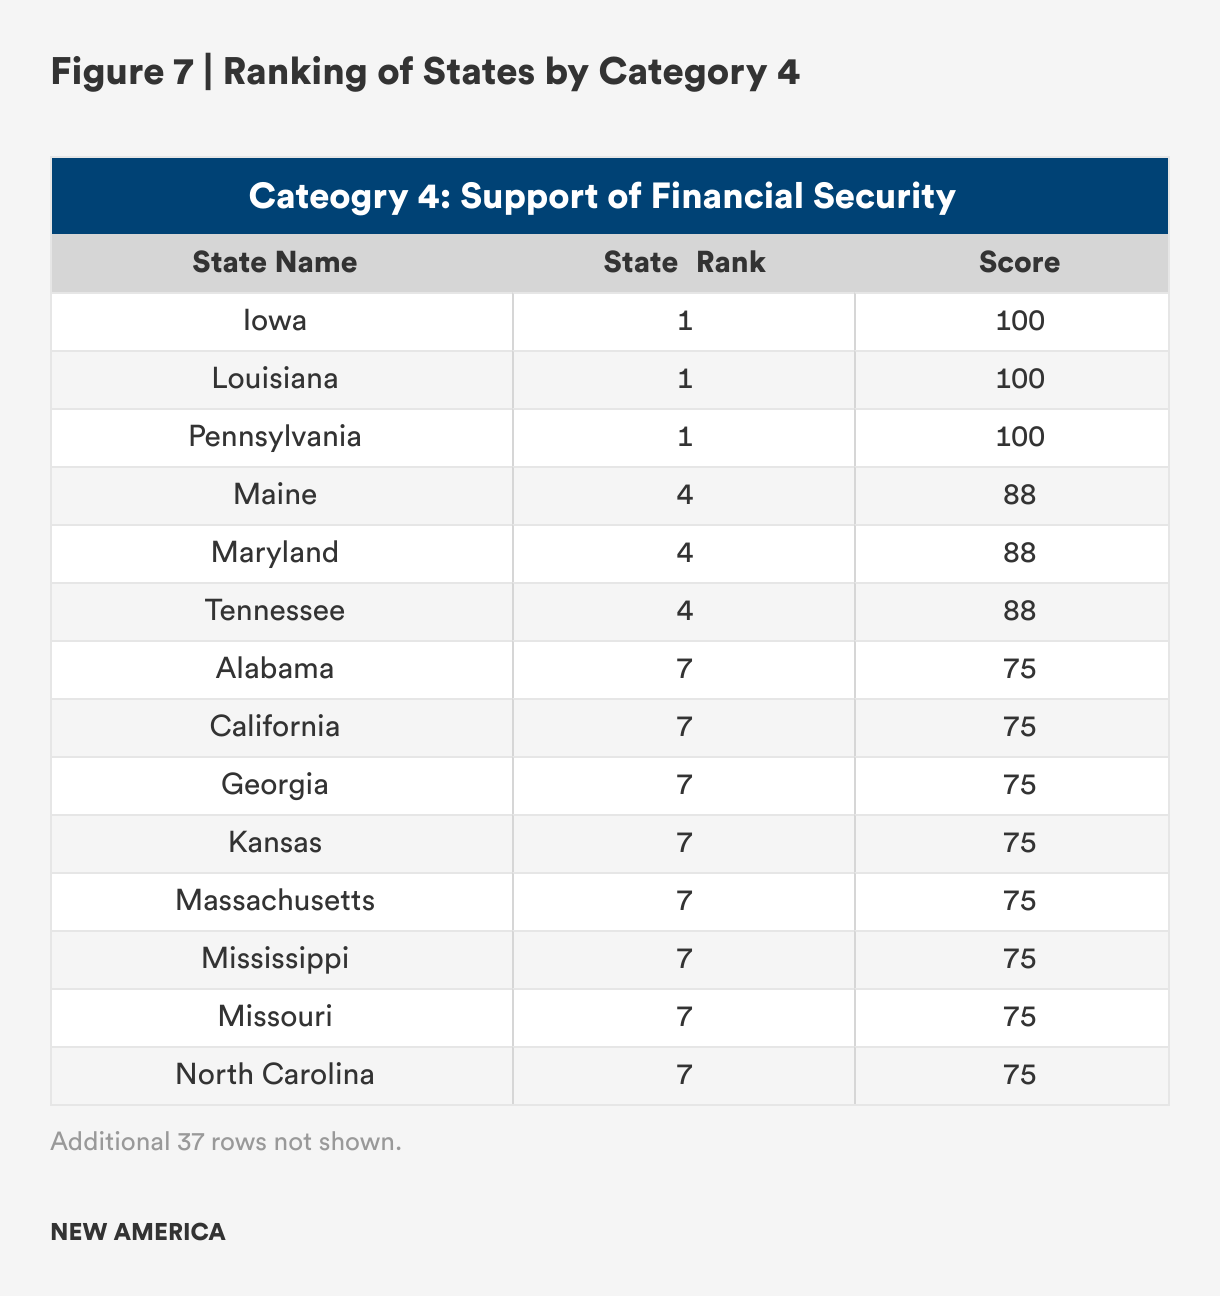
Figure 7 shows the fourth and final category, support for individuals’ financial security. This category included benefits information from a variety of datasets. Data came from WIPA, general benefits provided in states, and ABLE account information. The goal of this category was to capture statewide information about how disabled employees are supported through the web of benefits navigation when they transition from subminimum wage to minimum wage.
The total state score is an average of four different scores in the category. Like the other categories, there was some clustering, particularly around the middle-range scores. Iowa, Louisiana, and Pennsylvania all received scores of 100, resulting in ranks of 1. Maine, Maryland, and Tennessee were close behind, with scores of 87.5 and ranks of 4. Idaho, New Mexico, Wisconsin, and Wyoming received scores of 25 and ranks of 46. Most states, 34, received scores between 50 and 75, ranking between 7 and 33, respectively. North Dakota and South Dakota received scores of 0, resulting in ranks of 50. This category significantly separated out states with a big impact on total scores and rankings, seen in the top 18 and bottom 11.