

Real GDP in
China has grown at an average rate of nearly 10% annually for the 30 years from
1980 to 2010, exceeding the real growth of any other country over this period.
This performance has been a source of amazement to academics and business
people, and a source of immense pride to the Chinese. Certainly countries
have grown rapidly in the past, but such growth has generally abated in time;
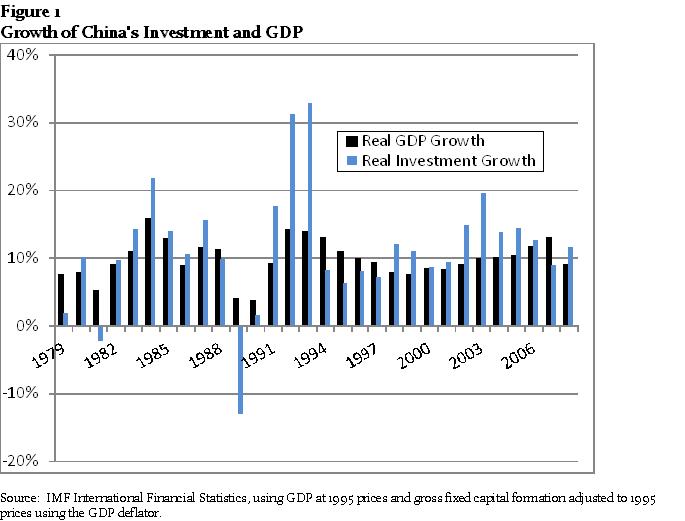
30 years is a very long run. As shown in Figure 1, the growth has not
been uniform. Rather, it has been concentrated in three bursts of 5-6
years duration, each associated with high growth in capital investment. I
shall briefly explore the reasons for each of these high-growth periods.
The first growth phase was caused by the unleashing of Chinese
entrepreneurship by Deng Xiao-Ping in the 1980s. In Huang’s (2008)
account, Deng put particular emphasis on the countryside via the Township and
Village Enterprises (TVEs) which were in fact private enterprises at the
village level, and which benefited during the 1980s from significant financial
support and political encouragement. This growth program brought benefits
that were widely distributed around the country. Notably, it was not
export-oriented.
By the early
1990s, the second growth phase, a new dynamic was in place. Political
leadership shifted to a group of Shanghai-oriented politicians who emphasized
investment in coastal areas that could produce export goods at the lowest
possible prices, based on young labor imported from the inland provinces.
This was initially based on producing labor-intensive goods such as
clothing, shoes and toys. However, it soon evolved into a processing or
assembly model that produced more sophisticated goods by importing components
and assembling them based on cheap labor imported to the coast from the inland
regions. TVEs were de-emphasized and dwindled as a source of growth.
During this
period China benefited from another special factor: the offshore Chinese
community including Hong Kong. As is well known, people of Chinese
background have long dominated the business communities of Southeast Asia,
owning a very large proportion of the private businesses in countries such as
Thailand and Indonesia. Singapore was and is primarily a Chinese city-state.
The offshore Chinese community was able to supply not only capital, but
more importantly management skills and market access that China still lacked.
Hong Kong,
which was under British rule until 1997, reverted to Chinese control in that
year. Anticipation of the handover triggered major new opportunities for
the wealthy entrepreneurs of Hong Kong to engage with mainland China. The
export processing model was often implemented by a partnership between a
factory on the Guangdong mainland and a “front office” in Hong Kong that
handled management, marketing and finance.
As the
export model matured in the early 2000s, a third factor produced a final growth
spurt: for a number of reasons, credit to consumers in the United States
and certain countries in Europe (notably the U.K., Ireland, Iceland and Spain)
became much more freely available, particularly through mortgage markets.
This led to a housing and stock market bubble, and wealth effects
stimulated increased consumer spending in those countries. China was a
substantial beneficiary of this increased spending, which stimulated the third
growth episode illustrated in Figure 1.
Many people
take continuation of Chinese growth for granted; after all, China seemed to
sustain high growth through the East Asian crisis of 1997-1999 and the
financial collapse in the industrialized world in 2007-2009, when many other
countries slowed or turned down. Yet growth should never be taken for
granted: it does not happen by itself, but results from specific
underlying changes and opportunities. Growth, by definition, is change;
and change, by definition, is not permanent. It requires constant effort.
The Chinese
government seems determined to sustain 8-12% growth for as long as possible.
Yet the government itself acknowledges that this may not be feasible.
Premier Wen-Jiabao said this at the National People’s Congress press
conference in March, 2007: “The biggest problem with China’s economy is
that the growth is unstable, unbalanced, uncoordinated and unsustainable”.
Japan offers
the closest historical parallel to China’s recent growth. Japan’s real
GDP grew at double-digit rates from the mid-1950s through the mid-1970s; many
Western observers worried that Japan’s disciplined workforce, work ethic,
quality products and careful management would cause it to dominate the world
economy, much as many Western observers today worry about China taking over the
global economy. But after a spectacular 1973, Japan’s growth began a
long, gradual decline, as illustrated in Figure 2. By the 1980s it was in
the 5-7% range, but it was being artificially sustained by financial excesses:
Japan’s banks were massively over-lending in this era, leading to
inflation of equity and real estate prices, much as the subprime bubble
artificially boosted U.S. growth in the 2000-2007 era. Japan’s financial
bubble burst in 1990, whereupon its GDP growth dropped to nearly zero.
There is
ample reason to believe that China’s growth is being artificially sustained by
financial excesses at the present time. As will be discussed more fully
below, its response to the industrial world recession of 2008-2010 has been
over-lending by the Chinese banks, leading to substantial inflation of wages,
equity values and real estate prices much as happened in Japan. The
longer this continues, the more painful the comedown is likely to be.
The first
section of this paper explores investment-driven growth, first in theory and
then as it has worked in China. I explore diminishing returns, the
efficiency of Chinese investment and particularly the concept that growth by
investment can be value-destroying. The second section explores
export-driven growth, first in theory and then as it has worked in China.
China has enjoyed large-scale Ricardian benefits of trade due to
globalization and the debt-driven consumption excesses in the United States and
Europe during 2000-2007, but rising price and wage inflation will likely limit
the export model’s future.
The third
section asks how readily China can shift from investment- and export-driven
growth to a more sustainable model based on domestic consumption. This is
the express goal of the government, but formidable obstacles stand in its way.
Above all, the Chinese people are poor: the returns to capital in
China have been high but the returns to labor have been extremely low.
The low wages and famously high saving rate of the Chinese people feeds
the investment and export models, but must change materially to support
domestic consumption as an engine of growth. Indeed, China is now seeing
some very large wage increases, and these must be sustained over many years to
bring China’s consumption levels closer to the norm in other countries.
But the effort to build consumption by raising wages will undermine
existing exports. The consequence may be a substantial pause in Chinese
growth as one growth model is phased out and the other is phased in.
Investment
Driven Growth
Diminishing
Returns
China’s
fundamental growth strategy over 1980-2010 has been massive investment in
physical capital, facilitated by high savings rates both in households and in
state-owned enterprises, and by government control over banks. Economists
have long observed that a society can choose to defer consuming some of its
output and instead invest this amount for the future, which will accelerate the
society’s rate of economic growth.
This is
formalized in the well-known Solow model.1 In this model
capital has diminishing returns to scale: absent innovation, adding more
and more physical capital generates growth so long as the economy’s savings
exceed the depreciation of the capital stock, but sooner or later depreciation
of the growing stock must catch up with savings. As the charge for
depreciation grows, returns to invested capital decline and the growth must
slow to zero.
Diminishing
returns can be offset, however, by technological innovation. This term is
understood quite broadly, incorporating not only physical inventions but more
importantly management improvements, new products and new markets. When
these are incorporated into the model, growth generated by capital investment
is augmented by the rate of innovation, and in the long run growth still slows
but only to the rate of innovation. The broad definition of technological
innovation opens many opportunities to evade or at least postpone declining
returns to scale. In particular globalization, by opening borders to a
freer flow of goods, services, capital, people and ideas, provides many
opportunities for growth to those countries willing and able to take advantage
of them. China has been a primary beneficiary of the rise of
globalization during the 1990s. It has benefited greatly from Western
technology, management, ideas and markets.
The increase
of real GDP (or GDP per capita), however, is not a complete economic goal:
the quality of growth matters. For example, is the growth
sustainable? Is it driven by increasing inputs of capital and labor or by
more efficient use of these (productivity growth)? Does it create value
or destroy it?
China has
grown primarily through heavy investment in capital plant over many decades.
In fact, gross fixed capital formation has increased steadily from 29% to
42% of GDP over 1980-2010, and many analysts have expressed concern that some
of this rising tide of investment is inefficient. This fear seems
particularly plausible since most of the investment is made by state-owned
banks lending to state-owned companies. State-owned enterprises
everywhere are prone to economic inefficiency because they serve political and
social objectives in addition to purely economic ones. China, to its
credit, has attempted to distance its state owned enterprises from direct
political control, but this is not always successful.
Investment
Efficiency
Increased
capital investment does not by itself represent GDP growth: capital
investment is a use of GDP, but whether it leads to future GDP growth depends
entirely on how efficient the investment is. Capital investment only
produces growth if it leads to greater production of products that can
profitably be sold. Investment in infrastructure, for example, may
briefly provide jobs but thereafter lead to no growth at all; Japan invested
heavily in bridges, roads, tunnels and similar projects over 1991-2006 but this
did not stimulate any significant economic growth.
A common
measure of investment efficiency is the incremental capital/output ratio
(ICOR), the ratio of new capital investment to growth in GDP. This can be
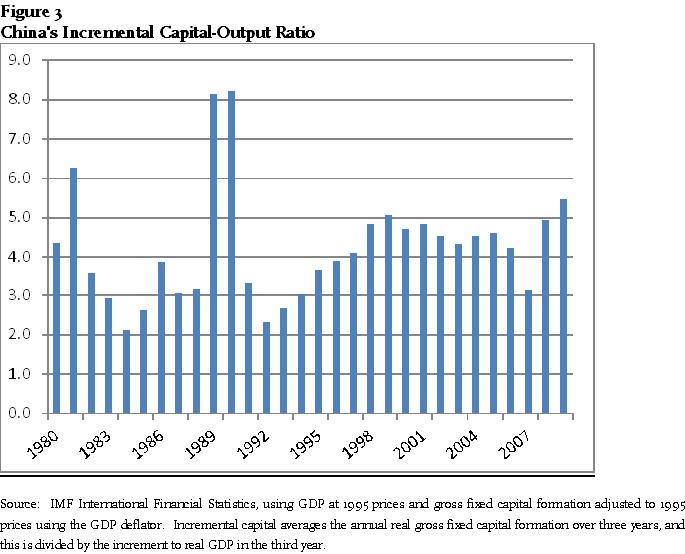
computed in a number of ways. Figure 3 shows the ratio of average real
capital investment over each year and the two preceding years, divided by the
increment to real GDP in the current year. An ICOR of 3 or less is
generally considered good, while an ICOR of 4-5 suggests inefficient
investment. As shown in Figure 3, China’s ICOR was less than three only
twice: in 1983-86 (the first growth phase) and again in 1992-95 (the
second growth phase).
That is, one
could say that the first and second growth phases were highly efficient,
bringing important productivity gains. After 1994, however, growth
gradually subsides and ICOR rises, i.e. diminishing returns begins to set in.
As will be show below, a substantial portion of investment in the later
1990s proved to be value-destroying, leading to large losses in the banks.
Then in 2000-2007, the heyday of the export-driven model and of Western
consumption and borrowing excesses, investment rises again, but ICOR remains in
the 4-5 region except for the crest year of 2007. When the financial
crisis hits and massive lending ensues, inefficient investment reasserts itself
as ICOR jumps to over 5.
Academics
have examined investment efficiency in China using various methodologies.
Based on firm-level data from a sample of 12,400 firms in 120 cities in
China, Dollar and Wei (2007) concluded that even after a quarter century
of reforms state-owned firms still have significantly lower returns to capital
than domestic private or foreign-owned firms. Based on aggregates at the
provincial and national levels, He, Zhang and Shek (2007) found that the
marginal product of capital has been relatively high for two decades and has
not shown clear signs of decline, but this result was stronger in the coastal
provinces than in the inland. They also found, however, that the rate of
investment in China has consistently exceeded the share of capital income in
GDP, implying that the rate of investment is too high and dynamically
inefficient.
Value
Creation and Destruction
A related
question is whether the capital investment creates or destroys value.
Value is a financial concept, and finance has only a marginal role in
classical macroeconomic models, which focus almost exclusively on the real
economy. But value matters. If we could accurately estimate the
future cash flows of all the firms in the economy and discount these to present
value at an appropriate cost of capital, the result would be the value of the
firms in the economy. The rule in corporate finance is that new capital
expenditure creates value if its return exceeds the cost of capital, but
destroys value if its return is less than the cost of capital.
Value
destruction may lie hidden for years and only gradually become apparent.
Its eventual price is real, however, and is borne by the suppliers of
capital. In a market-based financial system, capital suppliers sensing
hidden value destruction first become nervous and yuan risthen may rush for the
exit, with prices of stocks, bonds, real estate and/or currencies suddenly
falling. The resulting crisis is painful, but the sharp pain signal
typically calls attention to the underlying problem and usually brings the
value destruction to an end. In some cases, however, the value destroyer is
insulated from market signals.
A
spectacular example of insulated value-destroying growth is provided by General
Motors. From 1965 to 2005 its sales grew from $11b to $474b, a factor of
41 times. But operating income stayed roughly constant and the per share
price of its stock declined, adjusted for one stock split. Jensen (1993)
estimated the value creation or destruction through capital expenditure and
R&D spending by 432 U.S. companies during the 1980s, using a discounting
methodology. He concluded that General Motors had destroyed about $100b
of economic value over 1980-1990, even though its stock price did not fall.
I repeated Jensen’s calculations for the period 1992-2001, an optimistic
period when GM’s stock price more than doubled but in which further massive and
ultimately unproductive investments in plant and R&D were made. I
estimated value destruction in these 10 years to be approximately $200b.
The reason
that GM’s value-destroying growth of this magnitude did not trigger a flight by
capital suppliers is that the company was insulated by its huge embedded cash
flows. These cash flows might have been passed to the capital suppliers,
who had opportunities to invest them at market rates of return, but instead
were poured into capital investments whose poor quality was not visible for
many years. Because embedded cash flows insulated the company from market
pressures, GM did not generate investor anxiety for many decades.
The East
Asian financial crisis of 1997-98 was as unexpected as was the recent crisis,
and puzzled many observers because it was most severe in the countries that had
been the most highly regarded and rapidly growing: Korea, Thailand,
Indonesia, Malaysia and Philippines. Pomerleano (1998) conducted a study
of firm-level accounting data to see if this growth had been value-destroying.
Among other measures he examined a simple pre-tax return on capital
employed (ROCE), dividing operating income by debt plus equity, and aggregating
this year by year at the country level. He then compared his ROCE
estimates to the local-currency interest rate year by year. His idea was
that cost of capital is elusive, but is bounded below by the cost of debt: if
a firm cannot earn at least the local currency interest rate on its total
capital, it must be destroying value. Thus ROCE less local interest rate
is a rough proxy for whether economic value was likely destroyed.
His results
were striking: over 1992-96, the five years leading up to the East Asian
crisis, this metric averaged -9% in Indonesia and Philippines, -8% in Thailand
and -2% in Korea and was positive elsewhere in East Asia. This implies
that firms for which accounting data were available were on average destroying
value in four of the five countries that turned out to be the center of the
East Asian crisis. This is one of the few metrics that in retrospect
might have predicted the crisis.
In the case
of China, the main capital suppliers are state-owned banks, which are unlikely
to refuse lending to SOEs even if they destroy value. The banks are fully
protected by the government and so do not suffer runs. Their patient
behavior insulates Chinese firms, especially the SOEs, from capital flight.
So China does not experience the pain signals that periodically shock
other economies; this is the primary reason China did not appear to participate
in either the East Asia crisis or the current financial crisis. But in a
sense they did participate. If one has a decaying tooth, for example, the pain
signal is unpleasant but forces attention to the underlying decay; the absence
of a pain signal is not necessarily a benefit. The East Asia crisis was a
form of capital flight from countries whose economies had grown rapidly but
which now seemed to have been destroying value. China participated in the
value destruction (see next section) but avoided the capital flight.
Chinese Banks
and Value Losses
Banks in
general are notorious for concealing value destruction. It is only when
banks seek to be repaid that they learn whether the borrowers can repay with
interest or not; if banks are willing to roll over their loans indefinitely,
and lend more to ensure interest payments, losses may be concealed for decades.
As a banking quip goes, “A rolling loan gathers no loss.” This
often has the collaboration of government regulators. For example, United
States regulators of thrift institutions – savings banks and savings and loan
associations – permitted the thrifts to engage in massive value-destroying
growth after most had failed in the early 1980s, extending the thrift crisis by
eight years and causing a $20b problem to grow into a $200b problem. Banking
crises are triggered only when either the government or unguaranteed capital
suppliers to the banks refuse to go on funding them. Such refusal usually
happens abruptly after a change of government or an unanticipated loss of
investor confidence.2
I have
replicated Pomerleano’s calculation over 2005-2009 for the 387 publicly traded
Chinese companies with assets greater than $1 billion whose results are
tabulated on Capital IQ. On average the metric is positive, though it
declines from 6.2% to 3.4% over this period. However, this averages some
very large positives with a number of negatives. Over these five years
the fraction of companies for which this metric is negative increases steadily
from 26.8% to 38.7%. It appears that more a third of these companies are
not currently earning a return on capital employed greater than the local bank
lending rate.
As noted
above, China went through three great bursts of double-digit economic growth
prior to the financial crisis, each of which was preceded and accompanied by a
comparably large burst of capital investment facilitated by increased growth of
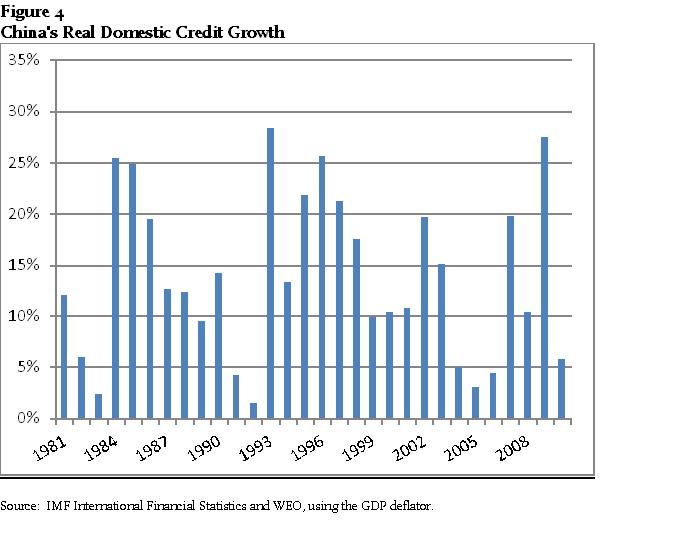
domestic credit. Figure 4 illustrates the rapid growth of real domestic
credit in China throughout the past 30 years. In fact, real domestic
credit growth has averaged 14% annually over 1981-2010, i.e. materially faster
than the economy.
A close look
at Figure 4 shows eight years when real credit growth exceeded 20%. The
first of these, 1984-85, coincided with years of high GDP growth, as did 1993.
More recently, however, such years follow the crest of real GDP growth,
namely 1995-97 and 2009. It appears that the government was alarmed at
the decline of the growth rate in 1995-97 and attempted to extend the boom by
excessive credit. That was clearly the case in 2009 when China seemed
determined not to let its growth rate fall below 10%.
The credit
expansion of 1993-99 left a hangover of nonperforming loans (NPLs) that was
only gradually acknowledged by the authorities. NPLs are notoriously
difficult to estimate in any banking system, but particularly so in China given
the non-transparency and government control of the system. The Chinese
definition of NPL is substantially looser than equivalents in the U.S. or
Europe. The only reliable way to quantify value destruction in the
Chinese banking system is to count up the losses retroactively.
In the first
years of the new century China determined to reform its banks by opening them
to foreign ownership. This in turn required dealing with the hidden
losses. The government invested new capital in several stages into the
four large banks, which then transferred NPLs to four new asset management
companies (AMCs) one for each of the four banks. Dobson and Kashyap
(2006) estimated that the total cost to the Chinese government of cleaning up
the banks over 2003-2005 was $240-430b or 10-18% of GDP. These losses are
best understood as having actually occurred in the credit expansion of the
1990s.
A further
credit expansion in 2002-03 very likely led to more NPLs. Only after 2003
did the Chinese authorities exert a determined effort to restrain credit
growth. Real credit growth averaged only 4% over 2004-2006, but this
restraint was abruptly reversed in 2007 and especially in 2009 after the global
economic downturn. Chinese loans outstanding grew by RMB 9.6 trillion in
2009 compared with RMB 4.7 trillion in 2008, and real GDP was up 9.4%.
While banks
in almost all other countries grew increasingly risk-averse, the Chinese banks
doubled down. Many, both inside and outside of China, expressed anxiety.
As the Financial Times reported,3
The chairman
of China Construction Bank, the country’s second largest by assets, has warned
of the perils of rapid economic growth, adding his voice to a growing chorus of
economists concerned about overheating. Gross domestic product growth of
9.5 per cent or above would “be very problematic”, Guo Shuqing told
the Financial Times. “It will mean more duplication of construction, more
excess capacity and higher waste of capital.”
The Chinese
government’s effort to protect the growth rate led to a further loan expansion
of RMB 7.95 trillion in 2010, overshooting its target of RMB 7.50 trillion.
Growth was at a 9.6% rate in the third quarter and is estimated to have
exceeded 10% for all of 2010.
Export-driven
Growth
The economic
benefits of trade were of course articulated at the dawn of modern economic
thought by David Ricardo: a low-wage country can profitably trade with a
high-wage country if the former specializes in labor-intensive goods and the
latter in capital-intensive goods. A dynamic growth strategy can start
with the most labor-intensive goods such as clothing, shoes and toys, then
gradually move up the scale of sophistication to consumer electronics and
automobiles. This growth path was effectively followed first by Japan in
1960-1990, then by Korea and Taiwan in 1980-2010. It has been China’s
preferred path since about 1990.
Export
competition brings a number of special benefits. Above all, it forces a
country to compete with the best producers in the world, challenging the
exporters to improve their products and processes as rapidly as possible.
Furthermore, companies in industrialized countries are often interested
in producing goods in low-wage economies for their markets, and are willing to
invest in the low-wage countries to achieve this. The recipient country
can extract a lot of benefits from this partnership including transfer of
technology and modern management techniques. China has been particularly
adept at extracting such benefits from foreign counterparts.
Chinese
Export Experience
Researchers
have studied in great detail the role of exports in Chinese growth.
Clearly gross Chinese exports are huge, cresting at 37% of GDP in 2008
before falling to 28% by 2010. Net exports are far smaller: they
were just 1.3% of GDP in 2001, and then crested at 10.6% in 2007 before falling
back to 4.7% in 2010. The contrast in these figures suggests that China’s
exports add relatively little value: it reflects the processing approach
in which China primarily performs a low-cost, labor-intensive final assembly to
imported parts.
Clearly
China has directed a large part of its investment at the export sector.
IMF staff have estimated that net exports plus the investment linked to
building capacity in tradable sectors accounted for 40% of China’s growth in
the 1990s and 60% over 2001-2008, larger than comparable figures for the Euro
area (30%) and the rest of Asia (35%).4
Koopman,
Wang and Wei (2008) developed a new econometric methodology designed to
estimate the share of domestic versus foreign value-added when a significant
fraction of exports consist of processing or assembly trade. They
estimated that the foreign value-added share in Chinese merchandise exports was
47.7% in 1997 and 46.2% in 2006, figures about twice as high as previous estimates.
They also found that exports generally considered more sophisticated such
as electronic devices have particularly high foreign content (about 80%),
contrary to a common assumption.
Economic
growth is based importantly on a rise of productivity. If the mix of
low-wage labor in GDP increases, the return to capital (as estimated, for
example, by either ROCE or ICOR) must improve. One might characterize the
Chinese economy as a combination of a highly productive, efficient,
value-adding export sector and a less efficient, sometimes value-destroying
public sector. This characterization clarifies the importance of exports
to Chinese growth: so long as low-wage processing exports increase more
rapidly than other output, productivity increases. The coastal export
complex maximizes the use of China’s low-cost labor and is a primary reason for
China’s productivity gains.
During
2001-2007, as consumer spending in the U.S. and parts of Europe crested, China
for the first time developed a significant trade surplus and began to
accumulate financial reserves. China’s trade surplus grew at a compounded
40% annual rate from 2001-2007. This quickly became a political issue in
Europe and the United States. Import substitution also fueled the
greatest rise yet in Chinese GDP, whose real growth rose to 13% in 2007.
The European-Chinese trade relationship became particularly strained.
The United States has put intense diplomatic pressure on China to raise
its exchange rate peg with the U.S. dollar, and under duress China has shown
some flexibility and has promised more.
Rising
Wages
The export
model has caused strains within China. A migrant population estimated at
130-170 million people left the rural Chinese hinterland and settled in
burgeoning coastal cities. The rural provinces, which benefited from
Chinese growth in the 1980s, fell behind economically, and the migrants were
little integrated into urban life. The social stress caused by the
migration is a source of concern inside and outside the country. In 2010
a Taiwanese company (Foxconn) operating in Shenzhen experienced a highly-publicized
wave of worker suicides, causing considerable agitation over working conditions
in the export factories.
The reasons
for labor agitation are many: the general unhappiness of displaced
workers, the very low wages, the working conditions and, more recently, the
inflation in consumer prices. Traditionally China has had little
inflation: the CPI rose an average of only 1.4% over 2001-2006. But
economic growth driven by credit expansion leads to over-heating. Urban
housing prices increased by more than 20% in 2010, according to a Global Times
report of January 17, 2011. According to FT.com on December 11, 2010,
consumer price inflation was 5.1% in November, 2010, up from 4.4% in October
and materially higher than the government’s target of 3.0%. Included
particularly in 2010 inflation is a 10% increase in food prices. These
add particular urgency to worker demands.
One might
characterize the Chinese economy as a combination of a highly productive,
efficient, value-adding export sector and a less efficient, sometimes
value-destroying public sector.
In the past
three years, workers in China have begun demanding higher wages. In 2008,
as factory shutdowns multiplied, two new laws established a system of
arbitration and courts to handle labor disputes.5 In 2008 the
number of labor cases in court jumped 94% to 280,000, and in the first half of
2009 there were 170,000 such cases. In each of 2008 and 2009 nearly
700,000 labor disputes went to arbitration. Numerous prominent companies
have raised wages by 30% or more in 2010. In many provinces the minimum
wage has been raised 15-25% in 2010.6
Price
inflation and wage inflation are closely connected. It was wage demands
that made the U.S. price inflation of the 1970s so virulent, and the slack
today in the U.S. labor market that holds U.S. price inflation down despite
massive injections of liquidity into the system by the Federal Reserve.
Similarly, wage demands in China quickly translate into higher prices,
particularly in the presence of liquidity injections. In particular, export
prices have been steadily rising, reaching 5% growth in 2010.
The Chinese
government could use its currency peg to moderate inflation if it had chosen to
let the yuan rise more than it has, since a rising currency value would cool
the export economy and make imports less expensive. However, this is not
the preferred policy of the government, which tends to put growth in production
above all other values. This channels the inflationary pressure into
export prices directly.
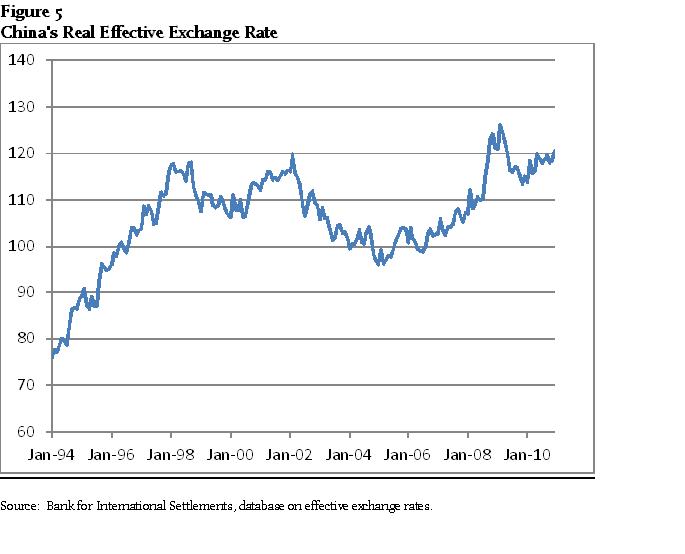
China has in
general been losing competitiveness. Figure 5 shows the BIS effective
exchange rate for China. As can be seen, China lost competitiveness
during the 1990s then regained it during the crest of the export boom in
2002-2007. Since 2006 the currency peg has actually been revised upward
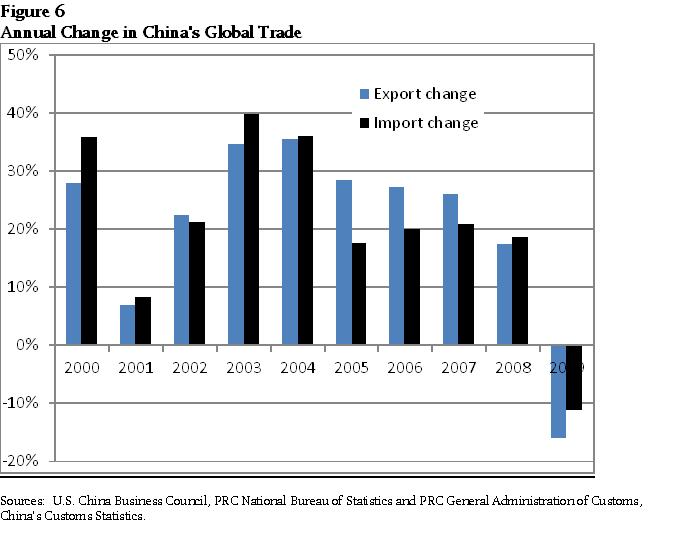
by about 20%. Figure 6 shows that China’s export growth crested in 2003
and net export growth crested in 2005. China’s net trade position came
under pressure in 2006 and altered materially in 2009. In April 2010
China had its first monthly trade deficit in six years, and China ended 2010
with a 6% decline in its trade surplus.
The
fundamental problem China faces is that rising wages will undermine the export
model, which is based on being the lowest-cost supplier. Vietnam and
others are ready to compete for that space as China’s very success drives its
wages higher. The model needs to change.
Could China
simply move upscale into higher-end products, respected brands and more
value-added? This is the way Japan managed its rising wages in the 1980s
without slowing down. But Japan’s success in moving upscale was actually
limited to just a few industries, notably automobiles and electronics, where
the existing competition was suffering quality and other problems. When
Korea attempted to follow Japan’s path a decade later it found the going much
harder, primarily because Japanese products had become entrenched.
Korea’s automobiles, for example, have had a hard time establishing
themselves in part because of Japan’s earlier success in doing so: Korea
cannot compete against Toyota as easily as Toyota competed against General
Motors. China certainly has ambitions in electronics and automobiles, but
only time will tell if they can move beyond cost advantages to compete on
quality with the high-performance companies that tend to dominate these fields.
How much
scope does China have for taking more low-end export market share away from
other countries? The answer depends on what their appropriate longer-term
market share ought to be, and how far they are from that optimum. This
question was studied in detail by Bussière and Schnatz (2006), who concluded
that China’s share of world trade was approximately at its appropriate
longer-term level, given its size, location, development level and other
factors:
China
displays a higher degree of global trade integration than many other
industrialized countries or Asian trading partners, However, our measure
of global trade integration for China is not higher than that of several
developed countries such as the US, Germany or Japan.
The
implication is that China has already encroached substantially on the world’s
export markets, and trying to raise market share from this point will be an
uphill battle. No doubt it will be tried, but there is a limit to the
share that any competitor can achieve, so this may be at best a short-term
strategy.
Domestic
Consumption-driven Growth
China’s mix
of entrepreneurial energy, heavy investment and low-wage production for export
has proven such a potent formula for economic growth that many people both
inside the country and outside cannot imagine a China growing at less than 10%
per year. But this is an illusion. The latest burst of capital
investment financed by banks during 2009-2010 is almost surely generating
another wave of NPLs in the banks.
This is not
to say that Chinese growth must slow to a crawl as Japan’s did after its bubble
burst at the end of the 1980s, though this is one possible scenario.
Unlike Japan, China has an untapped source of future economic growth:
its consumers. From a broad perspective, increased domestic
consumption seems by far the most attractive source of growth for the future.
It would serve to reduce the global financial imbalance, raise living
standards in China, facilitate a new development focus on the rural areas and
above all be sustainable. Yet this is more easily said than done.
The
constraints on Chinese consumers are impressive. Most fundamentally,
their incomes are low: China has systematically favored producers over
consumers. The returns to capital in China are high but the returns to
labor are startlingly low. A recent IMF study uses multiple sources to
trace the decline of household income to GDP over 1985-2005 by roughly nine
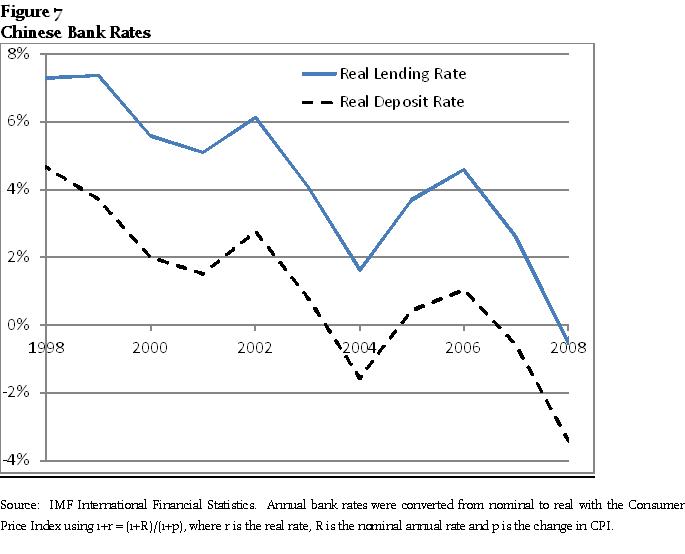
points (9% of GDP).7 Not only are wages suppressed, but China
also exploits the vast pool of household savings by keeping bank deposit rates
low: real deposit rates averaged 0.2% over 1989-1998, 1.1% over 1999-2004
and 0.1% over 2005-2009 (See Figure 7). With both labor income and
capital income low, consumers do not have the resources for expanded purchases
of consumer goods, much as they might desire them.
Further
constraints on consumers include unaffordable healthcare and an inadequate
pension system. Consumer finance is in its infancy: until 2007 the
People’s Bank of China did not even show a category for household lending.
Since 2007 it has shown Chinese bank lending to individuals for business
and for consumption. Consumption loans start at RMB 2.5 trillion at the
beginning of 2007, rise to RMB 3.7 trillion by year-end 2008 and then suddenly
jump to RMB 5.5 trillion by the end of 2009. However these still
represent only 13% of total bank loans of RMB 42.6 trillion.8
Most
worrying for advocates of increased local consumption, household saving rates
for urban consumers actually increased from 17% to 24% of disposable income
from 1995 to 2005. Chaman and Prasad (2007) conducted a detailed study of
this phenomenon and found an intriguing pattern:
“We find a U-shaped pattern of savings over
the life cycle, wherein the older and younger households have the highest
savings rate. This is the opposite of the traditional “hump-shaped”
profile of savings over the life cycle in the young workers save very little
(in anticipation of rising income), savings rates tend to peak when income is
the highest (middle age) and then fall off as workers approach retirement.
This relationship between savings and age differs considerably from the
norm in other countries.”
Apparently
younger Chinese are saving in anticipation of rising educational costs and
older Chinese are saving in anticipation of rising health costs.
If Chinese
consumers are to absorb a significantly larger fraction of consumer goods
produced by Chinese factories, these precautionary savings rates would need to
be brought down; this would require better state health care and more
affordable education. The entire development philosophy would need to
shift away from producers and toward consumers, with businesses raising wages,
banks raising deposit rates and increasing consumer loans, government offering
expanded health and education services.
While these
are not impossible, they imply a major shift in behavior and expectations.
The Chinese leadership has often paid lip service to the goal of more
internal consumption. Having tilted so strongly toward producers, China
needs to begin favoring consumers as a matter of good economics. But
there is a timing problem: raising wages will impact export
competitiveness immediately, but the benefits of wealthier consumers buying
more may take many years to evolve. The old model must be disadvantaged well
before the new model can take hold. That suggests an interim period of
significantly slower growth.
Summary
and Conclusion
In summary,
China’s growth over 1980-2010 resulted from a number of well-understood
economic effects including acceleration of growth through capital investment
and Ricardian benefits of trade. Equally important were a series of
unique, transformative events that coincided to China’s benefit during this
period: the carefully-managed but decisive policy shift away from Maoism
and toward market economy in the 1980s, releasing the remarkable
entrepreneurial energy of the Chinese people. Then the advent of globalization
and the massive push for exports in the 1990s, culminating with the
reunification of Hong Kong with China and the growing linkage of offshore
Chinese with the mainland. Third, the burst of financial and consumer
excesses in the United States and Europe in the 2000s fueled a consumption boom
in both areas and created a rapidly-expanding market for Chinese goods.
One way to
characterize China’s growth model is to say that it has favored internal
producers and external consumers. Or this could be restated: it has
favored internal firms and disfavored internal individuals (consumers,
workers). Returns to physical capital have been high but returns to labor
and to financial savings have been low. The resultant growth has been
high but not sustainable.
China takes
pride in not being part of the 1997-98 East Asia crisis or the 2007-2009
financial collapse in the industrialized world. But in a sense they have
been part of both. They avoided the impact of the 1997-98 crisis by
concealing bank losses and continuing to increase capital investment, some of
which was value-destroying and led to a high level of bank losses. The
banks did not suffer runs because of total government support, but the price
was paid by individual savers, who suffered negative real returns as the firms
and banks struggled to rebuild their balance sheets. China has met the
2007-2009 crisis by increasing lending on a larger scale. The consequence
has been a debt-driven overheating of the economy and bubble in real estate and
stock prices.
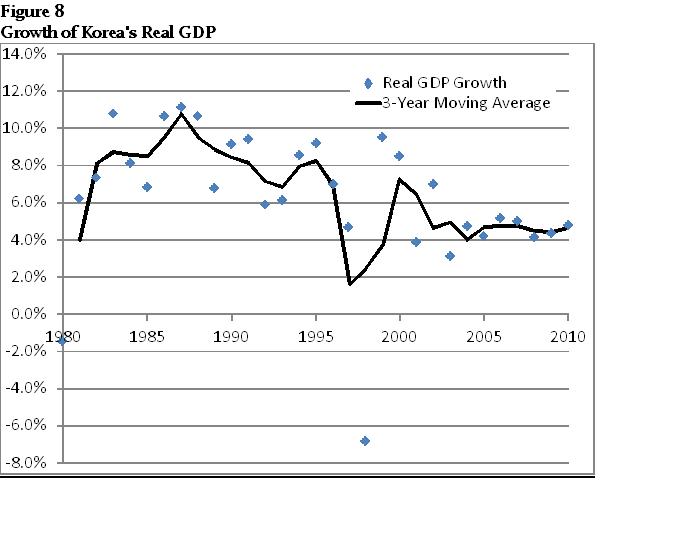
What does
the future hold? A sudden stop of growth as happened in Japan in the
1990s seems unlikely; a more probable role model is Korea, whose growth pattern
is shown in Figure 8. Korea’s very rapid growth in the 1970s slowed in an
irregular pattern to the 4-5% range by the years 2000-10. Growth was
broken in 1979-80 by the collapse of a government investment push in heavy and
chemical industries, and another burst of overinvestment ended badly in the
financial crisis of 1997-98. But much depends on the choices made by the
government. A continuing determination to maintain 10% real output growth
above all else could end badly.
By far the
best course would be to stimulate local consumption. This would imply
rapidly rising wages and a return to positive real interest rates on deposits –
no other program could stimulate local consumption as well. But the
tradeoff would be an immediate reduction in the profits of banks and/or firms,
at a time when both are beginning to face a new round of NPLs. Such a
departure would surely be resisted by these powerful interests.
The Chinese
leadership has a well-established pattern of gradualism, so any change in favor
of workers and consumers is likely to move slowly, though it must surely come
in due course. In the meantime, it seems more than likely that the golden
age of Chinese super-growth is nearing an end. No doubt China has a
bright future, given the entrepreneurial energy of its people and the careful,
pragmatic path taken by its government in economic policy. But China is
at a crossroads. The old growth model has almost run its course, and a
new one needs to be developed. The path needs to turn a corner to head in
a new direction. Only time will tell how challenging this transition will
be.
Notes
1 The Solow model is expounded in detail by Acemoglu (2009), Chapters 2 and 3, pp. 26-107.
2 See Beim (2001).
3 “Bank boss adds to concerns over speed of China’s economic growth”, Financial Times, April 5, 2010.
4 Guo, Kai and N’Diaye (2009).
5 Edward Wong, “As China aids labor, unrest is still rising”, The New York Times, June 21, 2010.
6 Edward Hadas, “Share the wealth” in Reuters Breaking Views, June 7, 2010.
7 Aziz and Cui (2007).
8 People’s Bank of China website.
References
Acemoglu, Daron 2009, Introduction to Modern Economic Growth, Princeton University Press.
Aziz, Jahangir and Li Cui 2007, “Explaining China’s low consumption: the neglected role of household income”, IMF working paper WP/07/181.
Beim, David 2001, “What triggers a systemic banking crisis?”, working paper, Columbia Business School.
Bussière, Matthieu and Bernd Schnatz 2006, Evaluating China’s integration in a world trade model with a gravity model based benchmark”, European Central Bank, Working Paper No. 693.
Chamon, Marcos and Eswar Prasad 2007, “Why are savings rates of urban households in China rising?”, Forschungsinstitut zur Zukunft der Arbeit, IZA DP No. 3191.
Dobson, Wendy and Anil Kashyap 2006, “The contradiction in China’s gradualist banking reforms”, Brookings Papers on Economic Activity, 2006:2.
Dollar, David and Shang-Jin We 2007i, “Das (Wasted) Capital: firm ownership and investment efficiency in China,” IMF working paper # WP/07/9.
Guo, Kai and Papa N’Diaye 2009, “Is China’s export-oriented growth sustainable?, IMF working paper WP/09/172.
He, Dong, Wenlang Zhang and Jimmy Shek 2007, “How efficient has been China’s investment? Empirical evidence from national and provincial data”, Pacific Economic Review, 12:5.
Huang, Yasheng 2008, Capitalism with Chinese Characteristics: Capitalism and the State, Cambridge University Press.
Jensen, Michael 1993, “The modern industrial revolution, exit, and the failure of internal control systems, The Journal of Finance, XLVII-3, July 1993.
Koopman, Robert, Zhi Wang and Shang-jin Wei 2008, “How much of Chinese exports is really made in China? Assessing domestic value-added when processing trade is pervasive,” NBER Working Paper 14109.
Pomerleano, Michael 1998, “The East Asia crisis and corporate finances: the untold micro story,” World Bank policy research working paper WPS1990.
This paper can be downloaded at the Social Science Research Network.
Downloads
More About the Authors


