Executive Summary
School funding debates in the United States tend to center on how much money school districts should receive, and through what policies and formulas. But they almost never focus on the district map, even though district borders do a great deal to determine the funding of each school system. School district boundaries don’t just define the area where a certain group of children attends a given set of schools. They also determine the taxing jurisdiction that supports those schools with local property taxes. Big differences in property value can lead to large funding gaps, even between neighboring districts.
These disparities in property values are not happenstance. They are often the result of housing policies that were explicitly intended to segregate neighborhoods by race and economic class. The school district lines drawn atop this divided landscape then replicate segregation and inequity in schools. But district borders are a product of state policy. They can be redrawn, and border policy can be changed, to produce better outcomes for students and their schools.
To illuminate these issues, New America’s Education Funding Equity Initiative (EFEI) produced a research report looking at borders between neighboring school districts, the degree of economic and racial segregation they create, and the funding implications of these divisions. The report features stories about these disparities told by local educators and families. To accompany this report, EFEI has created a multimedia story depicting what these divides mean for American school districts and communities, and an interactive national map and data tool that allows users to explore the demographic, economic, and financial data for all American school districts, and to view the borders that surround them.
Districts Shaped by Discrimination
American communities have been shaped by decades of segregative housing policies. In the twentieth century, the government housing agencies that engaged in redlining (the practice of rating American neighborhoods by the level of risk they carried for mortgage lenders) openly considered communities of color to be poor investments, making homebuying difficult or impossible for minoritized families. Racially restrictive covenants, which were contracts that prevented homeowners from selling to Black or other specified categories of buyers, were used and enforced. Segregated housing developments were constructed with public financing. Town governments pursued “urban renewal” agendas that cleared neighborhoods of residents of color. Even today, many localities deploy exclusionary zoning policies—local building rules that make housing more expensive and are often calculated to maintain segregation.
When school district boundaries are drawn narrowly around communities that are principally poor or affluent, or predominantly white or non-white, the divides in property wealth translate into unequal district property tax capacity. Along the school district borders that mark the steepest racial and economic divides, students are getting shortchanged. In too many cases, the districts serving more students in poverty or more students of color are more cash-strapped than their neighbors. In all of the districts defined by these borders, children are segregated from their peers, deprived of the opportunity to learn alongside students of different backgrounds.
National Findings
This report looks at neighboring school systems and the borders that separate them. We examined 24,658 pairs of adjacent districts and measured the divides between them in two ways. First, to measure economic segregation between neighboring districts, we compared their poverty rates among school-aged children, and identified the 100 borders that mark the greatest differences in poverty rates. Second, we looked at the differences in racial composition between adjacent districts by comparing their percentages of enrolled students of color, and identified the 100 borders that create the greatest differences by this measure.
Economic Segregation and School Funding
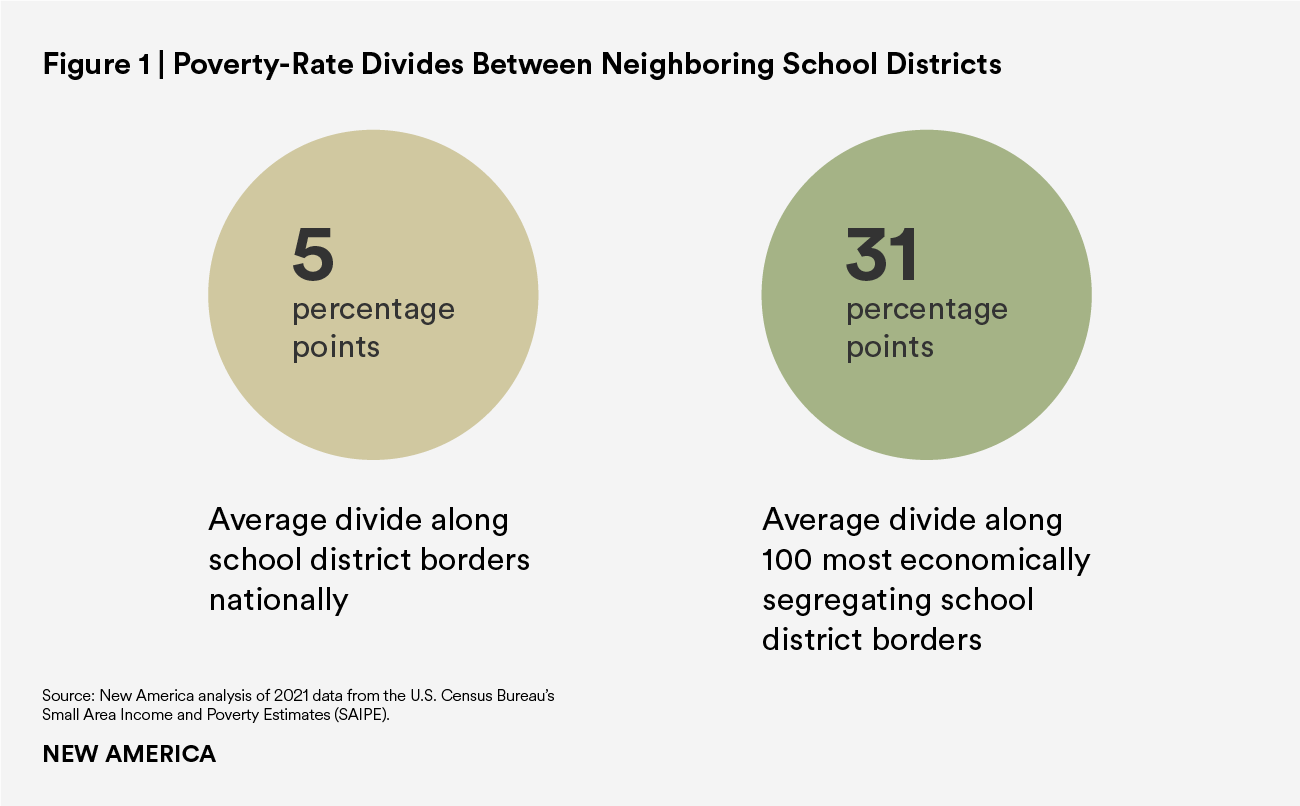
The average border between two neighboring school districts in the United States marks a poverty-rate difference of 5.2 percentage points. However, along the 100 most economically segregating borders, the average divide is a staggering 31 percentage points.
The map below shows the location of these 100 most segregating borders by poverty-rate difference.
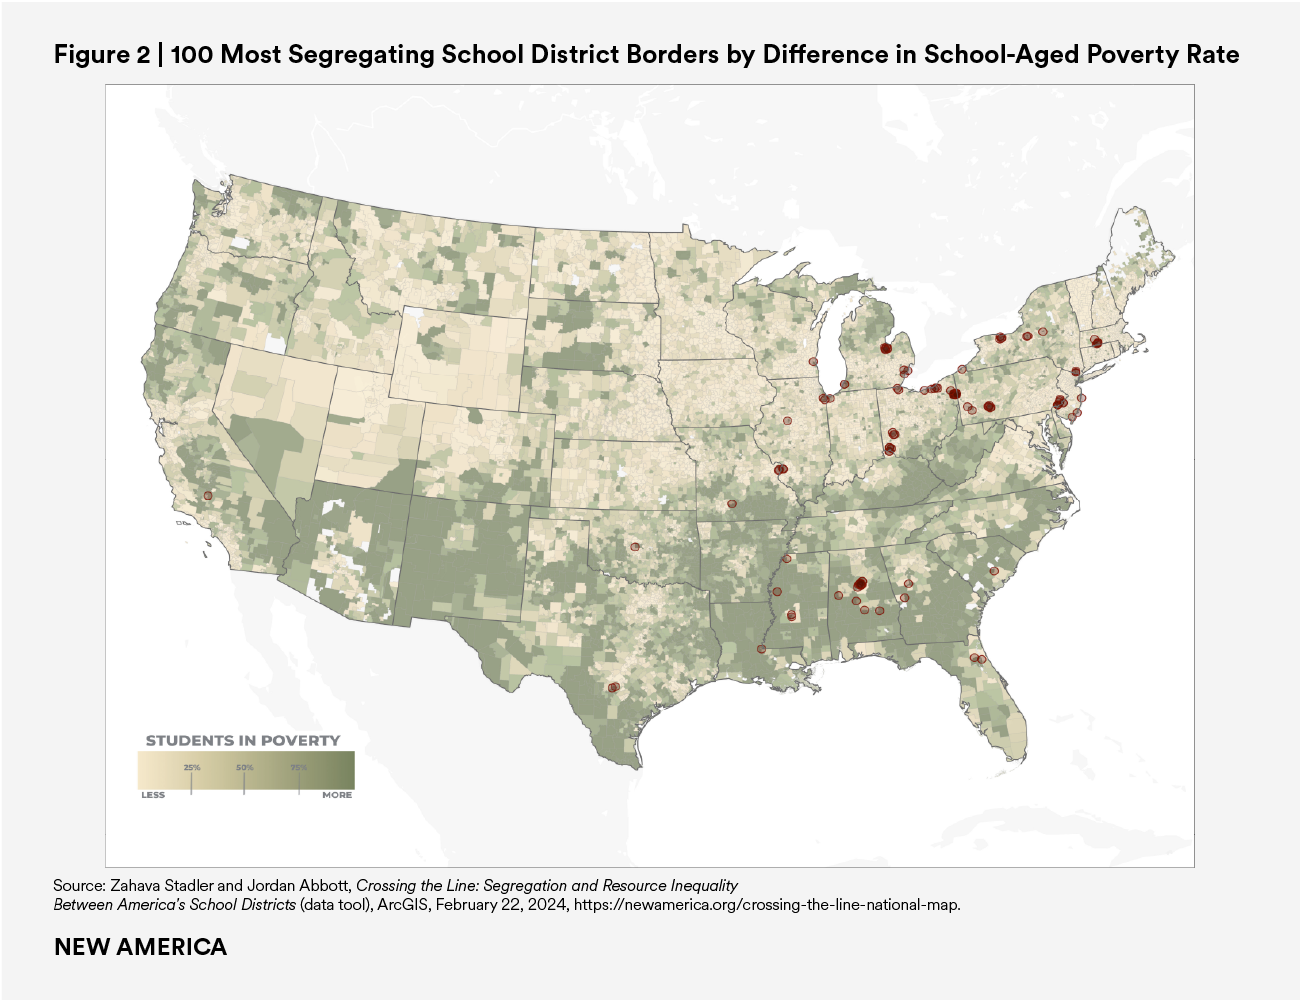
School district borders that mark a wide poverty-rate divide often also separate districts with very different property values. Because so much school funding is drawn from local property taxes, these differences can mean big disparities in school budgets. Along the 100 most segregating school district boundaries by poverty rate, the average difference in local revenue between lower- and higher-poverty districts is $4,119.46 per pupil. This ground-level inequality places a huge burden on state budgets to close the gap.
On average, they are barely managing to do so. When state and local funding are added together, the higher-poverty districts have about 4 percent more per pupil. However, this figure represents the average effect of wildly different state funding policies; in Ohio, such districts receive 14 percent more, while in Pennsylvania, they get 11 percent less. The 100 most segregating borders in the country by poverty-rate difference are located across 20 states. In nine of those 20, the higher-poverty districts are on the losing end of a funding divide.
Racial Segregation and School Funding
Nationwide, 53 percent of public-school district enrollees are students of color. However, these students are highly concentrated in a relatively small number of districts. Forty-six percent of students of color are enrolled in just 1 percent of all school districts. Meanwhile, 26 percent of school systems serve student populations that are more than 90 percent white.
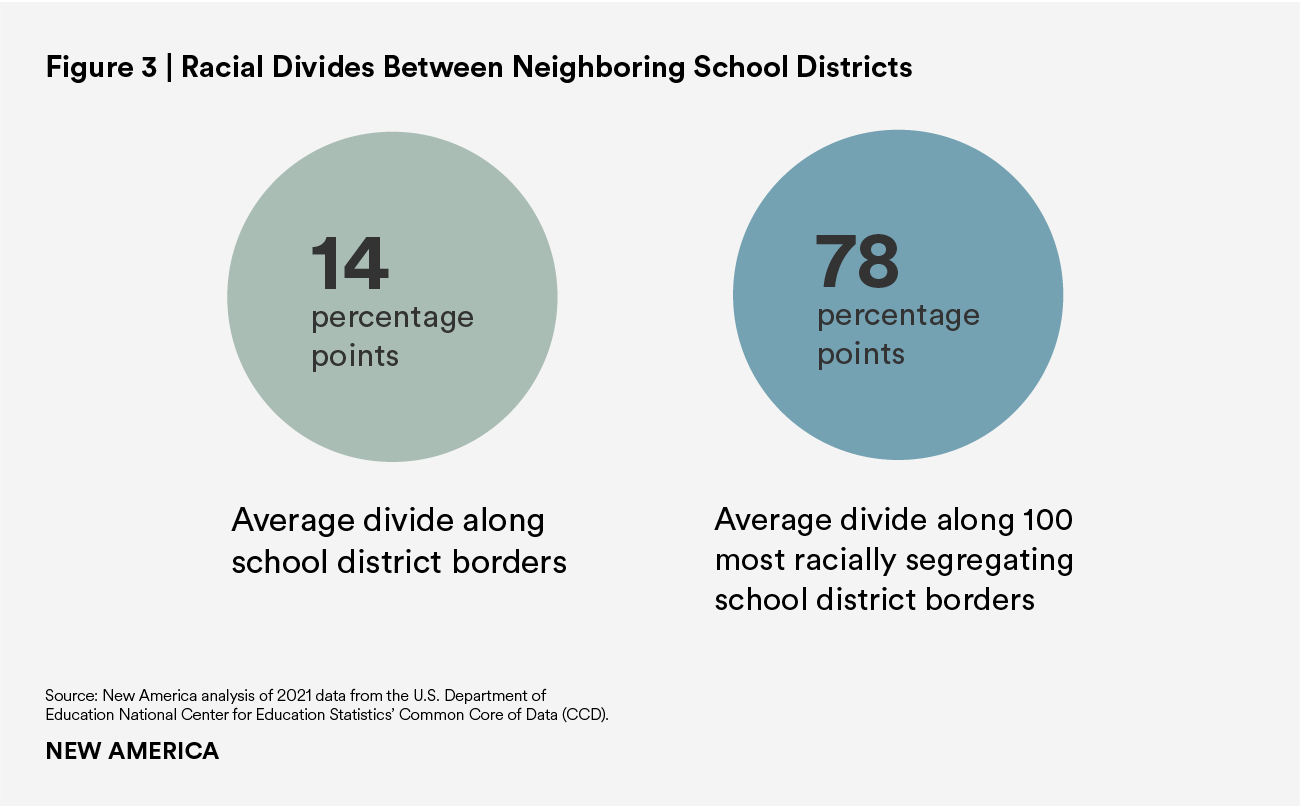
The average district border separates districts that are 14 percentage points apart in their proportions of students of color. But along the 100 most racially segregating school district borders in the country, the separation is, on average, between a district that is 92.4 percent white and a district that is 86 percent students of color.
The map below shows the location of these 100 most racially segregating borders.
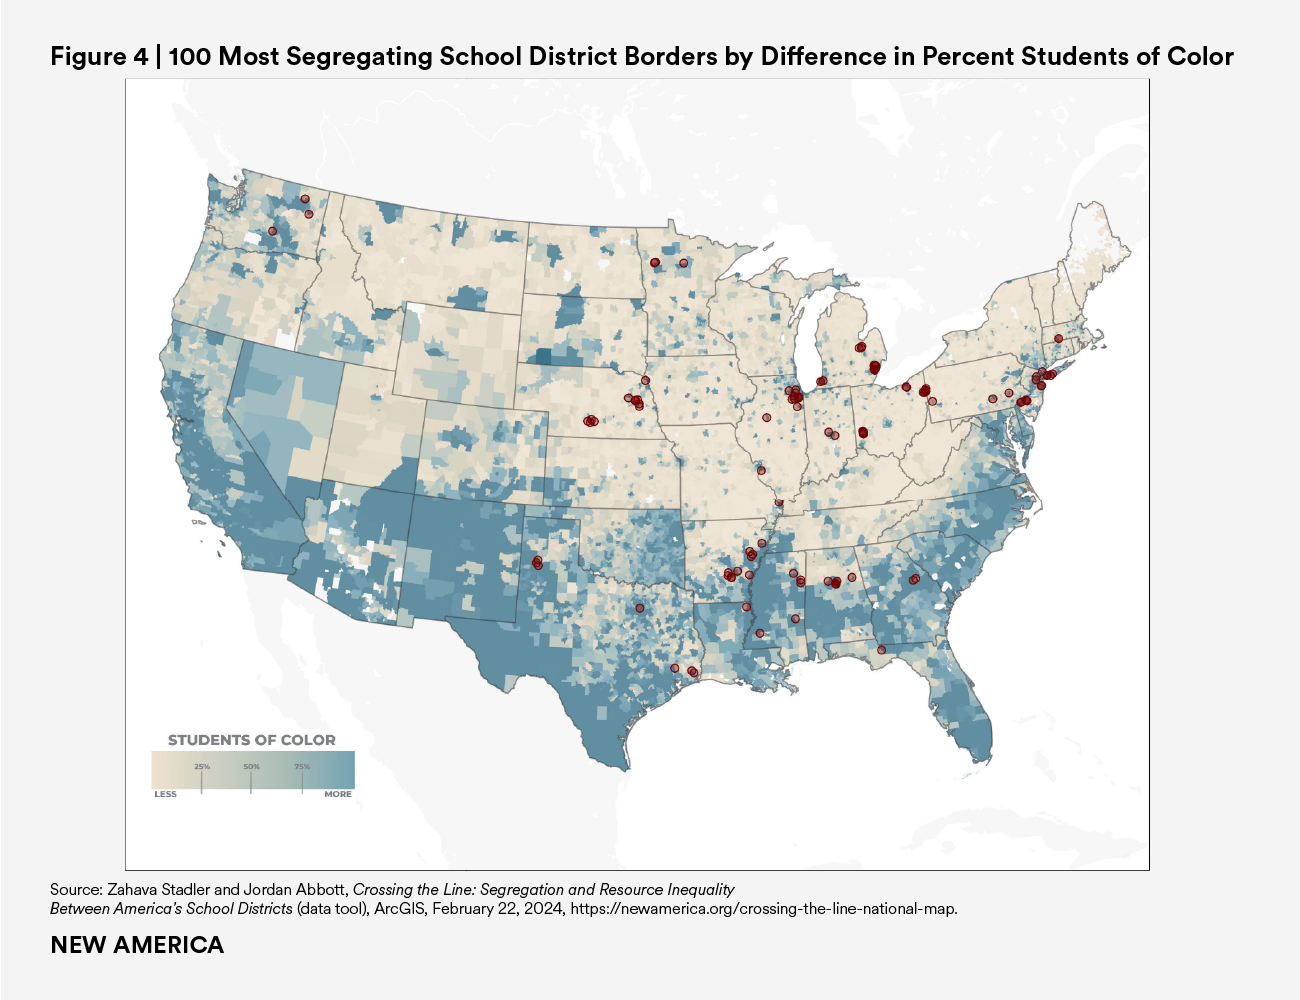
Like districts serving more students in poverty, those serving more students of color are likely to have lower property values. Along these most-segregating borders, the districts serving more students of color collect $2,222.70 less in local revenue per pupil than their predominantly white neighbor districts. It is expensive for states to compensate for these inequalities. On average across all 100 borders, state aid is indeed making up the difference, and more: After state aid is added to local funding, these districts receive $1,087.89 more per pupil.
Not all states have met this challenge, however. Nebraska is one troubling example: It is home to 11 of these most segregating borders. Along these borders, the districts serving more students of color raise almost $8,300 less per pupil on average from local sources than their neighbor-districts, and the state funding system provides less than a quarter of what is needed to make up the deficit. And even in states where the funding gap across these borders does not disadvantage students of color, it is nonsensical for states to allow districts to start out with huge local revenue deficits and then be forced to find huge amounts of state revenue to compensate. Instead, states should construct a funding system that is fair from the start.
A Future Not Determined by the Past
To allow students to learn in diverse school systems whose funding levels match student need, not local property values, states must address interdistrict divides at the source. One option is to purposefully draw school district boundaries to include heterogeneous student communities and more economically mixed areas. Another is to eliminate or reduce the role of local property taxes in the school finance system, such as by levying all education taxes at the state level, or by pooling local property tax revenues across multiple districts. Any remaining local property taxes in the school finance system should be appropriately governed to limit funding inequality.
The nature and severity of interdistrict disparities vary from region to region and community to community. But they all exist as facets of a single problem: the building of school districts, and school district finances, atop a divided and unequal foundation. The redlined neighborhoods of the past have produced redlined schools—and school budgets—in the present. States need not continue to make policy choices that reinforce these deep interdistrict divides. It’s time to draw the line.