Table of Contents
- Executive Summary
- I. Introduction
- II. The Past, Present, and Future of School System Redistricting
- III. Overview of Data and Methods
- IV. Gains from Three Approaches to School System Redistricting
- V. Achieving District Boundary Change: Lessons from a School System Leader
- VI. State Spotlights
- VII. A Time for Better Borders
- VIII. Interactive Map and Data Explorer
Executive Summary
School district boundary change has an extensive history in the United States. Lines were redrawn to eliminate over 100,000 school districts in the twentieth century,1 consolidating one-room-schoolhouse districts into comprehensive systems offering modern education and professionalized teaching.2 Since then, states and communities have continued to change school district boundaries, albeit in a less consistent way. Consolidation—erasing the line between two school systems—has often been a way of seeking greater efficiencies or attempting to address fiscal distress or declining enrollment.3 By contrast, secession—pulling away from a school district by drawing a new dividing line—has often been a means for affluent, usually predominantly White communities to keep their property tax dollars within their own small enclaves.4 But redistricting has almost never been used as a tool for advancing education equity, even though it holds great potential to create fairer school districts.
School district boundaries serve two main purposes. First, they define the area in which resident children can go to a certain group of schools. Second, they outline the local taxing jurisdiction that will provide much of those schools’ funding. This means that the placement of the district border is one of the most powerful ways that policymakers decide which children have access to what school resources. Too often, school district boundaries are drawn along existing neighborhood fault lines, outlining unequal tax bases and replicating residential segregation by race and class in our public schools.5 But the right boundaries, drawn to encompass more integrated student populations and more equal tax bases, could transform our public-school systems.
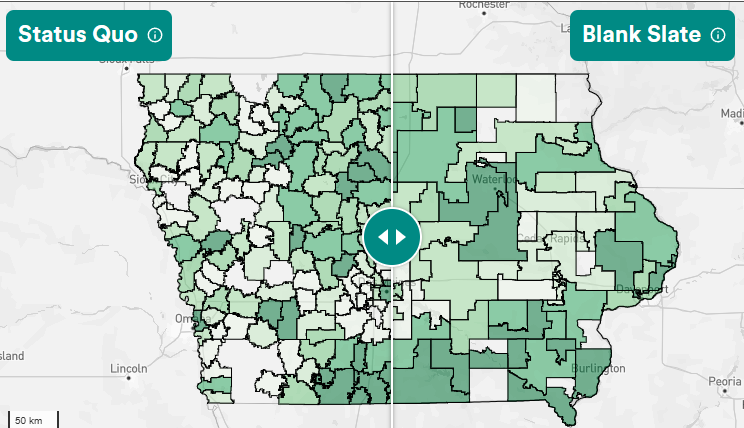
Zahava Stadler and Jordan Abbott, Redrawing the Lines: How Purposeful School System Redistricting Can Increase Funding Fairness and Decrease Segregation (interactive map), (New America, 2025), newamerica.org/redrawingthelinesmap.
For this report, we seek to do just that. We draw on the machine-learning methods often used for legislative redistricting to simulate new school system boundaries and measure their impact on segregation and tax-base equity. This report and its accompanying interactive map and data tool show how specific redistricting choices can create fairer school systems for our children.
Gains from Different Approaches to School System Redistricting
This report presents three redistricting models and assesses: (1) how well they equalize per-pupil property tax capacity across districts; (2) how much more representative the proposed districts are of statewide student racial demographics; and (3) how much more similar the proposed districts’ poverty rates are to the statewide school-aged poverty rate.
The first model, which we call blank-slate redistricting, entirely replaces each state’s school district map with one optimized for gains in tax-base equality and integration between school districts. In the average state analyzed, this model would produce:
- 66.6 percent fairer access to local property tax revenue
- 47.6 percent greater racial integration
- 65.0 percent greater economic integration
The second model, county-based redistricting, measures the gains in tax-base equality and integration that would result if all school districts had the same borders as counties. This model is not algorithmically optimized but uses existing jurisdictional boundaries to provide a point of comparison with the other models. In the average state analyzed, this approach would produce:
- 39.0 percent fairer access to local property tax revenue
- 40.7 percent greater racial integration
- 57.2 percent greater economic integration
The third model, redistricting by merger, strategically merges existing school districts to create an optimized map of larger districts that offer fairer access to property wealth and increase integration between school districts. In the average state analyzed, this approach would produce:
- 63.0 percent fairer access to local property tax revenue
- 48.2 percent greater racial integration
- 54.6 percent greater economic integration
All of these gains can be achieved without changing anything about property values or where families live—just by redrawing the imaginary lines that separate students from resources, and from each other.
A Time for Better Borders
State policy discussions about education funding usually focus on allocations: the formula that states use to determine how much money districts need for their schools and students. But state policy also governs many aspects of local funding. One underused way for states to make local school funding fairer is to redraw school district boundaries to encompass more equal tax capacities and more diverse student populations. With whole-state redistricting using any of the three approaches discussed in this report, states can better align district property tax bases to the number of students they support and ensure that all kids get a fairer share of the state’s property tax base, regardless of race, class, or neighborhood.
This is an opportune moment for states to take up this challenge. State budgets are newly threatened by severe cuts to federal safety net programs. Big reductions in health care funding and food assistance will leave states squeezed, and they will likely consider cuts to education funding. Property-poor districts depend more heavily on state aid, and across-the-board cuts are likely to affect their students the most, unless they can make up the difference by severely increasing local property taxes.6 Rather than subject these districts to the double whammy of state aid cuts and higher property taxes, states should try redistricting to eliminate big property-wealth disparities. The proposals in this report offer a new way to rightsize districts’ tax bases so they correspond with their student populations. By bringing all districts’ per-pupil tax capacity closer to the statewide property valuation per pupil, states can reduce any one district’s reliance on state aid, softening the blow of state budget cuts. At the same time, districts will have more of a local cushion—a tax base that can better support schools without onerous rate increases.
It has become commonplace to observe that disparities between our nation’s school systems prevent public education from being the “great equalizer” envisioned by schooling pioneer Horace Mann in 1848.7 Students of different backgrounds are not prepared to go on to participate in the economy, or in American democracy, on equal terms. But this problem arises in large part from ground-level divides that simply do not have to exist. Students of different races and economic backgrounds do not need to be segregated into different districts. Property tax capacity does not have to be so much higher in some school systems than others. These conditions are the result of the fact that states place their school district borders along lines that entrench and worsen America’s racial and economic divides.8
Just as legislative gerrymandering can shift the balance of political power in a state without changing anything about the voters who live there, the choice of where to draw school district boundaries can give the same kids, living in the same communities, access to better- or worse-funded public schools. By adopting a redistricting approach like one of the models presented here, states can choose a different present for their students and set them up for a better future.
Citations
- Institute of Education Sciences, National Center for Education Statistics, “Table 214.10: Number of Public School Districts and Public and Private Elementary and Secondary Schools: Selected School Years, 1869–70 through 2022–23” in Digest of Education Statistics, revised January 2024, source.
- Campbell F. Scribner, The Fight for Local Control: Schools, Suburbs, and American Democracy (Cornell University Press, 2016), 32–56, eBook Collection (Cornell Scholarship Online).
- See, for example, Bridget Higdon, “Gov. Phil Scott Rolls Out School District Consolidation Plan; Local Officials Weigh In,” Saint Albans Messenger, January 23, 2025, source; Hannah Gross, “More NJ School Districts Think Hard About Consolidating,” NJ Spotlight News, August 20, 2024, source.
- Jacqueline M. Nowicki, K–12 Education: Student Population Has Significantly Diversified, but Many Schools Remain Divided Along Racial, Ethnic, and Economic Lines (U.S. Government Accountability Office, June 2022), source.
- Zahava Stadler and Jordan Abbott, Crossing the Line: Segregation and Resource Inequality Between America’s School Districts (New America, February 2024), source.
- Krista Kaput and Bonnie O’Keefe, Fortifying Funding: How States Can Strengthen Education Finance Systems for the Future (Bellwether, February 2023), 12, source.
- See, for example, David Rhode, Kristina Cooke, and Himanshu-Ojha, “The Decline of the ‘Great Equalizer,’” The Atlantic, December 19, 2012, source; Thomas B. Edsall, “Is Education No Longer the ‘Great Equalizer’?” New York Times, June 23, 2021, source; and Arne Duncan, “Education: The ‘Great Equalizer,’” Britannica, 2018, source.
- Zahava Stadler and Jordan Abbott, Crossing the Line: Segregation and Resource Inequality Between America’s School Districts (New America, February 2024), source.