Findings
Below we highlight several key findings and provide 10 charts to help visualize the data. For the full reports on top-line findings and complete survey results, see appendices 1-4.
Mixed Awareness of the Public Library’s Online Offerings
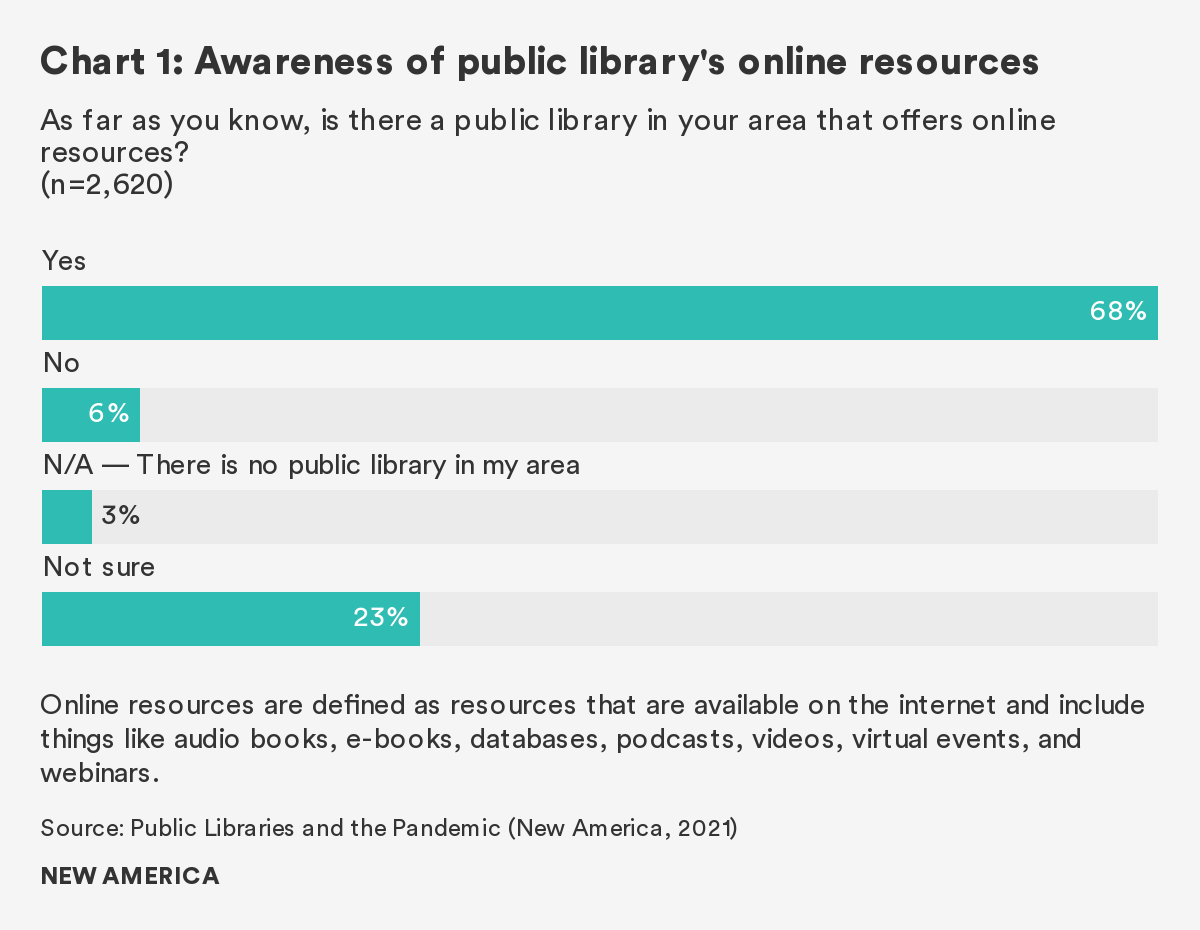
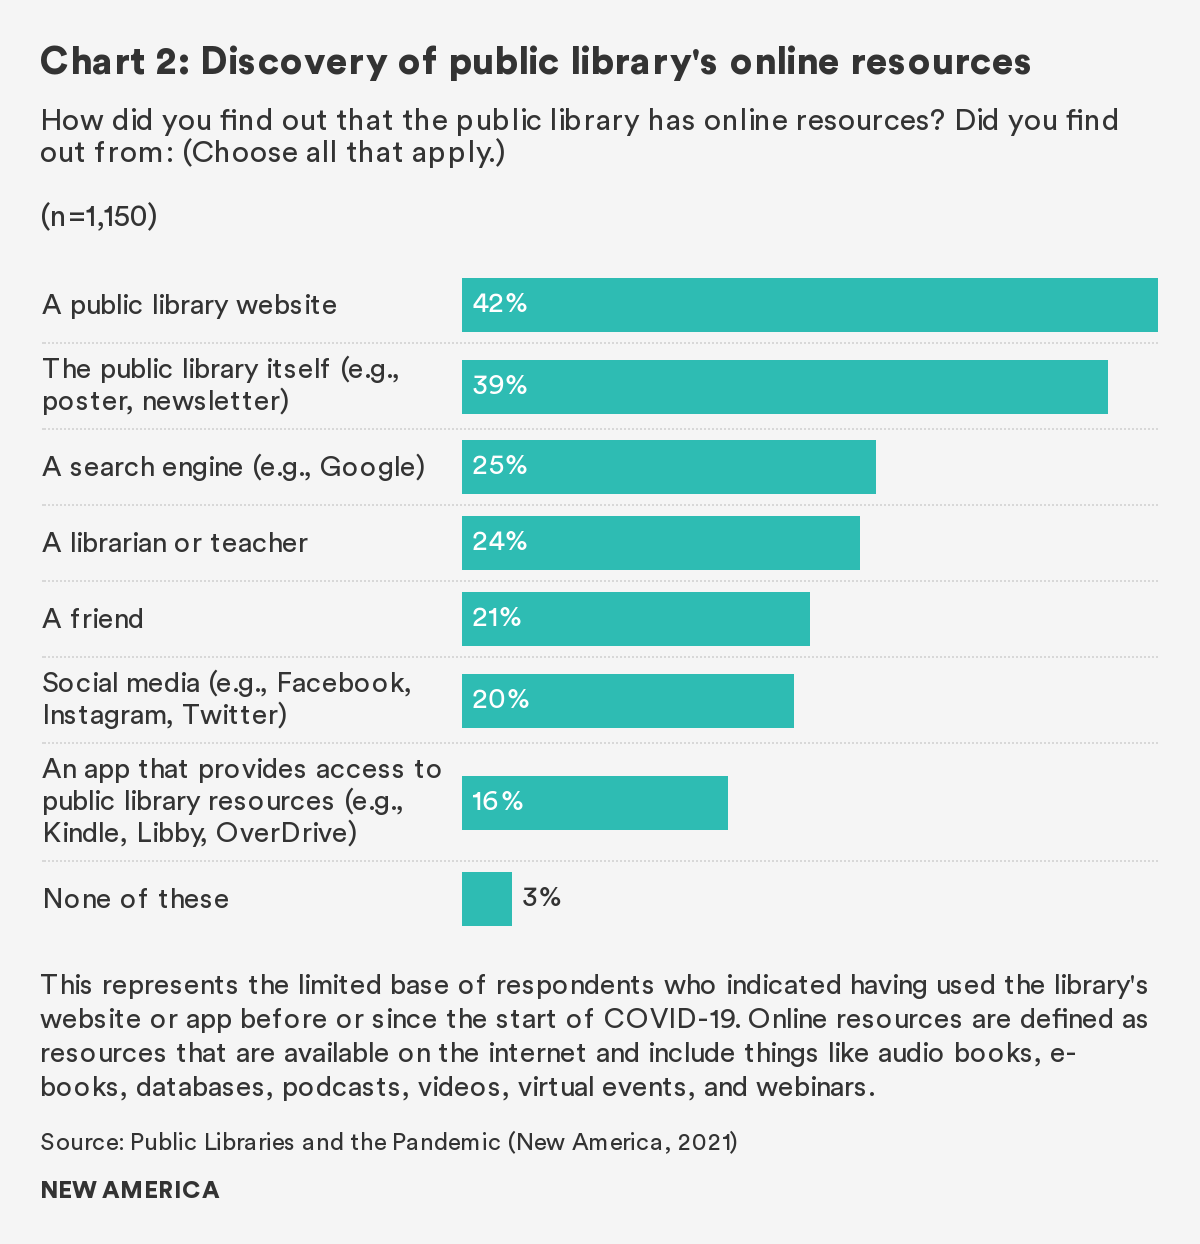
Two out of three respondents to the general public survey—68 percent—said they were aware of a public library in their area that offered online resources, as shown in Chart 1. Nearly one-quarter (23 percent) were not sure. Among the respondents who had used a public library’s online resources, 42 percent said they found out about them from a library website and 39 percent from the library itself (this included examples such as seeing a library poster that informed them of online resources). About 1 in 4 pointed to a librarian or teacher (24 percent) or a search engine like Google (25 percent). See Chart 2.
When asked what their library did to encourage people to use the library during the pandemic, relatively low numbers—no more than 1 in 4—were aware of such offerings as curbside delivery, the elimination of late fees, or the provision of Wi-Fi outside of the building. Thirty-six percent were unsure whether the library had done any of those things.
Online Resources Defined
In the survey questions, “online resources” were defined as resources that are available on the internet and that include things like audio books, e-books, databases, podcasts, videos, virtual events, and webinars.
The Educators’ Perspective
There is room for improvement in how libraries publicize their programs and services.
- Only about 1 in 7 educators think that “virtually all” (3 percent) or “most” (11 percent) of their clients1 use the library’s online resources—they are far more likely to say it is “some” (31 percent) or “few” (39 percent).
- 58 percent believe that the main reason their clients do not use the library’s online resources is because their clients do not know about them.
- The vast majority (80 percent) agree that it is important for a person in their position to be knowledgeable about the library’s programs and services, but a surprisingly high percent (38) think the library does a poor job getting the word out.
A Shift Toward Online Resources
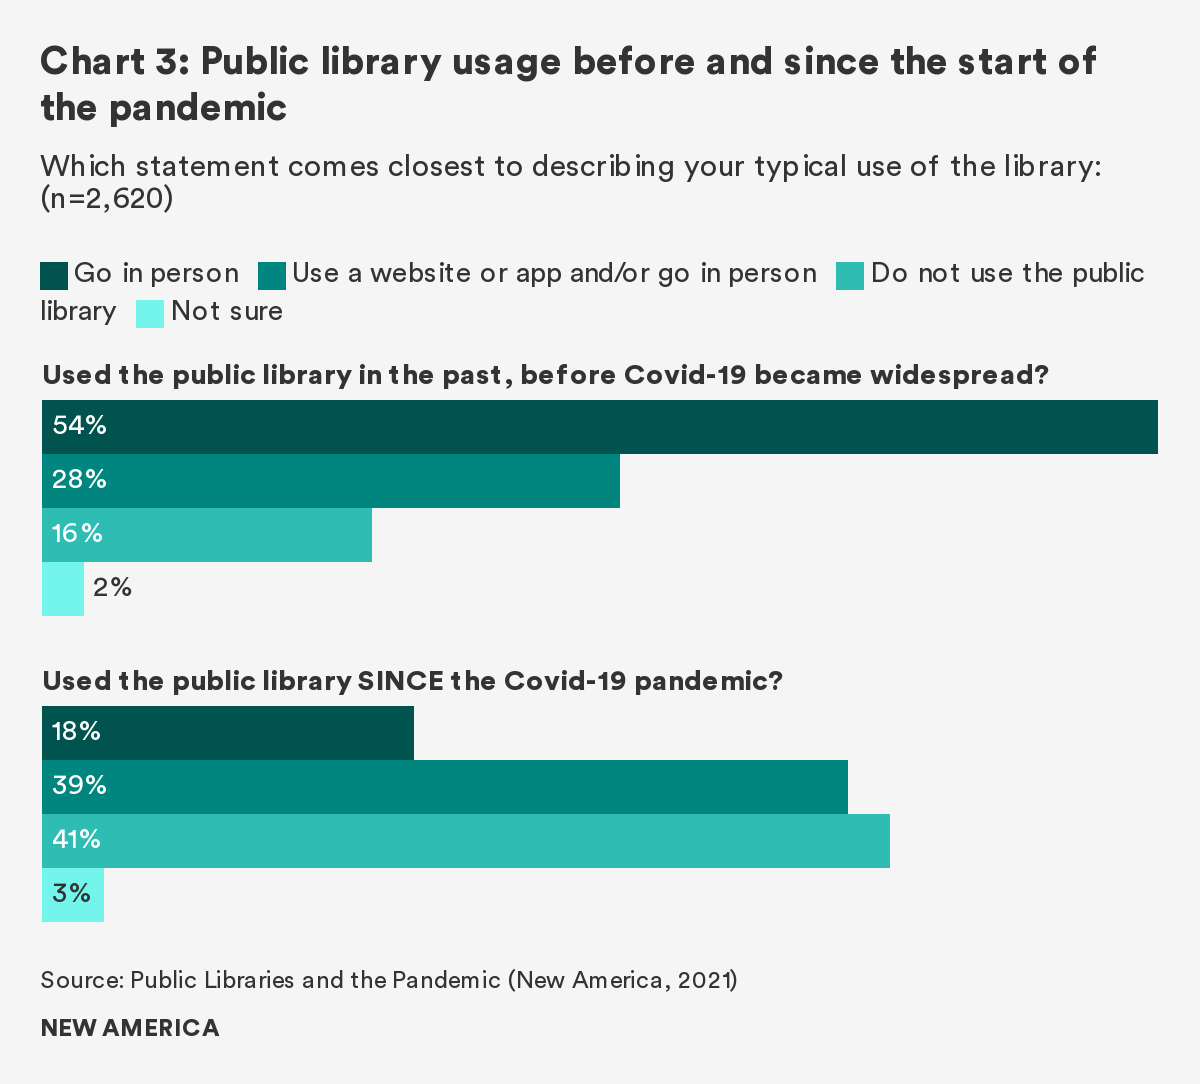
In-person visits to the public library obviously dropped as COVID-19 closed down daily life. Survey respondents who said visiting the library in person was the typical way they used the public library went from 54 percent pre-pandemic to 18 percent during the pandemic. But the question we were most interested in answering was: What was the effect of COVID-19 on the use of the public library’s website or app and the online resources (such as e-books) offered within them? According to the survey results, the impact is indisputable. Twenty-eight percent of survey takers indicated that they had used the public library’s website or app before COVID-19 became widespread, compared with 39 percent who said they did so after the pandemic started, for a net increase of 11 percentage points, shown in Chart 3. Moreover, among those who said they started to use online resources after COVID-19 happened, 2 in 3—67 percent—said the pandemic was a major reason.
Mostly Positive Attitudes toward the Public Library and Its Online Resources
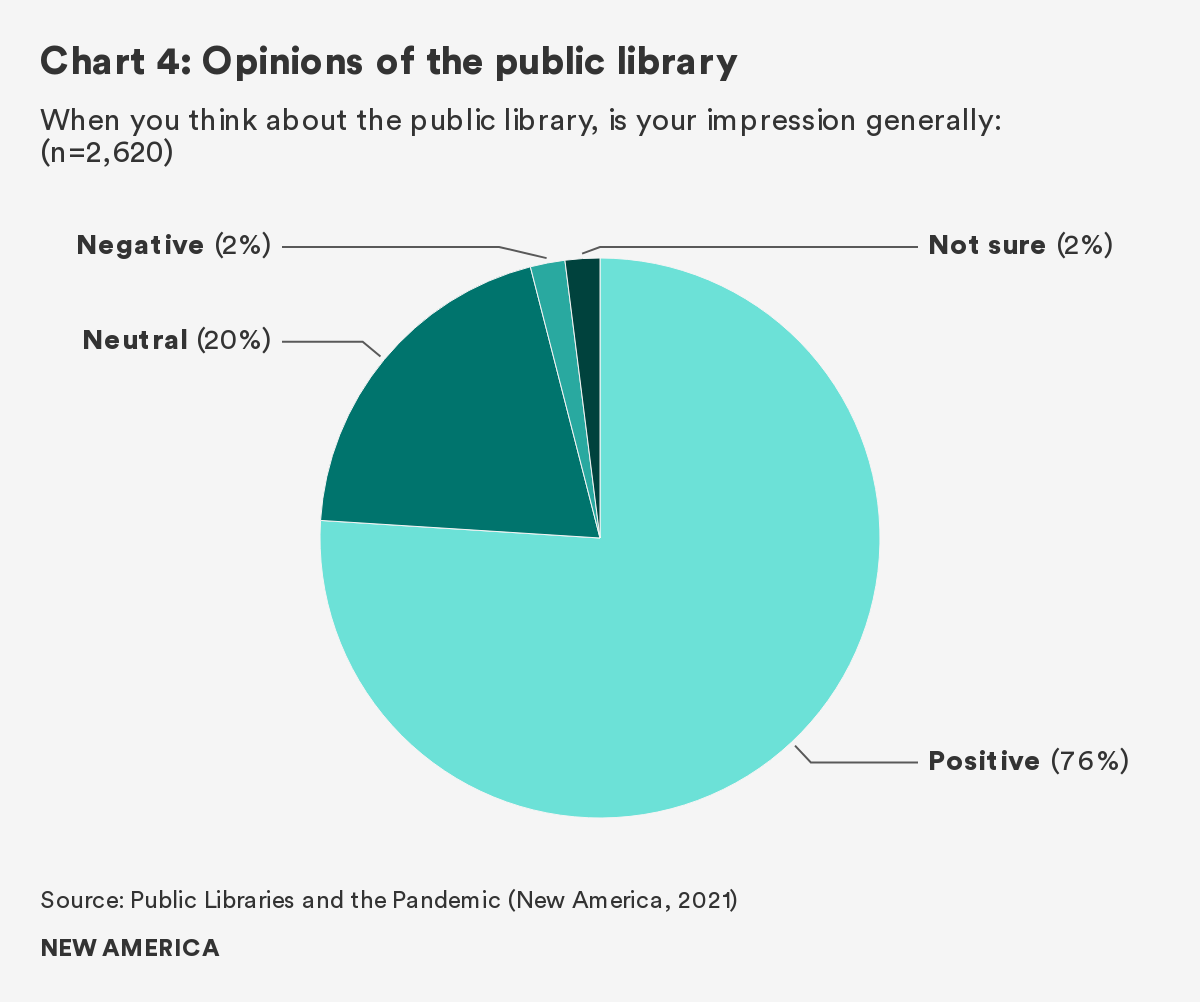
Three-quarters of respondents said they have a positive impression of the public library, as shown in Chart 4. Fully 2 out of 3 (66 percent) report that they currently have a public library card. And among those respondents who have used the public library’s online resources, the vast majority give them positive ratings—47 percent rated online resources “good” and 43 percent rated them “excellent.” A similarly large percentage said it is “very easy” (41 percent) or “somewhat easy” (45 percent) to find online resources from the public library.
But once they get into those online resources (such as a database or e-book library), many report having trouble finding what they want. Just half (49 percent) say that the statement “I easily find what I’m looking for” describes what usually happens when they try to get online resources.
The Educators’ Perspective
More than half the educators surveyed agreed with the statement: “My clients would be more likely to use the public library’s online resources if the interface was more user friendly” (15 percent strongly and 41 percent somewhat), although another 28 percent were unsure.
Disparities in Access to and Use of the Public Library’s Online Resources
Survey results showed disparities in access to and awareness of public library resources across a variety of variables, including income, age, and racial identity. The results showed almost no meaningful differences across education levels or whether respondents lived in an urban, suburban, or rural area; respondents across these measures responded similarly to questions regarding library access and use.
Differences by Income
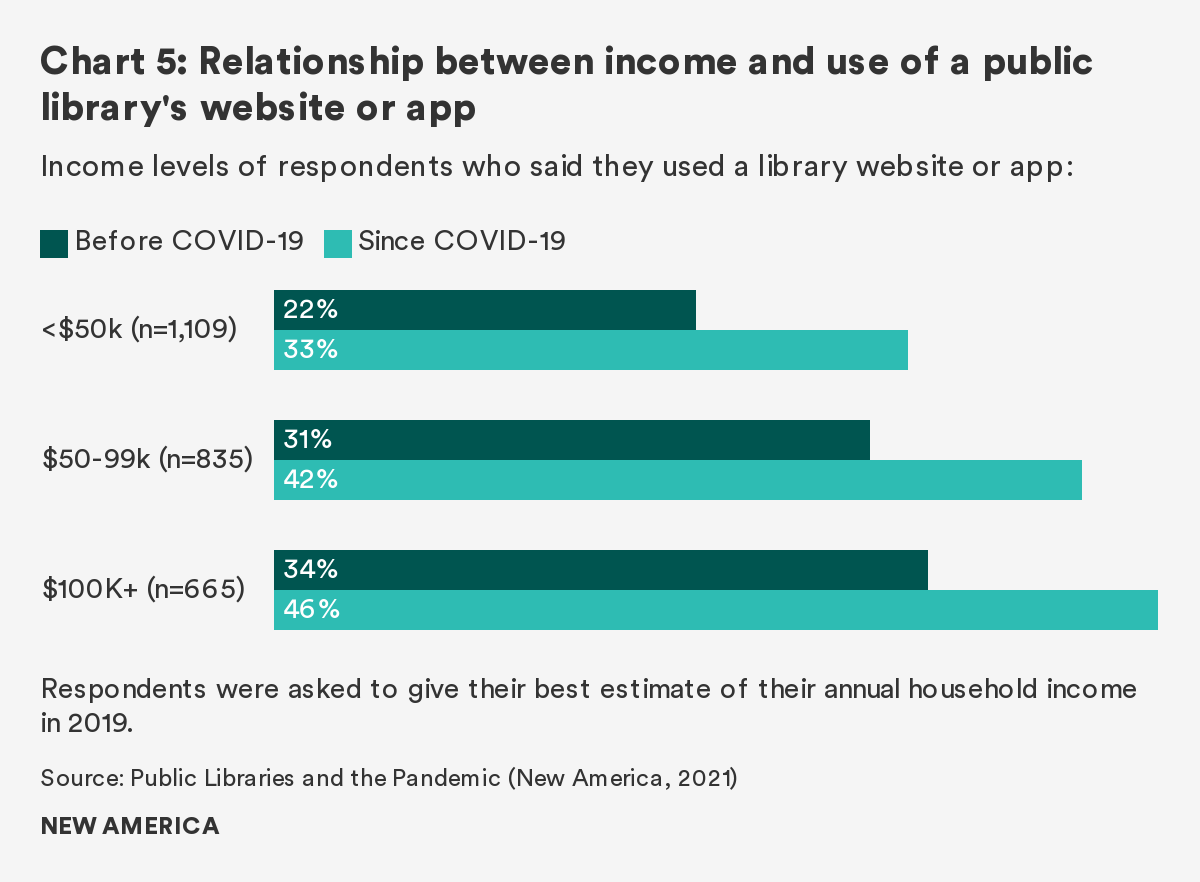
The higher the household income respondents reported, the more likely they were to answer yes when asked if there is a public library in their area that offers online resources: 62 percent for those whose annual household income is less than $50,000 annually, compared with 71 percent for incomes of $50,000–$99,000 and 74 percent for incomes of $100,000 or more. Chart 5 shows that, similarly, those with higher incomes are more likely to say they used a public library’s website or app both before and after the pandemic. For example, 33 percent of respondents with a household income of less than $50,000 said they used a library’s website or app since the pandemic started compared with 46 percent of those with incomes of more than $100,000. Though this question cannot be used to draw objective conclusions about whether or not there are more often libraries that offer resources in proximity to households with higher income levels, it does indicate that both access and awareness may be predicted by income level.
Lost Main Source of Internet Access
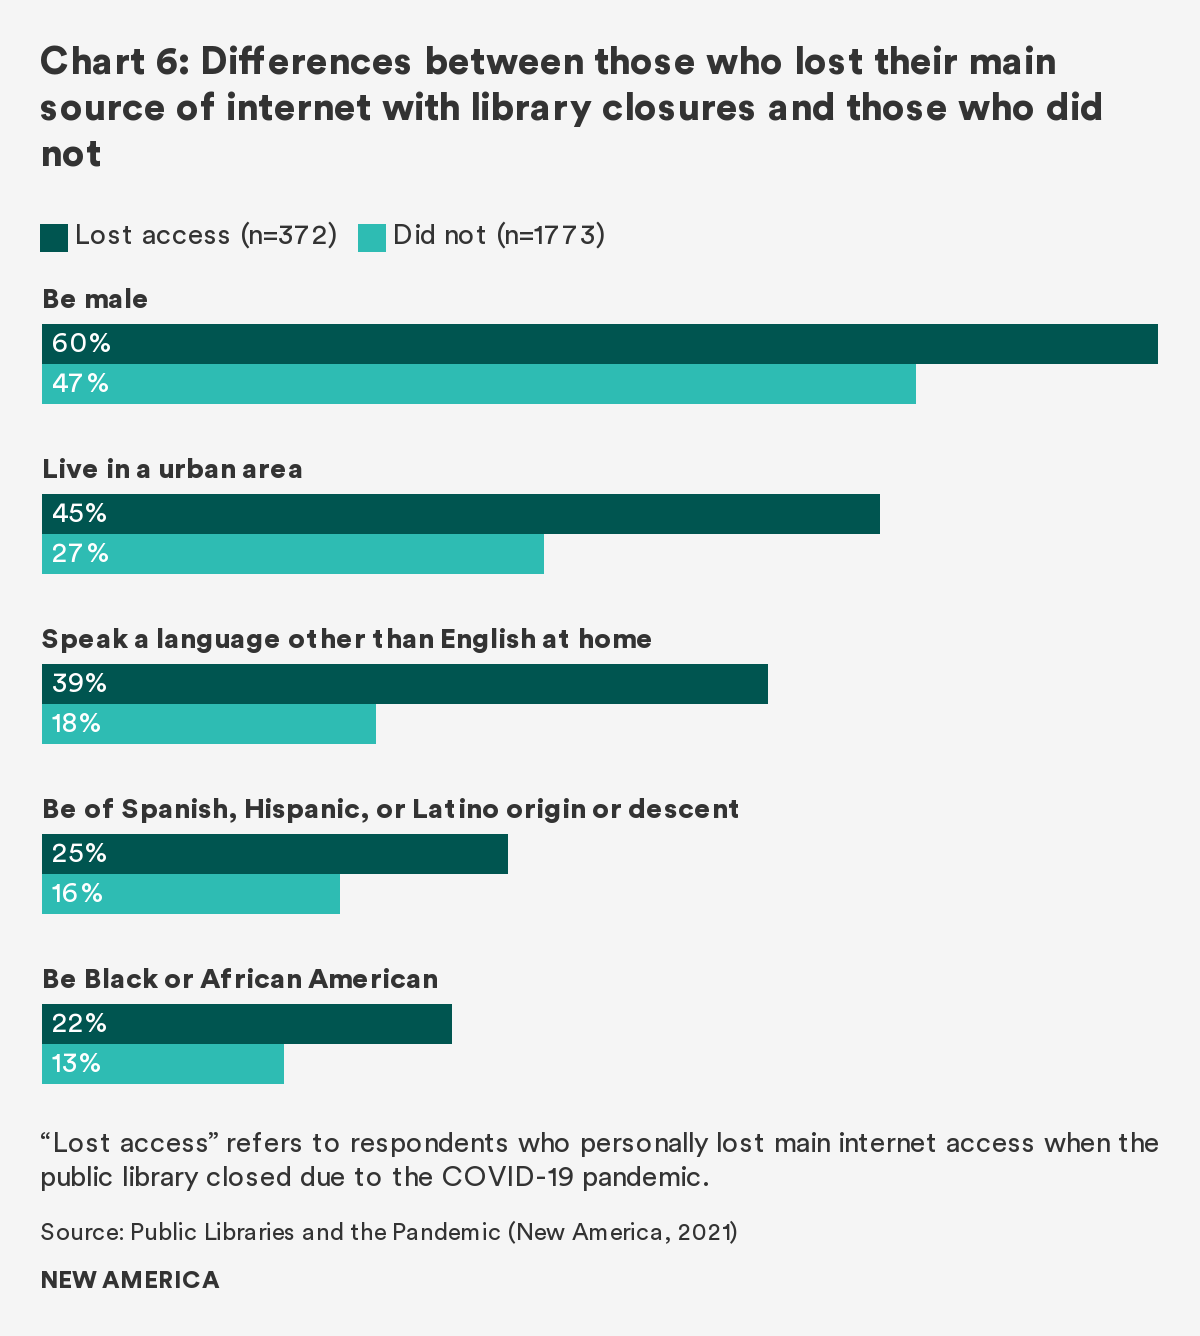
Furthermore, the survey shows meaningful differences between those who lost their main source of internet access when many public libraries shut down in March 2020 (15 percent of the sample) and those who did not (85 percent). Those who lost access were much more likely to be male, to live in an urban area, to say there is a language other than English spoken in their home, and to be a person of color. This finding is one of very few in the survey to show a meaningful difference between respondents living in urban and non-urban areas. Chart 6 shows the proportions of respondents in each category.
The Educators’ Perspective
These findings are corroborated by the educators surveyed.
- Nearly 40 percent of respondents describe their client base as having a “low” or “very low” income, and more than 1 in 4 report “virtually all” or “most” of their clients speak a language other than English at home.
- A plurality of educators (42 percent) say “some” of their clients lost their main internet access as a result of COVID-19; another 4 percent said “virtually all” and 8 percent said “most.”
- Among those educators who say they have clients who lost access, 45 percent say their clients were most likely unable to find a new internet source.
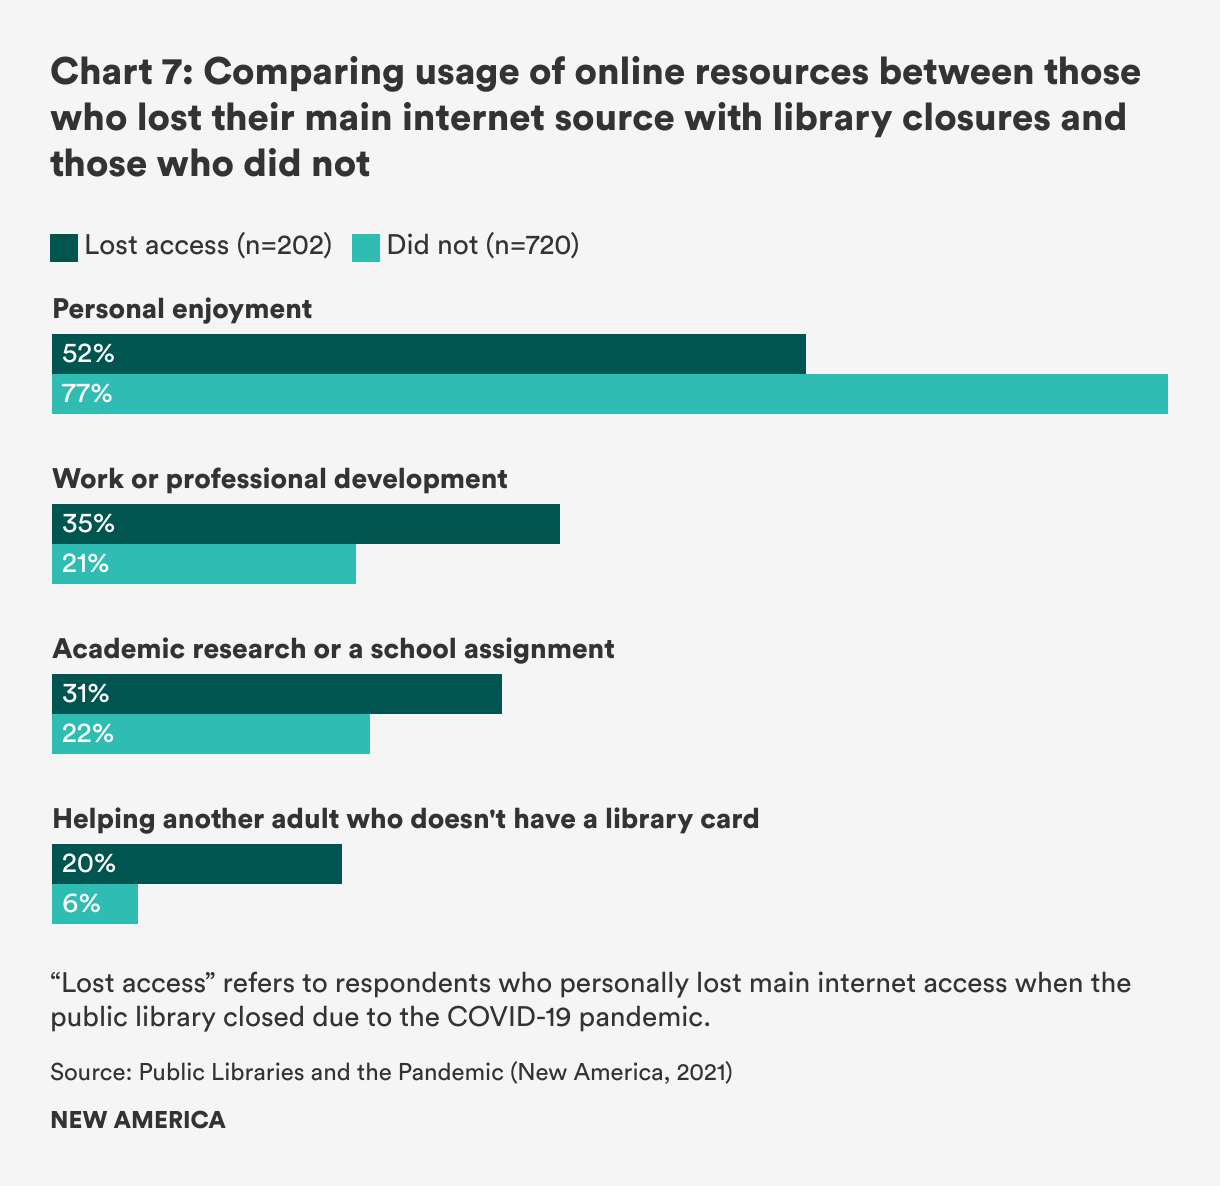
There are also notable differences between those who lost their main internet access and those who did not when it comes to the reasons people use the public library’s online resources. Those who lost their main internet access are more likely to say they use online resources for school or work—or to help out another adult who is not a library card holder. They are less likely to say they use online resources for personal enjoyment. Chart 7 shows reported reasons for using online materials by those who lost their main source of internet with the library closures and those who did not.
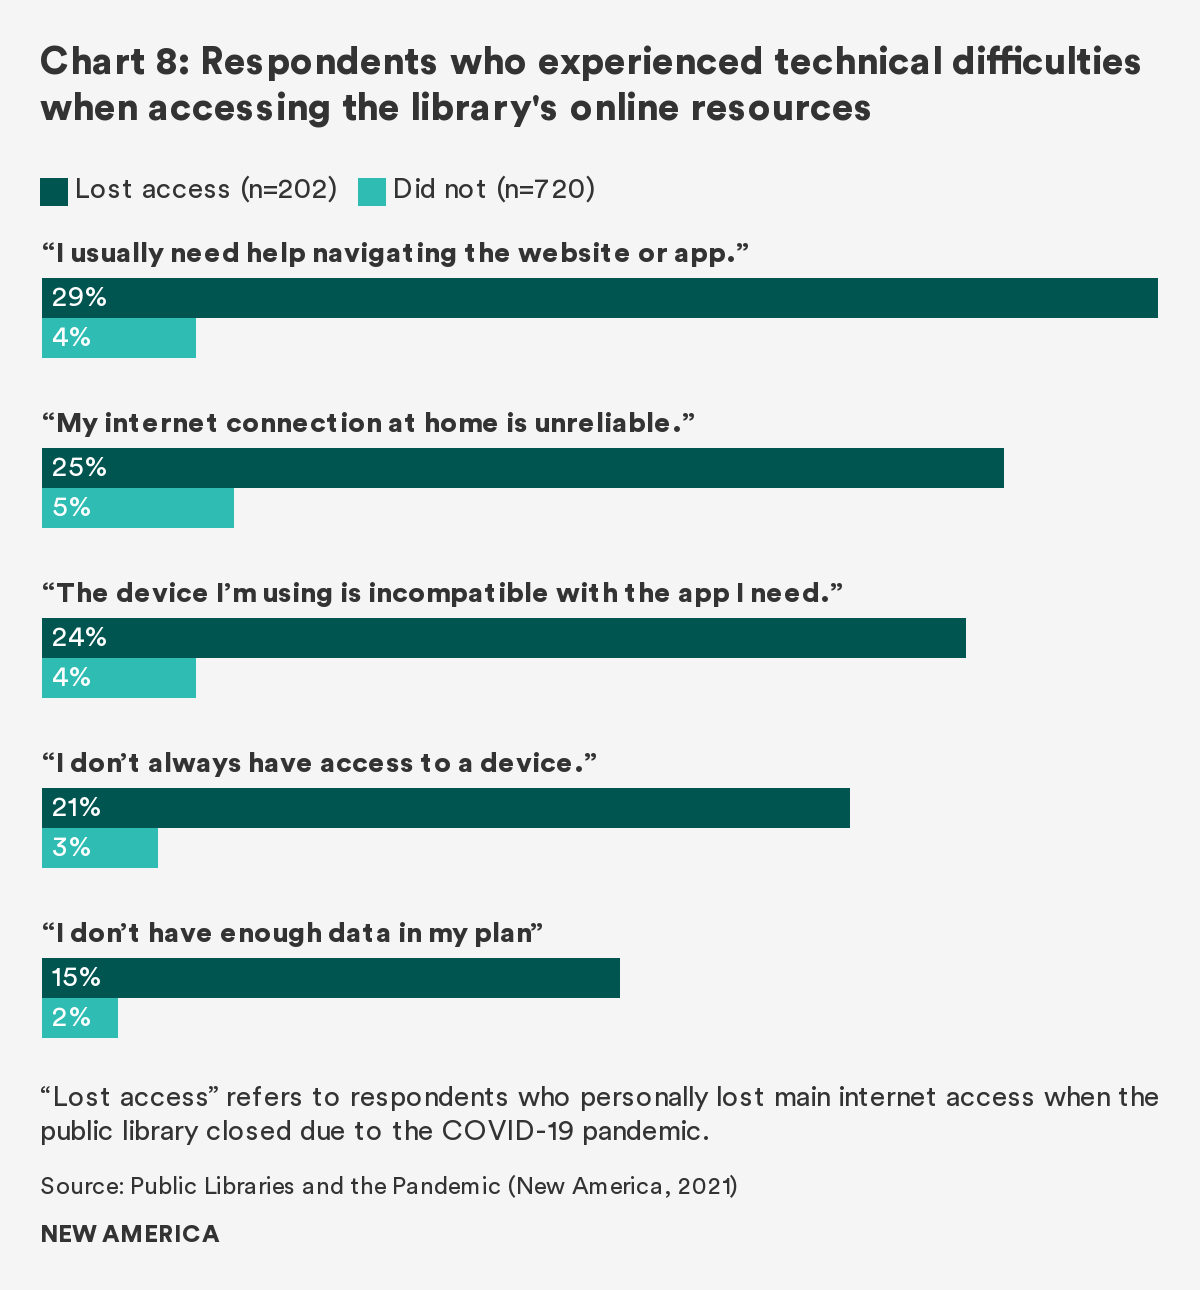
Those who lost their main internet access when the public libraries closed are far more likely to say they experienced five out of five technical obstacles when trying to get online resources, including restricted data plans, device incompatibility, and the need for assistance navigating the library website. Chart 8 shows the proportions of respondents experiencing technical difficulties among those who did and did not lose internet access when libraries closed.
Differences by Age
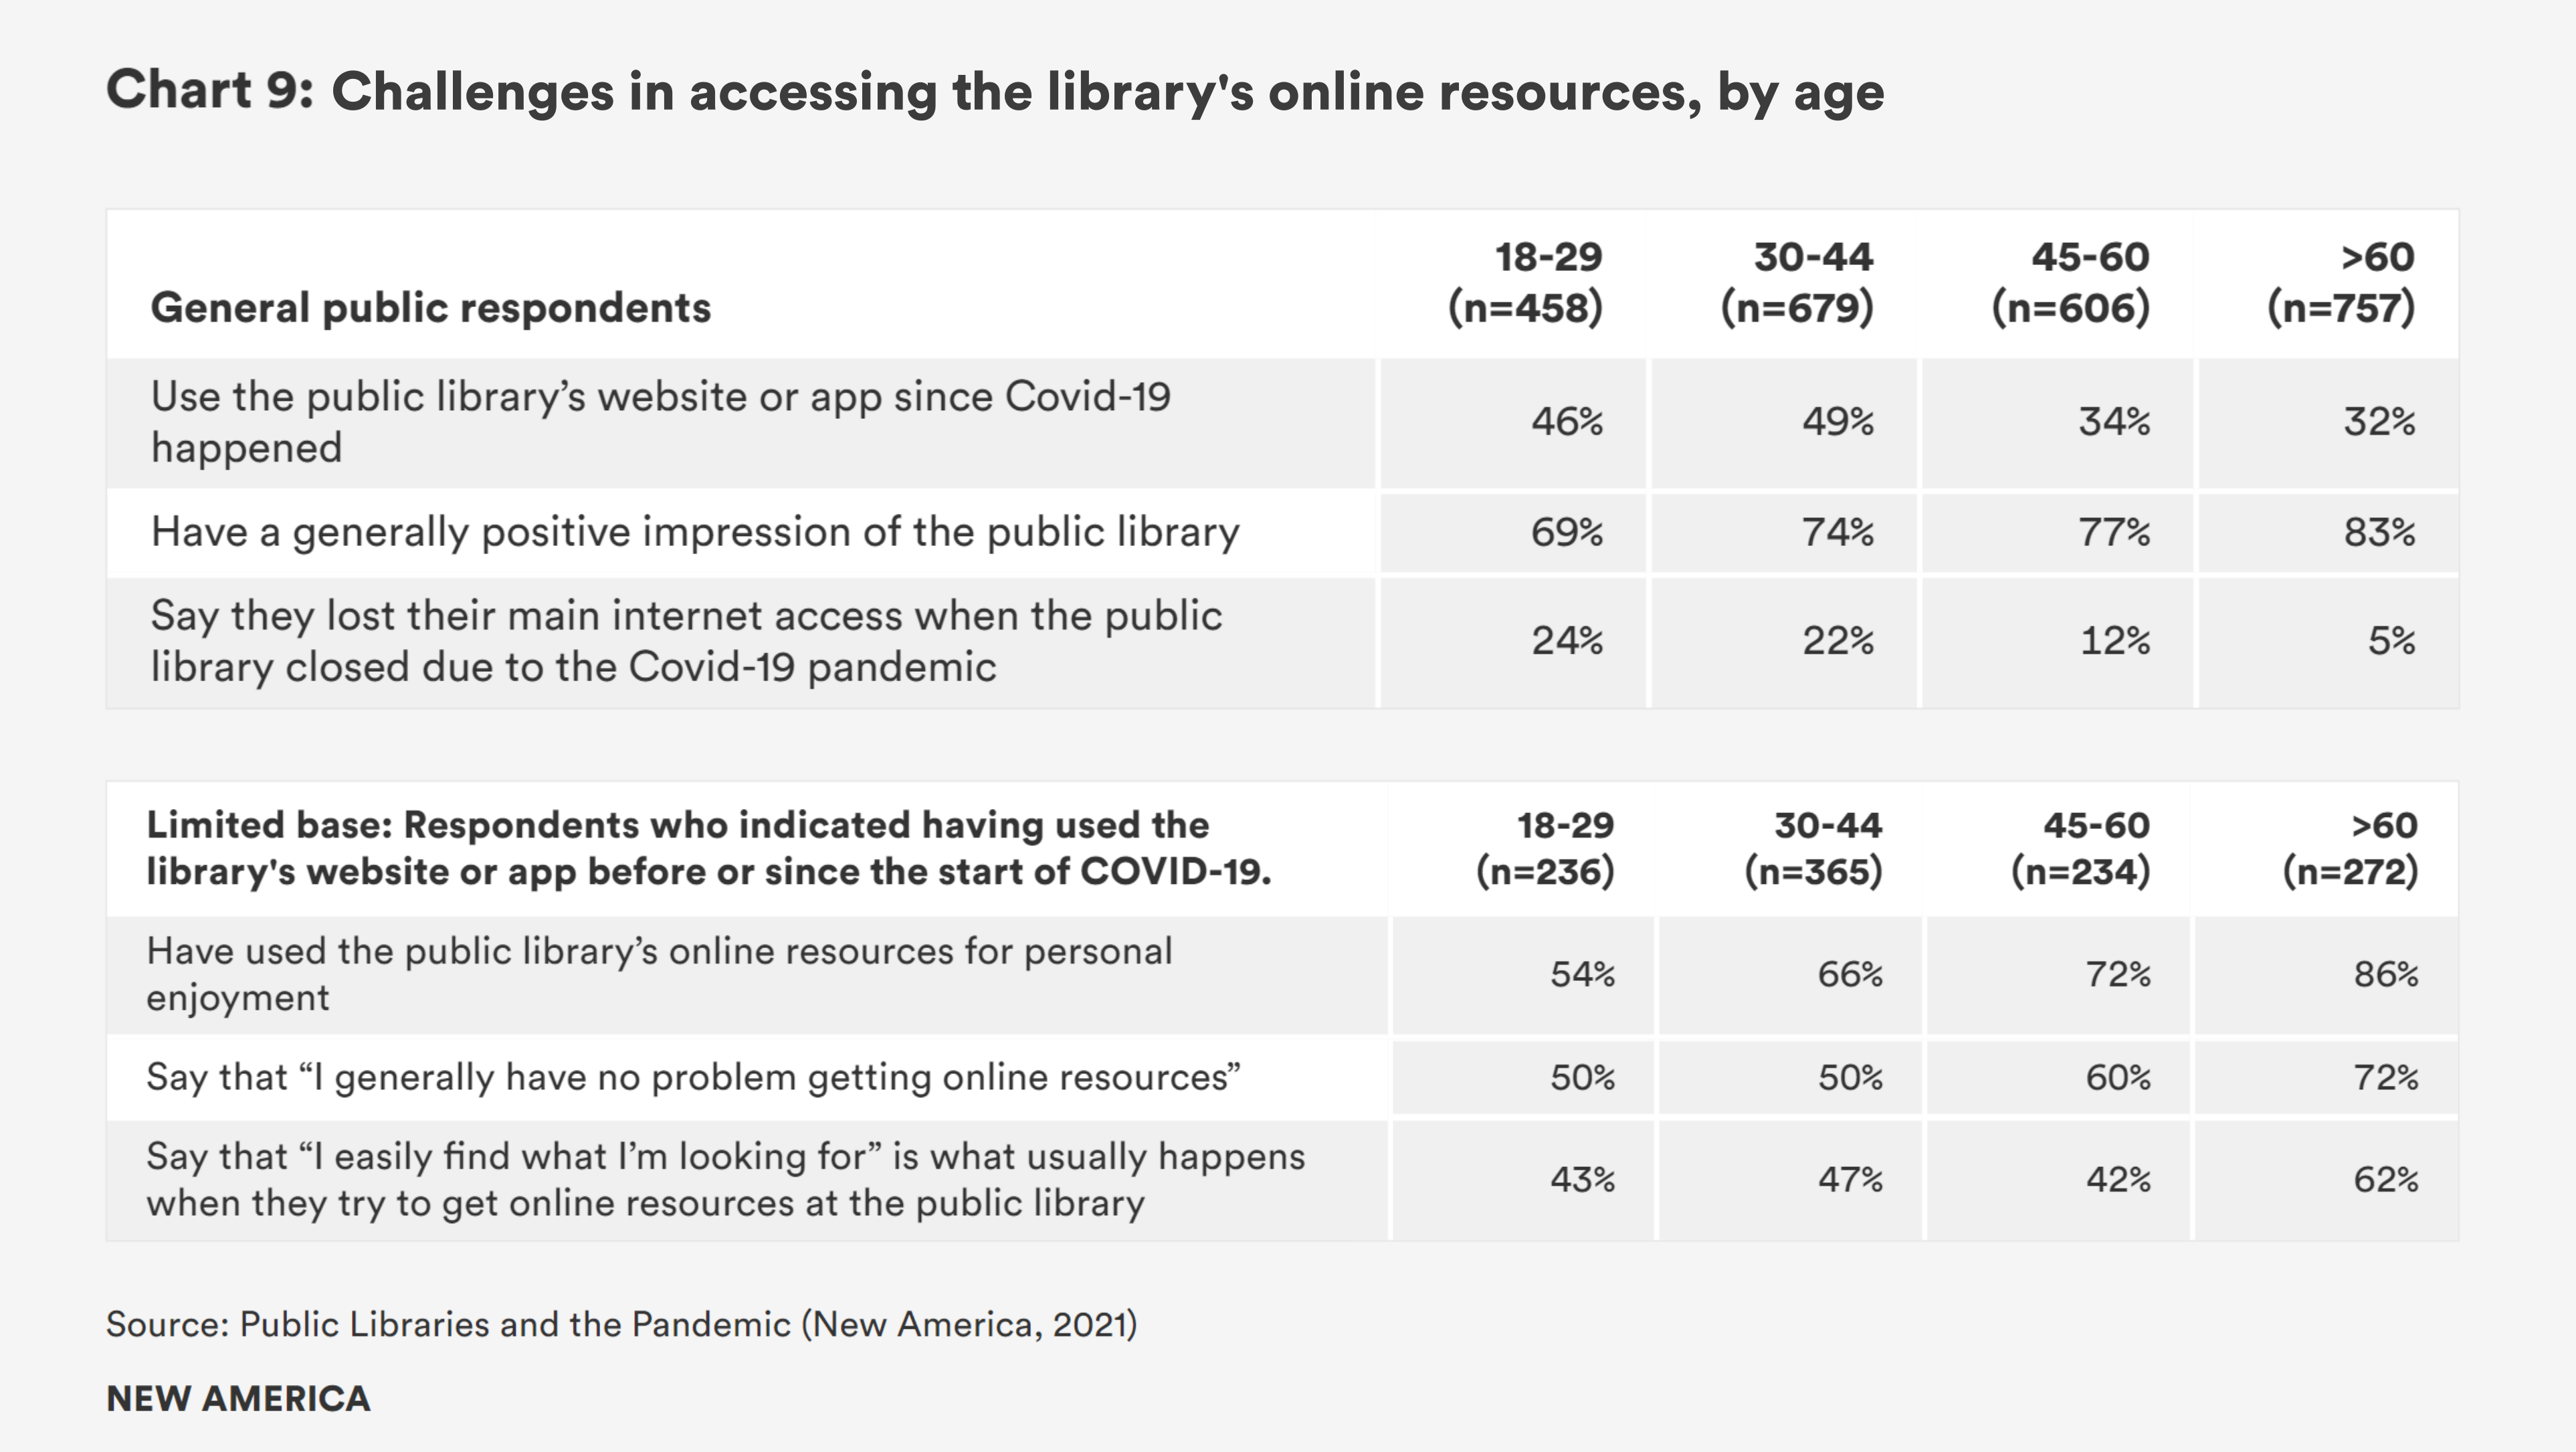
Respondents over the age of 60 were more likely to report having experienced no issues in finding the materials they look for on their library’s website, and more likely to say, “I easily find what I’m looking for” usually when they try to get online resources at the public library. These findings might contradict the common assumption that older citizens are less adept at using technology, pointing to possible differences in how different age groups utilize the library beyond the scope of this survey. Chart 9 shows the proportions of respondents by age who reported ease in accessing online materials through the public library.
Differences by Race/Ethnicity
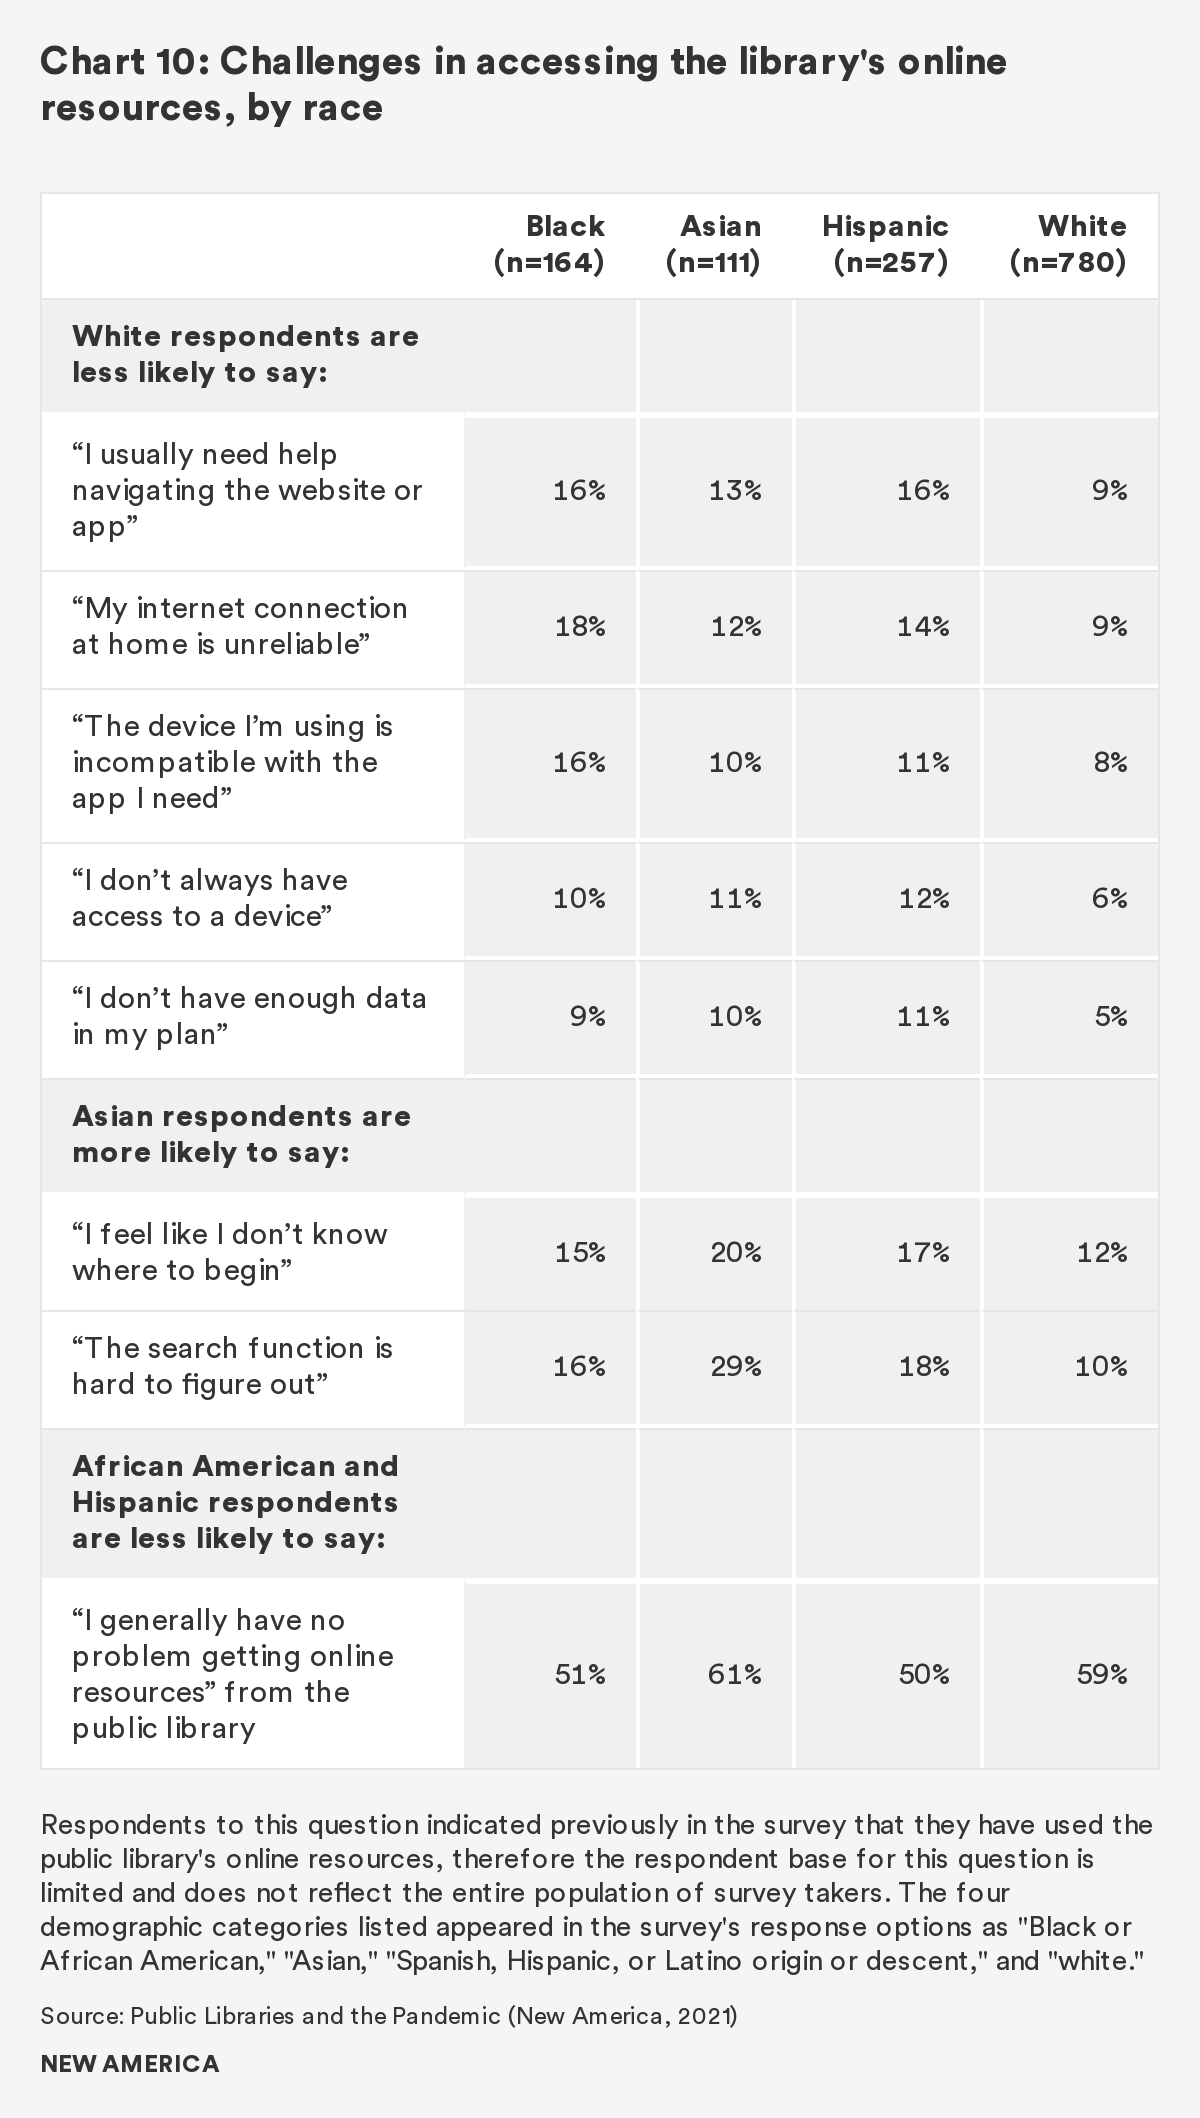
The general public survey results showed some differentiation among racial groups in questions about barriers of access. White respondents were less likely than any other group to report needing help navigating the library website, struggling to find what they are looking for, and experiencing an inability to access the internet from home. Asked about specific barriers, Asian respondents were more likely than other racial groups to say, “I feel like I don’t know where to begin” and “The search function is hard to figure out.” Asian respondents were also more likely to say, “The library doesn’t ever seem to have what I need online.” Meanwhile, Black, African American, and Hispanic respondents were less likely to say, “I generally have no problem getting online resources” from the public library.” Chart 10 shows the proportion of respondents from each group who reported barriers to accessing the library’s digital resources.
The Educators’ Perspective
Results from the educator survey echo these findings. For example, we asked:
There are many reasons people may NOT use online resources from the public library. Which of these do you think are true for your clients?
Percent of respondents choosing the following answers
58 – They don’t know about online resources
44 – They don’t have reliable or regular internet access
42 – The website or app would be confusing for them
38 – They probably think the library doesn’t have what they are looking for online
33 – It may be easier for them to look elsewhere
27 – There may be a lack of interest in online resources
12 – The waiting lists are too long
9 – They may have trouble seeing the words on a screen
Citations
- The survey of educators and community leaders used the term “clients” and not “students” to encompass the universe of people of all ages who participate in educational programs run by all types of community organizations, not just those run by schools.