“Private” Public Schools and Title I Distributions

Today, the Fordham Foundation released a report titled “America’s Private Public Schools” that describes the phenomenon of public schools that serve virtually no poor students.[1] The four states with the highest proportions of private public schools are New Jersey, Connecticut, Massachusetts, and Arizona. The first three states also have relatively low free and reduced price lunch participation rates (less than 30 percent) and poverty rates (11 percent or less). Arizona, however, is the outlier. Though 12 percent of schools in Arizona are considered private public schools through this analysis, nearly 40 percent of Arizona public school students participate in FRPL and nearly 20 percent live at or below the poverty line.
But what do high proportions of private public schools, or schools that serve few poor students, mean for state Title I allocations? Title I is the largest federal K-12 education program that aims to provide additional funds for services for low income students. Our analysis, described below, suggests that states with large concentrations of private public schools can feasibly get large amounts of Title I funding despite low overall poverty rates. This is counterintuitive because significant numbers of schools in these states serve virtually no poor students. However, a deeper look suggests that high concentrations of poverty in certain areas in these states may partially explain these patterns.
For our analysis, we used Federal Education Budget Project data on state demographics and federal funding in New Jersey, Connecticut, Massachusetts, and Arizona to calculate Title I distributions per poor student in each state. Given the first three states’ relatively low poverty rates (ranking 49th, 46th and 47th, respectively), one would assume that they would receive relatively low Title I allocations per poor student. However, that is not necessarily the case. In 2008, Massachusetts received the 15th highest per poor student Title I allocation in the country, while New Jersey received the 18th and Connecticut received the 22nd.
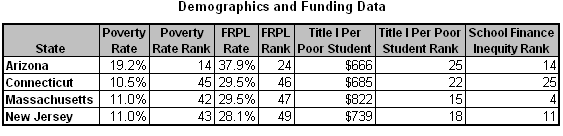
Arizona’s Title I allocation, on the other hand, is more closely aligned with the size of its impoverished population. Arizona had the 24th highest concentration of poor students and received the 25th highest per poor student Title I allocation.
However, examining Title I distributions alone overlooks the role that poverty concentrations – where certain areas within a state serve a large proportion of impoverished students while other areas do not – play in Title I distributions. Typically, schools and districts with high poverty concentrations relative to their state average, receive more Title I funding per pupil than schools and districts with low concentrations because of provisions in some Title I funding formulas. Because low-income schools and districts typically receive less state and local funding than high income schools, we can get a sense of whether high poverty concentrations exist in a state through an indicator calculated by the Department of Education called School Finance Inequity. This indicator represents the degree to which schools within a state are equitably funded, assigning more equitable states a low value, and less equitable states a high value.
According to 2007 data, Massachusetts was the 4th most inequitable state in the country, indicating that there are likely areas of high and low concentrations of poverty in the state and at least partially explaining the high percentage of private public schools and high Title I allocations. However, in Massachusetts, this high rate of inequity is not the result of under-funding poor districts. Instead, Massachusetts has a progressive education funding formula that provides additional funds for poor districts resulting in inequities that actually favor poor schools.
The other three states are somewhat more equitable than Massachusetts, though still likely have areas of high poverty concentrations that are obscured by other considerations in state funding mechanisms. New Jersey and Arizona[2] were the 11th and 14th most inequitable states, while Connecticut was the 25th most inequitable.
The Fordham report reveals an important and rarely-mentioned aspect of the public school system – public schools that serve few, if any, poor students. Although these schools serve only 4 percent of the public school population, we need to better understand how they affect Title I distributions in their states and school districts.
[1] Elementary schools with free and reduced price lunch participation lower than 5 percent and middle and high schools with free and reduced price lunch participation lower than 3 percent.
[2] While one would expect a higher degree of inequity in Arizona due to the high poverty rate and high rate of private public schools, it is possible that the Arizona education funding formula or property tax rules compensate in some way for high poverty concentrations. Similarly, it is possible that Arizona’s significant charter school system, which allows students to attend schools unrelated to their physical jurisdiction, could be influencing student enrollment patterns.
More About the Authors
Issues
Related
5 Takeaways from the Trump Plan Overhauling College Accreditation

Accreditation on the Ground: A Q&A with Heather Perfetti