Table of Contents
- Executive Summary
- I. Introduction
- II. What We Know about Parler and Publicly Available Parler Data
- III. Contesting the Election Results: The Road to the Capitol and Indictments
- IV. Elite Signaling and Parler’s Influencers: Topic Modeling & Link Analysis
- V. Examining The Objector Parler Accounts
- VI. What the Parler Metadata Tells Us
- VII. Implications & Takeaways
VI. What the Parler Metadata Tells Us
One of the most remarkable features of the Parler data that has been publicly released to date from the 1.0 version of the site is the high volume of posts that contain metadata indicating timestamps, and geo coordinates indicating where a user indicated their location. As noted earlier, the two Parler datasets released by Aliopoulos, et al. and hacktivist @donk_enby only represent snapshots of the platform before it was taken offline. However, when we performed analysis on both datasets we found a great deal of overlap between the two datasets and patterns in the data. We also performed a consistency check to identify where there might be differences in each of the two datasets, which increased our confidence that it is possible to make apples to apples comparisons between the Aliopoulios and @donk_enby data.
With metadata for more than 13.25 million individual Parler user accounts in the Aliapoulios, et al. dataset and metadata for more than 1 million video posts, there is a substantial amount of information embedded in the publicly available data. For instance, the @donk_enby dataset contained more than 1 million video posts, but of these only a small fraction contained both geo coordinates and timestamps. A total of 69,387 (6.73 percent) of video metadata contained geographic information indicating the physical location of the device that captured the video. Thousands of these geocoded metadata are manifestly fake or indicate locations far from the United States.
Despite the above stated limitations, video metadata holds valuable clues about Parler user behavior before January 6. In all, 59,791 video posts have metadata indicating geo coordinates within the United States and timestamps from the launch of the social media platform in 2018 to the day Parler was taken offline on January 10, 2021. In at least those instances, the video metadata potentially connects Parler posts to events at a particular place and time, though it is important to note that the video metadata is only that. We have not yet examined all of the video content itself and, given the huge scale of posts collected in total, the video data cannot, in any case, be construed as representative. Nor is it possible to directly extrapolate insights into the real-world behaviors of Parler’s intended demographic market from a comparison between these types of posts and, say, other types of location-based event data. Nonetheless, we were able to learn a lot about the peculiarities of the platform when we took a closer look at the timestamps and geo coordinates embedded in the publicly available metadata.
Evaluating the Timestamp Metadata
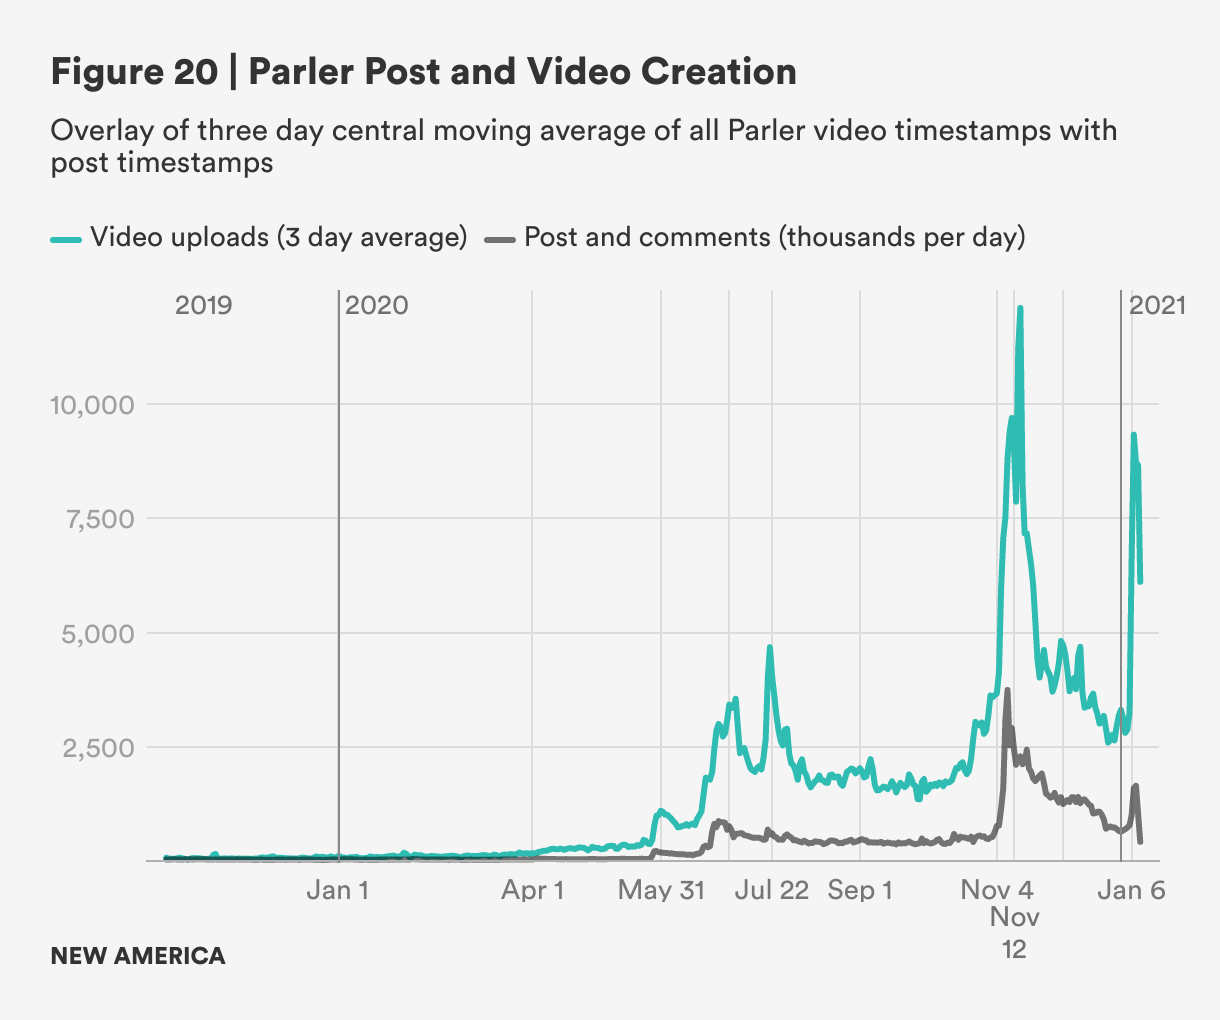
The graph shown in Figure 20 represents the number of Parler videos created per day and the number of Parler posts and comments created per day over the period from mid-November 2019 through January 10, 2021. The data in this graph represent vastly different scales: the video creations (with the black line) tops at around 12,000 videos per day, while the post and comments creation tops at over 3.5 million videos per day. However, the peaks, which are marked with green vertical lines to give a refined alignment of the two patterns seen to mirror each other, coincide closely with significant political events and demonstrations. Some notable comparisons:
- The May 31, 2020 peak rises rapidly and tails off slowly, and coincides with the May 31 George Floyd protests.1
- The broad July 2, 2020 peak begins its rise with the resumption of Trump campaign rallies2 and culminates with the Mount Rushmore campaign rally.3
- The sharp July 22, 2020 peak coincided with a riot in Portland, Ore. in which protesters tried to set fire to the Portland courthouse.4
- The post-election peaks on November 11-12, 2020 and on November 14-15, 2020 coincides with the competing pro-Trump rallies: March for Trump and Million MAGA March in Washington, D.C. and nationwide, organized by Amy Kremer and Ali Alexander, respectively.5
An additional useful comparison is the “joined” timestamps of Parler accounts versus the posting rate, which we overlay with the post comment dates, again with separate scales as the posts outnumber the joins by more than an order of magnitude by a factor of about 23. What is remarkable is that the rate of Parler user account creation replicates the peak structure of the posts and videos, although the account creation rate falls off much more quickly after an event than do the posts.
This suggests two competing hypotheses about the coincidence of peak patterns. One hypothesis is that the new accounts drive the increased creation of posts and videos. Another hypothesis is that the increase in user account creation and posts was the result of an orchestrated marketing campaign that combined astroturfed user engagement and was amplified by bot-like activity. This second hypothesis would indicate that there was a substantial amount of inauthentic behavior on the platform in the lead up to the elections and the post-election period before January 6. We cannot yet say conclusively whether the second hypothesis is true. But our ongoing analysis indicates that there is some evidence to suggest that it is not necessarily just the creation of new user accounts that drove the increase in activity on Parler.
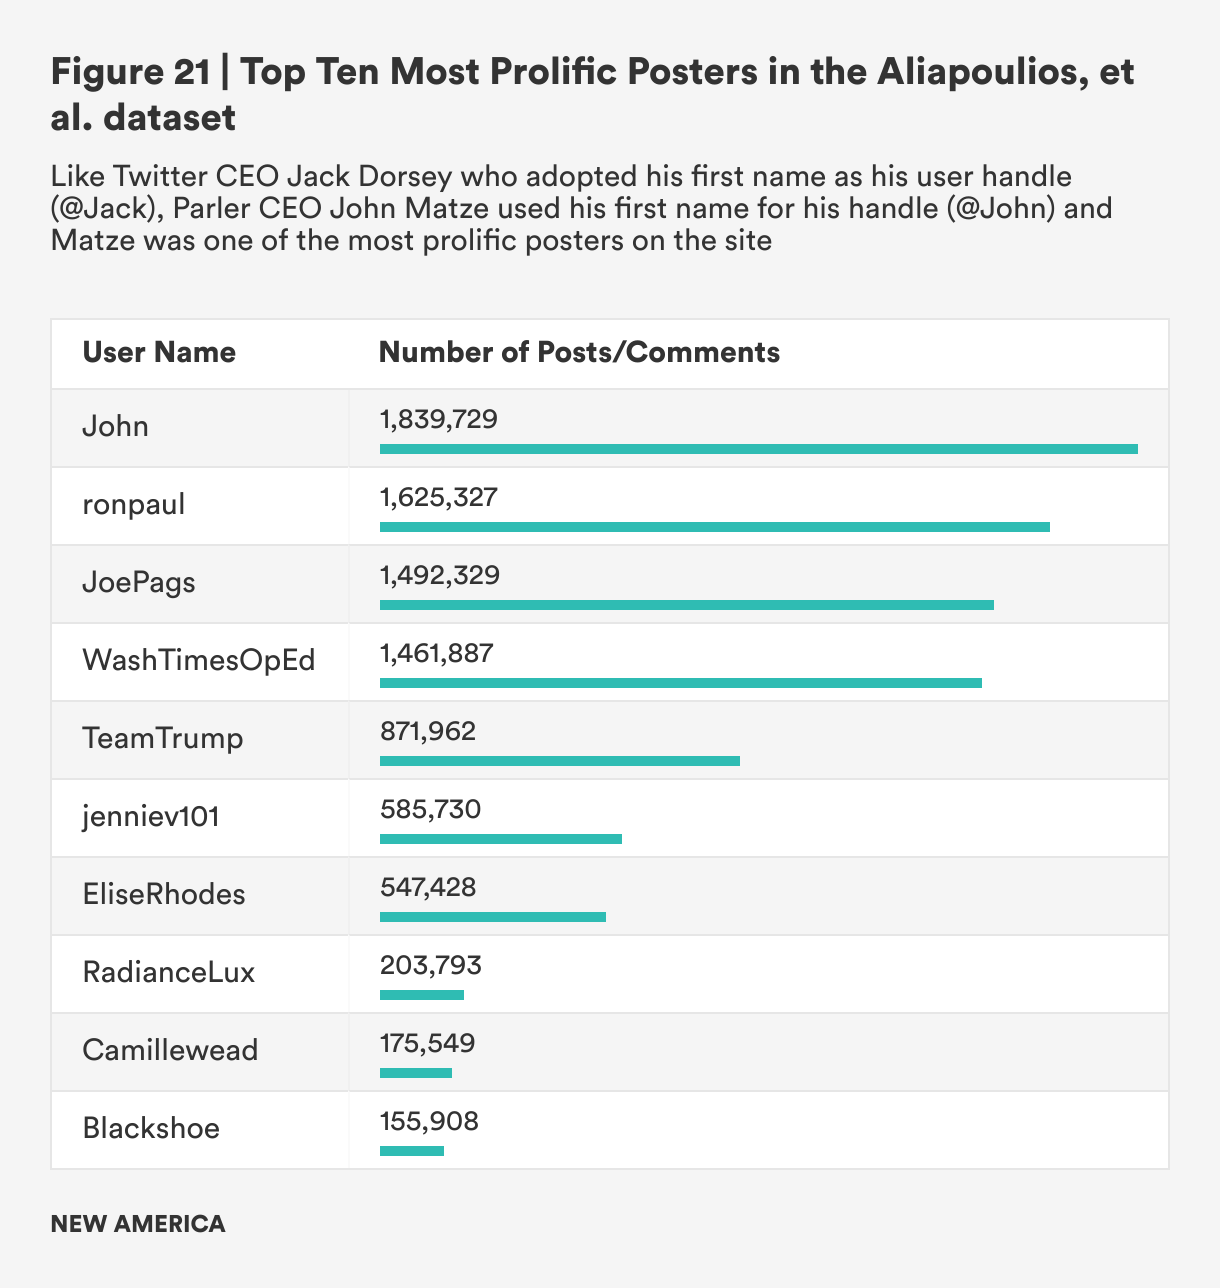
For instance, one feature of Parler 1.0 is that the most prolific commenters were Parler CEO John Matze. Matze’s account showed over 1.8 million comments in which he greeted every first time post from a new user with a welcome to Parler message. Libertarian politician and former Texas lawmaker Ron Paul came in second after Matze with about 1.6 million comments. Conservative media personality Joe Pagliarulo, with almost 1.5 million comments, also welcomed every first time post from a new user with an invitation to connect by phone and by email to pro-Trump organizations.
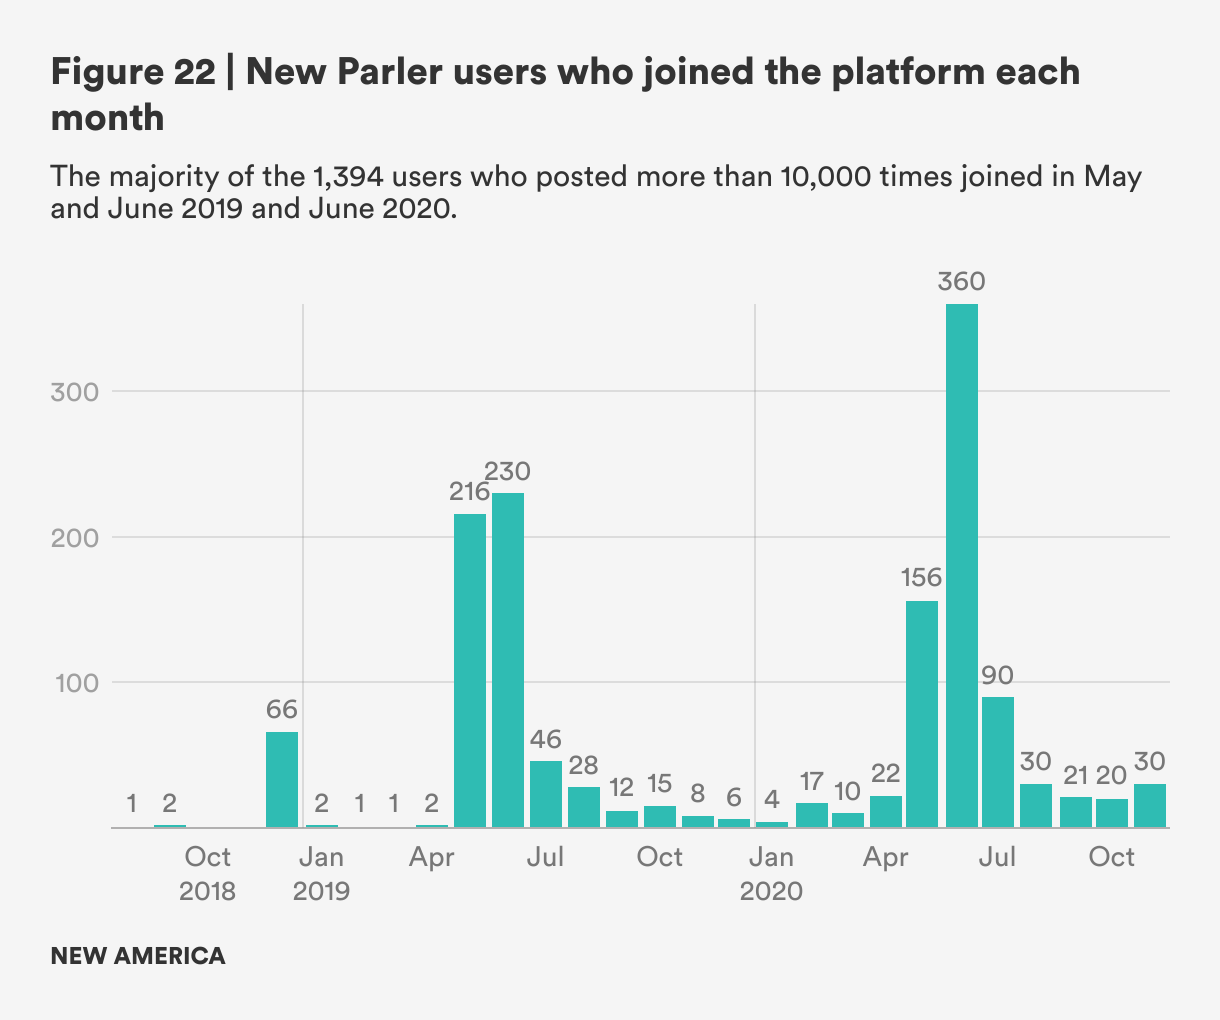
These very high levels of activity are significant. On the one hand, for instance, millions of comments from accounts for Matze, Paul, and Pagliarulo in aggregate indicate a significant amplification of new posts. On the other hand, even so, the levels of amplification discernible in these three accounts comes nowhere close to the scale of amplification detectable on the platform as a whole.6 A closer study of the 1,394 user accounts that posted more than 10,000 times reveals that the majority of those users joined in May and June 2019 and June 2020, months that were significant for the Trump administration and the 2020 presidential campaign cycle.
By way of context, it is important to remember that in May 2019, media outlets had already begun to report widely on the Justice Department’s appointment of a special counsel to lead a probe into the origins of the FBI investigation into Russian interference in the 2016 presidential campaign that prompted the two-year inquiry led by former FBI chief Robert Mueller.7 By June 2019, the Democratic National Committee had also already formally announced the first major candidate debate in the campaign cycle.8 The month of June 2020 also marked key moments in the presidential campaign, including Trump and Biden’s primary wins in Georgia—a toss-up state—and West Virginia, and Trump’s first major public rally in Tulsa, Okla.9
Although a more refined segmentation of the data will be required and is in process, it seems plausible that the bulk of the posting was from accounts established as the Mueller investigation was wrapping up in May 2019 and the scandal over Trump’s dealings with Ukraine was just surfacing in June 2019 and toward the presidential election at the end of the primary season in June 2020. This being the case, given the ubiquitous political outreach and given the pattern of strong posting/commenting activity highly correlated with political events, it is plausible that this cadre of frequent posters and commenters are employed in the pursuit of political influence, either by profession or passion or both. In other words, another feature that may have made Parler 1.0 so unique and distinct from other, more mainstream platforms is that it was uniquely conducive, by design or neglect, to amplify not just false or misleading content but inauthentic behavior.
Analyzing the Video Post Metadata
Much like the timestamp metadata, the Parler videos with timestamps and location specific geotag metadata present both a rich and varied geographic picture and the spatial-temporal picture enriches the purely temporal study discussed above. As has been noted by a number of researchers, platform data that contains both temporal and spatial markers, or volunteered geographic information (VGI), can be useful for crowdsourcing information about all kinds of human activity and the environments where those activities take place.10 But there are challenges with bias in this type of social media data, not the least of which is the high prevalence of use among urban dwellers in dense localities versus less populous rural areas and a lower appetite for social media use among the elderly, for example.11 There is also the problem of limited information about how certain platforms operate and how those features shape user behavior.
All the above caveats aside, the Parler video posts that contain both time and location information still hint at potentially valuable insights into the way tens of thousands of Parler users perceived and reacted to significant events that took place in the United States during the 2020 presidential election cycle. Our preliminary assessment corroborates what has already been made clear by a ProPublica investigation of the 500 videos posted to Parler on January 6 that were culled from 2,500 posted on the day of the attack alone: much of the action recorded and uploaded to Parler captured action from live protests, rallies, and marches in major cities.12
What sets our analysis apart, however, is that rather than just a curated snapshot of that single day, it provides a first-of-a-kind assessment of the nearly 60,000 video posts with real geotags that were posted on Parler from when the platform first launched in the summer of 2018 until it was temporarily taken offline in January 2021. We found that the greatest density of videos with geotags were uploaded in the Washington, D.C. area; with over 1,000 in that area alone, we can say with a high degree of confidence that more than half were likely linked to pro-Trump-related events, including the rally on January 6. Interestingly, St. Louis, Mo. ranked second only to Washington with over 500 videos containing geotags resolving to that area. However, these two large cities, Washington, D.C. and St. Louis, Mo., did not represent the majority of geotagged videos in our dataset, as can be seen from the points of upload plotted on the map of the United States in Figure 23.13
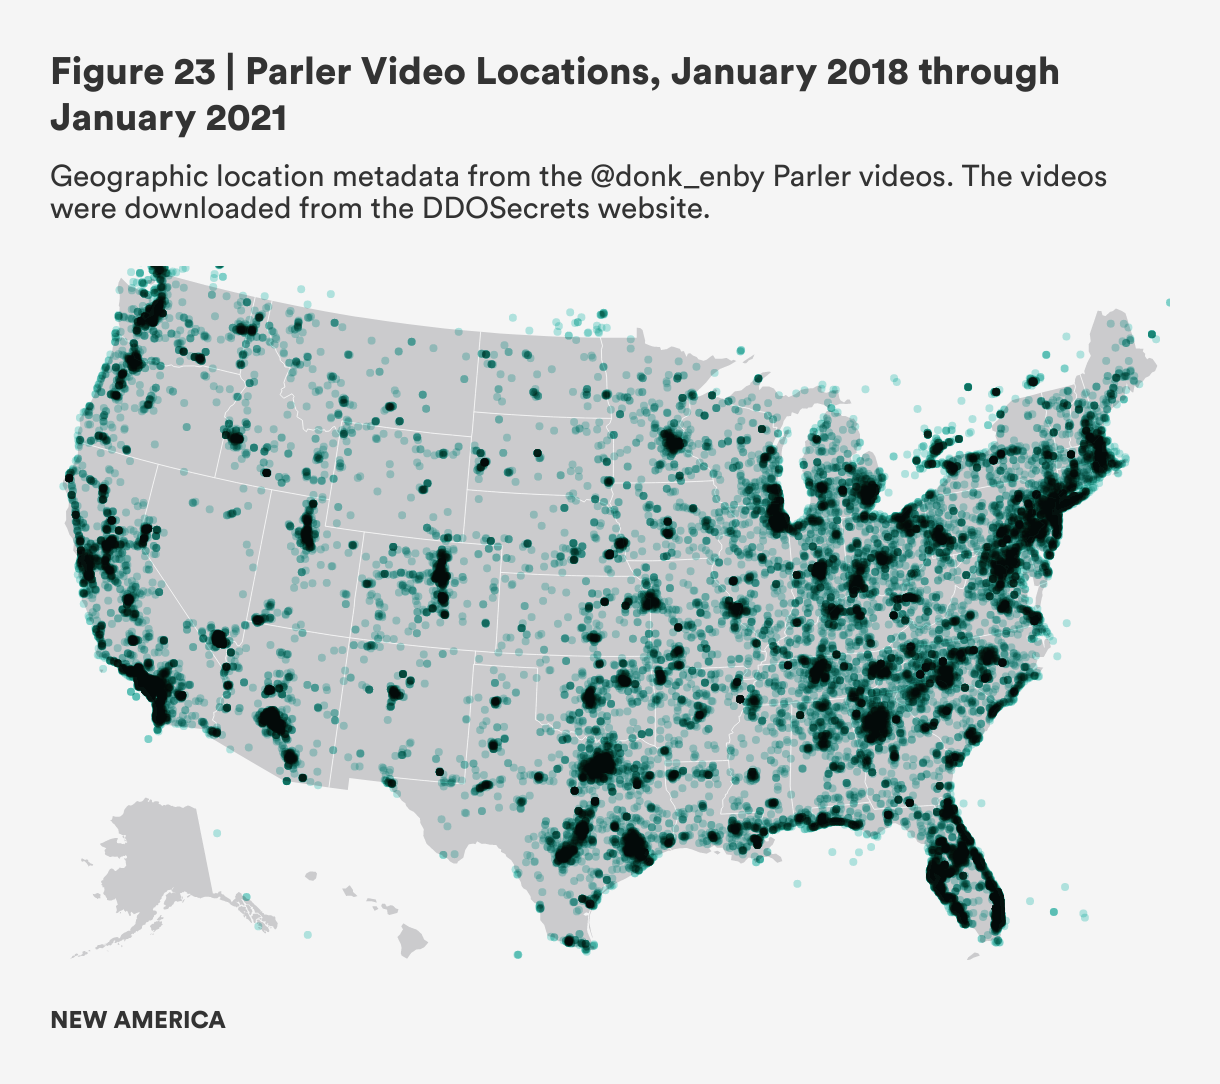
A notable finding from our analysis is that there are many, many distinct geolocations embedded in the video data. There are, in fact, too many to be located in the densely populated urban cores of the United States exclusively and too many also to have been recorded by even a medium-sized team of professional videographers. We note that many of the geotagged videos seem to be clustered around the prosperous suburbs and exurbs of major metropolitan areas. This is an intriguing finding given what we have also learned about the close and significant proximity of arrestees’ residences and areas of the country that had high levels of demonstration activity in 2020—though more research is needed to understand what these patterns and trends truly mean.
It is worth noting that many geotagged video posts are also spread out across rural areas, particularly in the more densely populated and privately owned rural areas east of the Rocky Mountains. In the West, by comparison, where rural land is almost entirely federal land populated by range cattle and farms, the proliferation of geotagged video posts outside of the city cores is visible in small towns along the major interstate highways. We see this, for example, along Highway 15 between Salt Lake City and Las Vegas or along Highways 101 and 5 in Northern California.
We confirmed these visual observations with a statistical analysis.14 The Parler videos are usually created far from a major metropolitan area and usually not in the downtown area of even a minor metropolitan area. This, too, is an interesting finding given that many social media platforms tend to attract engagement from people living close to, or in, urban areas.
Geotagged videos in the dataset we analyzed consist of 2.3 terabytes of mp4 files so forming a conclusive tally of their content is prohibitive. However, we segmented the video post files for further evaluation and identified 3,644 files in the Aliapoulios, et al. dataset where Parler users also included hashtags, which gave us more insight into the context for each video post in this subset.
A large majority are election and QAnon-related, but a significant slice consist of commercial or lifestyle-related content. To the extent that the hashtagged fraction is statistically similar to the rest, we can surmise that a majority of the video posts in this subset are likely Trump campaign or QAnon oriented.
In the context of fringe platforms like Parler, and possibly even mainstream platforms, we suspect that the online astroturfing of political grievances has become so prevalent that the distinction between what is “grassroots” authentic and inauthentic deceptive amplification of content is no longer meaningful. With these considerations in mind, a more finely honed point may be made by comparing the geolocation of Parler videos grouped by month of creation. The following set of images contains all of the same geolocations present in the above map, separated into distinct frames by the month of the video creation timestamps.
Figure 24
Few videos were posted before Spring 2020 and, until that time, they are sparsely distributed and vary in location from one month to the next. With the onset of the 2020 campaign and the creation of so many more videos, however, there are notable geographic clusters of videos that consistently appear on the map. Also notable is the explosion of geographic coverage of the created videos in November 2020.15
From the early days of Parler 1.0 beginning in August 2018, there are a sprinkling, less than one hundred per month, of geotagged videos that slowly increase in number and vary in location from month to month, until the launch of the primary campaign in May 2019. The post rate continued to trend along an upward trajectory until Trump's first major public campaign rally in Tulsa, Okla. in June 2020, which is when the number of geotagged video posts increased dramatically.
That is also when there also seemed to be a trend toward more diversity in the number of different locations where geotagged video posts were uploaded to Parler. Here, we noticed that was especially true during the post-election period from early November 2020 to early January 2021 when the number of contentious demonstrations increased, as noted in our analysis of ACLED protest event data. We conjecture that there were hundreds or thousands more that flew under the radar by virtue of being too small or too far away to be noticed. Much more research is needed, however, to better understand how and where all the puzzle pieces embedded in all the metadata fit together and it’s not a given the picture that emerges will be very clear.
Citations
- Larry Buchanan, Quoctrung Bui and Jugal K. Patel, “Black Lives Matter May Be the Largest Movement in U.S. History,” New York Times, July 3, 2020. source
- Max Cohen, “Trump to Resume Campaign Rallies with June 19 Event in Tulsa,” Politico, June 10, 2020. source
- Annie Karni, “Trump Uses Mount Rushmore Speech to Deliver Divisive Culture War Message,” New York Times, July 3, 2020. source
- Nicholas Bogel-Burroughs, “Portland Clashes Converge on Courthouse Named for an Antiwar Republican,” New York Times, July 22, 2020. source
- Jonathan Landay, “Spurred on by False Claims of Fraud, Trump Supporters Rally in Washington,” Reuters, November 14, 2020. source; Tina Nguyen, “MAGA Nation Tries to Rally Around Trump with MAGApalooza,” Politico, November 11, 2020. source
- We found that the median number of posts/comments among accounts that post is 2, the mean is 43.5 and the standard deviation is 885: these indicate that Parler posts follow a standard social media pattern. In addition, a statistical study of the 'CreatedAt' timestamps reveals that, although the majority of accounts have very few posts, there is a long tail of a few users who have very many posts.
- Michael Balsalmo, “AP Source: Barr Launches New Look at Origins of Russia Probe,” Associated Press, May 14, 2019. source
- Adam Edelman, “DNC Names 20 Candidates Who Will Appear on Stage for First Democratic Debate,” NBC News, June 13, 2019. source
- Peter Baker and Maggie Haberman, “Trump Moves Tulsa Rally Date ‘Out of Respect’ for Juneteenth,” The New York Times, June 13, 2020. source
- Bianca E. Lopez, Nicholas R. Magliocca, and Andrew T. Crooks, “Challenges and Opportunities of Social Media Data for Socio-Environmental Systems Research,” Land 8, No. 7: 107, 2019, pp.1-3.source
- Lopez, et al. op.cit., 2019.
- Lena V. Groeger, Jeff Kao, Al Shaw, Moiz Syed and Maya Eliahou, “What Parler Saw During the Attack on the Capitol,” ProPublica, January 17, 2019. source
- This figure has both the strengths and weaknesses of scatterplots: unlike density plots it cannot display multiple points at the same location but it can display a diversity of unrepeated distinct geolocations with the same strength as a hypothetical location at which videos were created day after day. A density plot would be a useful complement, but would confirm what is already known: there were many protests, rallies, and marches in major cities during the 2020 election cycle; people recorded these events on their phones and uploaded videos to a variety of social media platforms, including Parler.
- Our statistical analysis found that the 59,791 video geocoordinates, the median distance from a video geolocation to the nearest city of population in excess of one million people is 132.7 miles, the median distance from a video geolocation to the nearest city of population in excess of 500 thousand is 29.9 miles, the median distance from a video geolocation to the nearest city of population in excess of 200 thousand is 11.9 miles and the median distance from a video geolocation to the nearest city of population in excess of 100 thousand is 6.3 miles.
- In the PDF version of this report, we have replaced the animated gif with a static image of the final four months in the series. Shapefiles for the map are from the U.S. Census. For the animated version, see here: xxxxxxxx.