
New America Education Database Includes Updated Special Education Expenditures Per District

The Federal Education Budget Project (FEBP), Ed Money Watch’s parent initiative, maintains the most comprehensive education database available on funding, demographics, and outcomes for every state, school district, and institution of higher education in the country. This week, we’re announcing an update to the database: FEBP’s federal special education funding at the school district level is now up to-date for years 2010 and 2011.
Special education funding comprises the second-largest federal K-12 program, behind Title I grants to economically disadvantaged students. In fiscal year 2012, Congress allocated $11.6 billion to special education grants to states under the Individuals with Disabilities Education Act (IDEA), Part B. The funding is divided across the states according to a complicated formula that factors in fiscal year 1999 levels of funding, the share of children ages 3 through 21, and the share of those children living in poverty. (To learn about some of the complicating factors of IDEA, check out our background page on the subject.)
States then divide the money across school districts through a number of different formulas. That’s why FEBP collects its district-level IDEA data directly from the states. The data are displayed at edbudgetproject.org, where you can plug in your own district and compare it to others of similar funding levels and locale types, within or across states, alongside other related data points like student poverty rates and per-student spending levels.
For example, we looked at one large urban district – Clark County School District in Nevada, which encompasses Las Vegas. Funding for the district increased slightly for IDEA Part B each year from 2009 through 2011 – up from $37.3 million in 2009 to $39.5 million two years later.
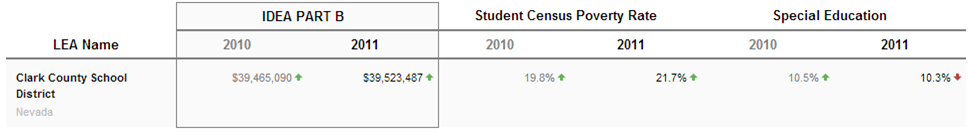
Meanwhile, though, special education enrollment held relatively steady – fluctuating by a tenth of a percentage point over the same period from a low of 10.3 percent to its peak of 10.5 percent. And student poverty rose quickly from 15.6 percent to 21.7 percent. Although it’s hard to make comparisons across state lines without significant caveats, the data still provide valuable micro-level analyses.
The latest update also includes IDEA Sec. 619 preschool grantsfor 2010 and 2011, as well as the number of children served by those early intervention programs, for those states which are able to provide the data at a school district level.
Head to edbudgetproject.org to look up your school district, compare it to other districts, and perform your own analysis. The full data file is also available for download here. And for more background on special education grants and other federal education programs, check out FEBP’s background and analysis pages here.
Issues
Related

A New Path to Nursing for High School Students in New Orleans

Work Shift and New America Launch Reporting Fellowship