Networks and American Renewal
Abstract
A map and findings from research on 25 networks of local practitioners working in over 270 communities to advance solutions to criminal justice challenges, climate change, open government, and economic opportunity.
Acknowledgments
We would like to acknowledge the contributions of Afua Bruce, Daniel Lurie, Emma Coleman, and Cecilia Muñoz for their time and effort reviewing and editing this work, as well as Gordon LaForge, for his network and technical insights. We also greatly appreciate our colleagues Maria Elkin, Loren Riesenfeld, and Alison Yost, who provided data visualization and communications support, Megan Garcia for her communications expertise, Jeremiah Lindemann and Romona Galzar at Esri who built the pilot for the interactive map, and Andrew Patterson, Christina Phang, and the team at Blue Raster, who spearheaded the final data cleaning and map-making. We are grateful to Bloomberg Philanthropies Government Innovation team, for sharing their research on the proliferation of networks.
We would also like to thank all of the network leaders and city-based practitioners we interviewed over the course of this project – their learnings have been invaluable. For both their initial insights and for feedback on drafts, we are grateful to Joel Carnes, Leah Hendey, Kathy Pettit, Jake Maguire, Katherine Hillenbrand, Victoria Inéz Salinas, Kristina Ishmael, Kyle Wagenschutz, Jessica Venegas, Beth Sandor, Ben Levine, Marc Schlossberg, Owen Stone, Christopher Whitaker, Tess Posner, Paul Nelson, Brendan Shane, Kathy Rowings, Maeghan Gilmore, Kelly Jin, Tracy Phillips, Mauricio Garcia, David Margalit, Nicole Neditch, Stephanie Wade, Debra Socia, Laura Faulkner; Iliana Estevez, Nils Moe, Zach Markovits, and Jim Burch. We thank Luke Tate for his review and comments, and Tom Schenk, for sharing a city-specific perspective.
Downloads
Can Networks Supercharge American Ingenuity?
Findings from research on 25 networks of local practitioners working in over 270 communities to advance solutions to criminal justice challenges, climate change, open government, and economic opportunity
By Tara McGuinness, Denice Ross, Anne-Marie Slaughter
"It’s not that the network itself is smart; it’s that the individuals get smarter because they’re connected to the network."
— Steven Johnson (Where Good Ideas Come from: The Natural History of Innovation)
There is a growing cadre of local practitioner networks in places like Rancho Cucamonga, Chattanooga, South Bend, Albuquerque, Anchorage, and Lincoln, getting smarter by learning from the successes and failures of other communities.
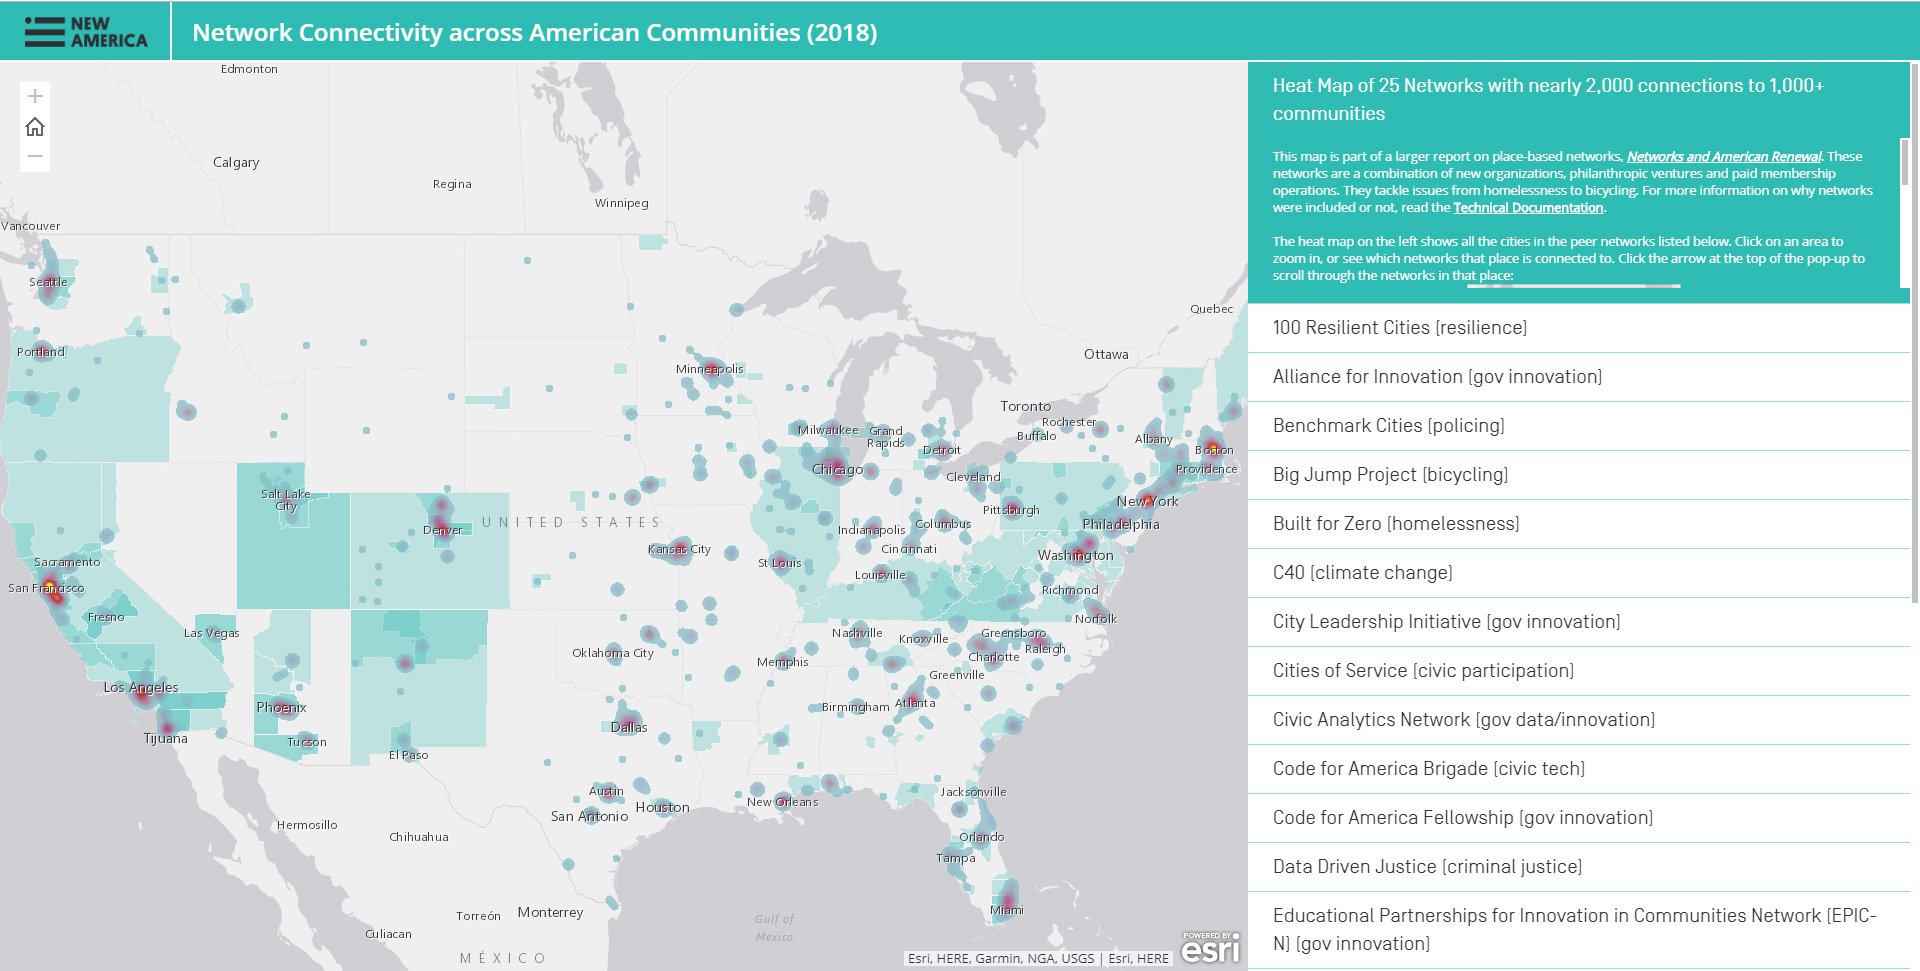
We collected data about 25 such networks in over 270 U.S. metro- and micropolitan areas working to advance solutions in criminal justice, climate change, open government, and economic opportunity.1 We used a uniform questionnaire and conducted more than two dozen interviews to build an interactive map of these networks (as of September 2018) and the resources they make available for their members.
Visit the map to see geographic patterns of network participation and zoom in to learn what networks different places are connected to.
As communities are dealing with complex crises such as climate change, rising housing costs, and the opioid epidemic, they are increasingly tapping into networks to help them learn new ways to engage these emerging challenges with smarter interventions. They are looking to learn from other communities who have faced similar obstacles and succeeded. “A network is a way to organize collective action and impact,” according to experts Plastrik, Taylor, and Cleveland.2 Networks are becoming a model that is changing the way businesses operate, philanthropists scale, and communities gather the wisdom of other places. Anne-Marie Slaughter’s research on networks as foreign policy tools for solving global problems also highlights scores of networks linking governments, corporate, civic, and philanthropic actors. When researchers commissioned by Bloomberg Philanthropies studied more than 80 active networks of international city governments, they observed a surge of city network initiatives founded in the early 1990s.
Error: Data visualization bundle URL missing.
Two thirds of the two-dozen networks interviewed for this research were founded in the last six years. Many are the result of a recent proliferation of philanthropic investment in networks helping cities and counties, and a focus in the Obama administration on place-based initiatives. These networks range in tools and intensity from Bloomberg Philanthropies What Works Cities, which provides technical assistance using data and evidence to improve city services to a network of 100 cities, to #GoOpen, a network of school districts using open source curricula that started in federal government and supports self-replication.
| Networks Interviewed for Our Research | |
|---|---|
| #GoOpen | Educational Partnerships for Innovation in Communities Network (EPIC-N) |
| 100 Resilient Cities (100RC) | FUSE Corps |
| Alliance for Innovation | Innovation Teams (i-teams) |
| Benchmark Cities | Living Cities |
| Big Jump Project | MetroLab Network |
| Built for Zero | National Neighborhood Indicators Partnership (NNIP) |
| C40 | Next Century Cities |
| Cities of Service | Police Data Initiative (PDI) |
| City Leadership Initiative | StriveTogether |
| Civic Analytics Network | TechHire |
| Code for America Brigade | Urban Sustainability Directors Network (USDN) |
| Code for America Fellowship | What Works Cities (WWC) |
| Data-Driven Justice |
Networks are by no means a panacea for solving intractable problems. We heard many stories of places unable to take advantage of the benefits of network participation due to a lack of local bandwidth and resources, and also the lack of alignment with local organizational priorities. We also heard of “network fatigue” where places were so active on the national stage that their ability to focus and deliver at the local level was diminished.
That said, we also heard that when the challenge is bigger than any one place can solve alone, access to the right resources, tools, and colleagues through a network can be transformative for local practitioners. For example, in less than two years, “three communities in the Built for Zero network have ended chronic homelessness, eight have ended homelessness for veterans, and another 37 communities have driven a reduction in homelessness” using better data and aligning efforts across community stakeholders, confirmed Jake Maguire, Principal at Community Solutions. When the Police Data Initiative was founded in 2015, police departments had never released open data about things like use of force or citizen complaints. Now, the network has more than 140 agencies who collectively have released more than 350 datasets, effectively shifting the culture of policing toward more transparency.
The smallest network in our database is the three-year-old Big Jump Project, which uses data to increase bicycling infrastructure and ridership in 10 jurisdictions. The largest network, Cities of Service, is 240 cities strong with city leaders engaging citizens to collaboratively identify and solve public problems. Nearly two thirds of the networks in our research are working in 75 or fewer places. Some of these networks have an intensive backbone of organizational support behind them, while others provide human capital support through personal or technical assistance, or through grant making that complements the network’s goals. Some networks are offered through paid membership, others by application. Nearly all provide annual summits and tools to connect with other members of the cohort. Some even sponsor travel for cohorts to visit sites where they can see emerging solutions first-hand.
Our research revealed trends across places and networks, and lessons for those building and improving networks and those working at the community level.
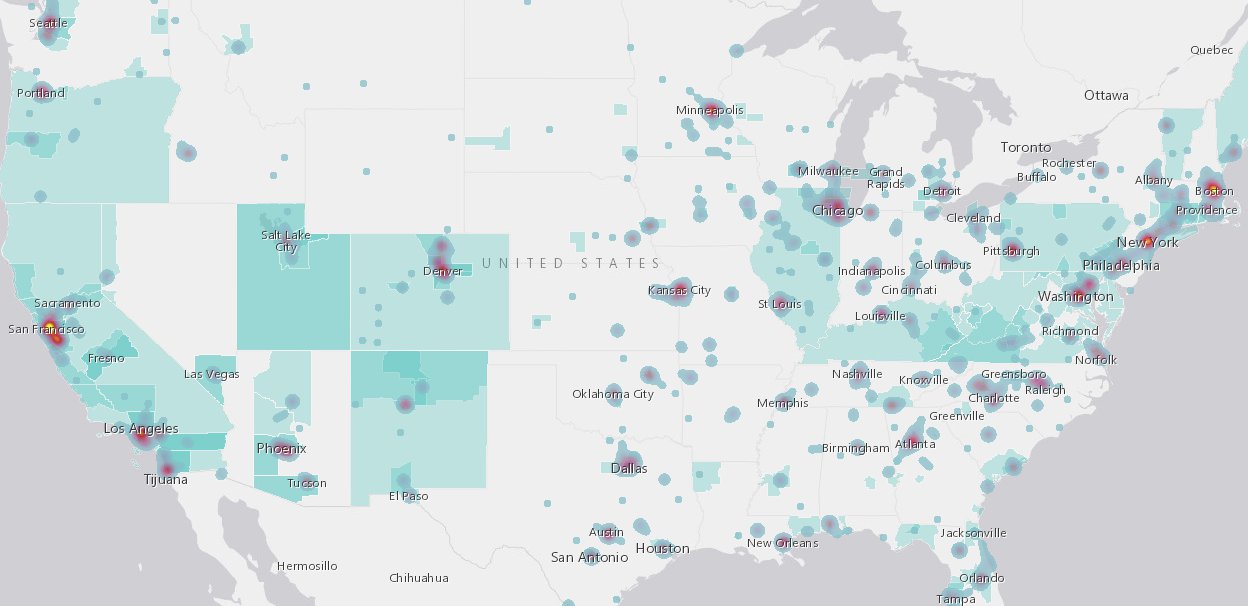
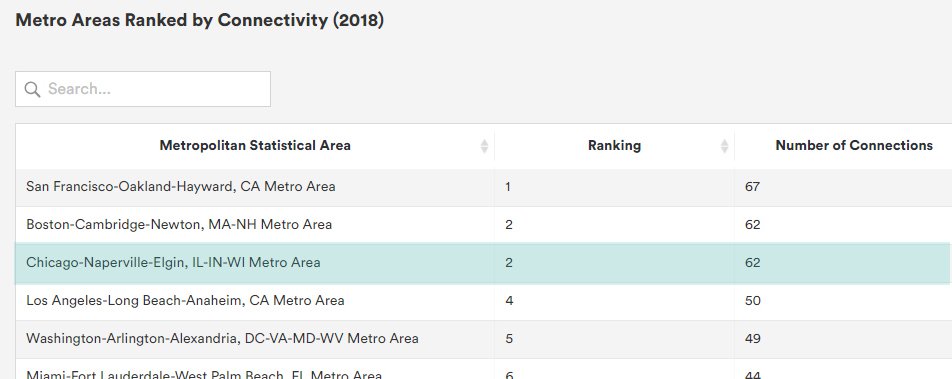
Communities are either hyper-networked or off-the-grid. The geography of membership is not evenly distributed. While every region of the country has networks in our survey, there are some places that are more connected than others. Of the 25 networks we studied with nearly 2,000 connections to 270 metro- and micropolitan areas, the top 10 super-networked areas account for fully a quarter of all the connections. And the United States has another nearly 700 metro- and micropolitan areas that are un-connected to the 25 networks in our study. The table below shows each of the 270 metro- and micropolitan areas that are connected to the 25 networks in our research, ranked by its number of connections to the networks.
Error: Data visualization bundle URL missing.
The more populous a place, the more likely it is to be highly networked. This is likely due to the higher capacity and greater resources found in population centers like San Francisco, Chicago, New York, and Boston. The graph below shows the top ten most networked metro areas and their high populations. It also shows the clustering of lightly-networked, low population metro/micropolitan areas.
Error: Data visualization bundle URL missing.
It takes capacity to get into and take advantage of these networks. The capacity required to participate in nearly all networks is significant. The National Neighborhood Indicators Partnership (NNIP), run out of the Urban Institute, demonstrates the barriers for low capacity communities. Its “Guide to Starting a Local Data Intermediary” demonstrates the level of capacity and vision a community needs before joining a capacity building network:
“Prospective organizations submit an application that includes references, a data inventory, and a letter of intent pledging to develop further local collaboration around data dissemination and applications in their area in the future.”
We spoke with people in several places who aspired to be a part of NNIP and could imagine the concrete ways their communities would benefit from that type of civic infrastructure, but lacked the resources and capacity needed to derive those benefits. Most network organizations are seeking to work in geographies with a vision and ability to “succeed,” so if there is a selection process, they are seeking local leadership, ability to use best practices, and capacity to deliver. Some places don’t have these resources to allocate to participation in a network.
In their 2018 report, Cities Joining Ranks—Policy Networks on the Rise, Lusk and Gunkel also identified this phenomenon, labeling two types of network membership models "High-Hurdle" (selective membership) and "Big Tent" (drawing larger numbers of cities with diverse capacities).
Conclusion
Connectedness is the flavor of the day. Many studies of individual, organizational, and municipal health conclude that isolation is bad and participation is good. Networks are the preferred institutional form for a more horizontal world, in which the hierarchy of traditional firms and organizations seems stiff, old-fashioned, and limiting. Connecting places through partnerships, coalitions, alliances, and networks holds out the promise of large scale success, maximizing impact through cross-fertilization and replication without the difficulties and conflicts of merging into one large organization.
Some of this promise holds true. But simply creating or joining a network is at best a first step and at worst a step backward, if capacity to actually participate in and learn from the network is lacking. Indeed, our research shows that many of the cities that most need what networks can offer are the least well placed to participate in them. Network designers and builders take heed: more attention to the specific factors that actually make networks work can make more networks work for more places.
Citations
- To learn more about what networks we included and didn’t in this research, see the Methodology page.
- For more information on the philanthropic roles in building networks, see Kresge Foundation’s 2015 guide to Investing Strategically In Social-Impact Networks and Connecting to Change the World by Peter Plastrik, Madeleine Taylor, and John Cleveland.
Map: Network Connectivity across American Communities (2018)
Over the past year, we examined the geographic spread of a sample of networks at work in communities. We mapped 25 networks that are helping cities and counties solve a wide-range of social challenges and collected data about networks working in over 270 U.S. metro- and micropolitan areas to advance solutions in criminal justice, climate change, open government, and economic opportunity. Use this map to:
- Zoom into a specific community to see what networks it is connected to.
- View the patterns in the heat map of which places are super-networked, and which places are not.
- Browse the 25 networks individually to see which communities are members, and learn more about what each network does, how to join, and what resources each network makes available.
The Hyper-Networked and the Rest
New research shows that efforts to create innovation and empower communities through networks may leave some communities behind
By Tara McGuinness
Citizens organized through networks or groups have always been part of how progress is made in the US. While data show an upward trend in the use of networks for social change, networks have influenced the development of the United States for hundreds of years. In 1835, the power of American networks and associations caught Alexis de Tocqueville’s eye:
“In America I encountered sorts of associations . . . and I often admired the infinite art with which the inhabitants of the United States managed to fix a common goal to the efforts of many men and to get them to advance to it freely.”
In Democracy in America he observed the power of organized citizens in networks to make progress outside the constructs of a powerful authority, institution, or mandate.
This work is alive and well today.
Citizens are driving progress in places as varied as Spartanville, S.C. and Lancaster, Pa. Citizen-led innovation taking place from Ajo, N.M. to Eastport, Maine fills the pages of Jim and Deb Fallows’ book, Our Towns, and was at the center of an expanse of efforts under the Obama administration aimed at empowering local leaders (the Promise Zones, Choice Neighborhoods, and My Brother’s Keeper initiatives, to name a few).
But the socio-economic map of the United States has transformed in the nearly 200 years since de Tocqueville’s visit, particularly in the last three or four decades. For the first time in history, Americans are less likely to be better off than their parents. While the traditional pattern has been growth in economic integration across the country with a more even distribution of those with college degrees, since the 1970s there has been a shift: communities are becoming more and more homogenous, and wealthy and well-educated Americans are living in certain geographic pockets.
Networks like the ones de Tocqueville observed, and their modern incarnations, offer an opportunity to aid problem-solving and innovation to address common goals. Unchecked, however, they can also exacerbate growing U.S. trends of economic and social capital inequity.
Networks: The Hyper-Connected and Everyone Else
We mapped and collected data about 25 networks that are helping cities and counties solve a wide-range of social challenges. These networks are working in over 270 U.S. metro- and micropolitan areas to advance solutions in criminal justice, climate change, open government, and economic opportunity. The networks include efforts like the What Works Cities program, developed to improve public sector innovation and use of data, and others like Code for America’s brigades, which run civic tech efforts in a breadth of communities, and StriveTogether, a network helping to improve educational outcomes for all kids. This data has lessons for people building networks. It also revealed patterns about the kinds of communities that ask for and receive support in addressing local challenges.
While the networks in our research reflect communities of different sizes engaged in fixing a range of challenges in innovative ways, a closer look at the data reveals trends in connectivity (or lack thereof) across places. While some communities are hyper-connected, others are off the map entirely—and those are often the places that are struggling the most with typical challenges.
Big cities have an outsized presence in the network connections that we studied. Of the more than 270 metro- and micropolitan areas connected by the 25 networks we studied, the top 10 most connected metro areas account for fully one quarter of the nearly 2,000 total connections. The most connected places—San Francisco, Boston, Chicago, Los Angeles, Washington D.C., New York City, Miami, Seattle, Minneapolis-St. Paul, and Phoenix—are cities that typically fit the narrative of economically competitive, growing, high capacity places. Meanwhile, 97 metro- and micropolitan areas, including places like Zanesville, Ohio, Tuscaloosa, Ala., and Waco, Texas, only account for one connection each, while another nearly 700 metro- and micropolitan areas have no connections to the networks in our research. In the sample of networks we studied, there was a clear correlation between a metro area’s population and its participation in networks.
Error: Data visualization bundle URL missing.
In interviewing network managers and organizations using networks as a tool in public problem-solving, two very clear trend lines emerged. First, as discussed above, some places (mostly cities) were very connected and engaged in national networks (from ending homelessness, to using data for public sector innovation, curbing climate change, and dozens of other issues simultaneously). These cities, including Boston, San Francisco, and Philadelphia, are using new tools and approaches to solve problems and are connected to organizations building capacity and sharing knowledge. Chicago is one of these extremely connected cities and is linked to national resources to tackle local challenges as varied as curbing police officer involved shootings and increasing bike lanes.
The second trend we heard from leaders running networks was that communities that were in need of capacity didn’t always make the cut for membership in these innovation networks. Sometimes the communities themselves didn’t apply or raise their hands to engage. In other instances, the barriers involved in joining a network and the capacity it took to participate were more than some communities had to give. Communities with little municipal capacity or in the midst of crises were unable to take on the task of filling out an application or drafting a plan, which are the requirements of many, though not all, of the networks.
One network leader said it is a real strategic question: “Should we work with smaller cities that need our help more, or work with larger places and hope the case studies trickle down?” They, like the majority of networks we interviewed, chose the latter strategy: partner with places that want to lead and build a model that can be shared. Multiple organizations running these networks articulated their interest in working in lower capacity geographies, but cited multiple barriers to engagement. One network leader said they had interest in working in an economically struggling city and pursued ways to engage but backed off after finding the city “didn’t have the capacity to engage with the outside world.”
Networks—and usually their philanthropic backers—engage and select communities that they believe will succeed in making progress on their issue. Those we interviewed cited a need to show progress, and found capacity-rich cities to be better bets to demonstrate outcomes. However, that choice produces unintended consequences across the map: the places with higher capacity gain more capacity, while the places with lower capacity continue to struggle.
A National Map: Uneven Economic Mobility and Connectivity
Our data on city networks sits on top of a larger landscape of uneven economic growth and disconnectedness across American communities. New data from several sources provide a more granular picture of the geography of declining absolute mobility, and the power of geography in determining economic mobility and social capital.
The same fast-growing connected metros like San Francisco, New York, and Chicago that are at the center of network connectivity (as of September 2018) on our map also account for 72 percent of the nation’s employment growth, according to research from the Brookings Institution.
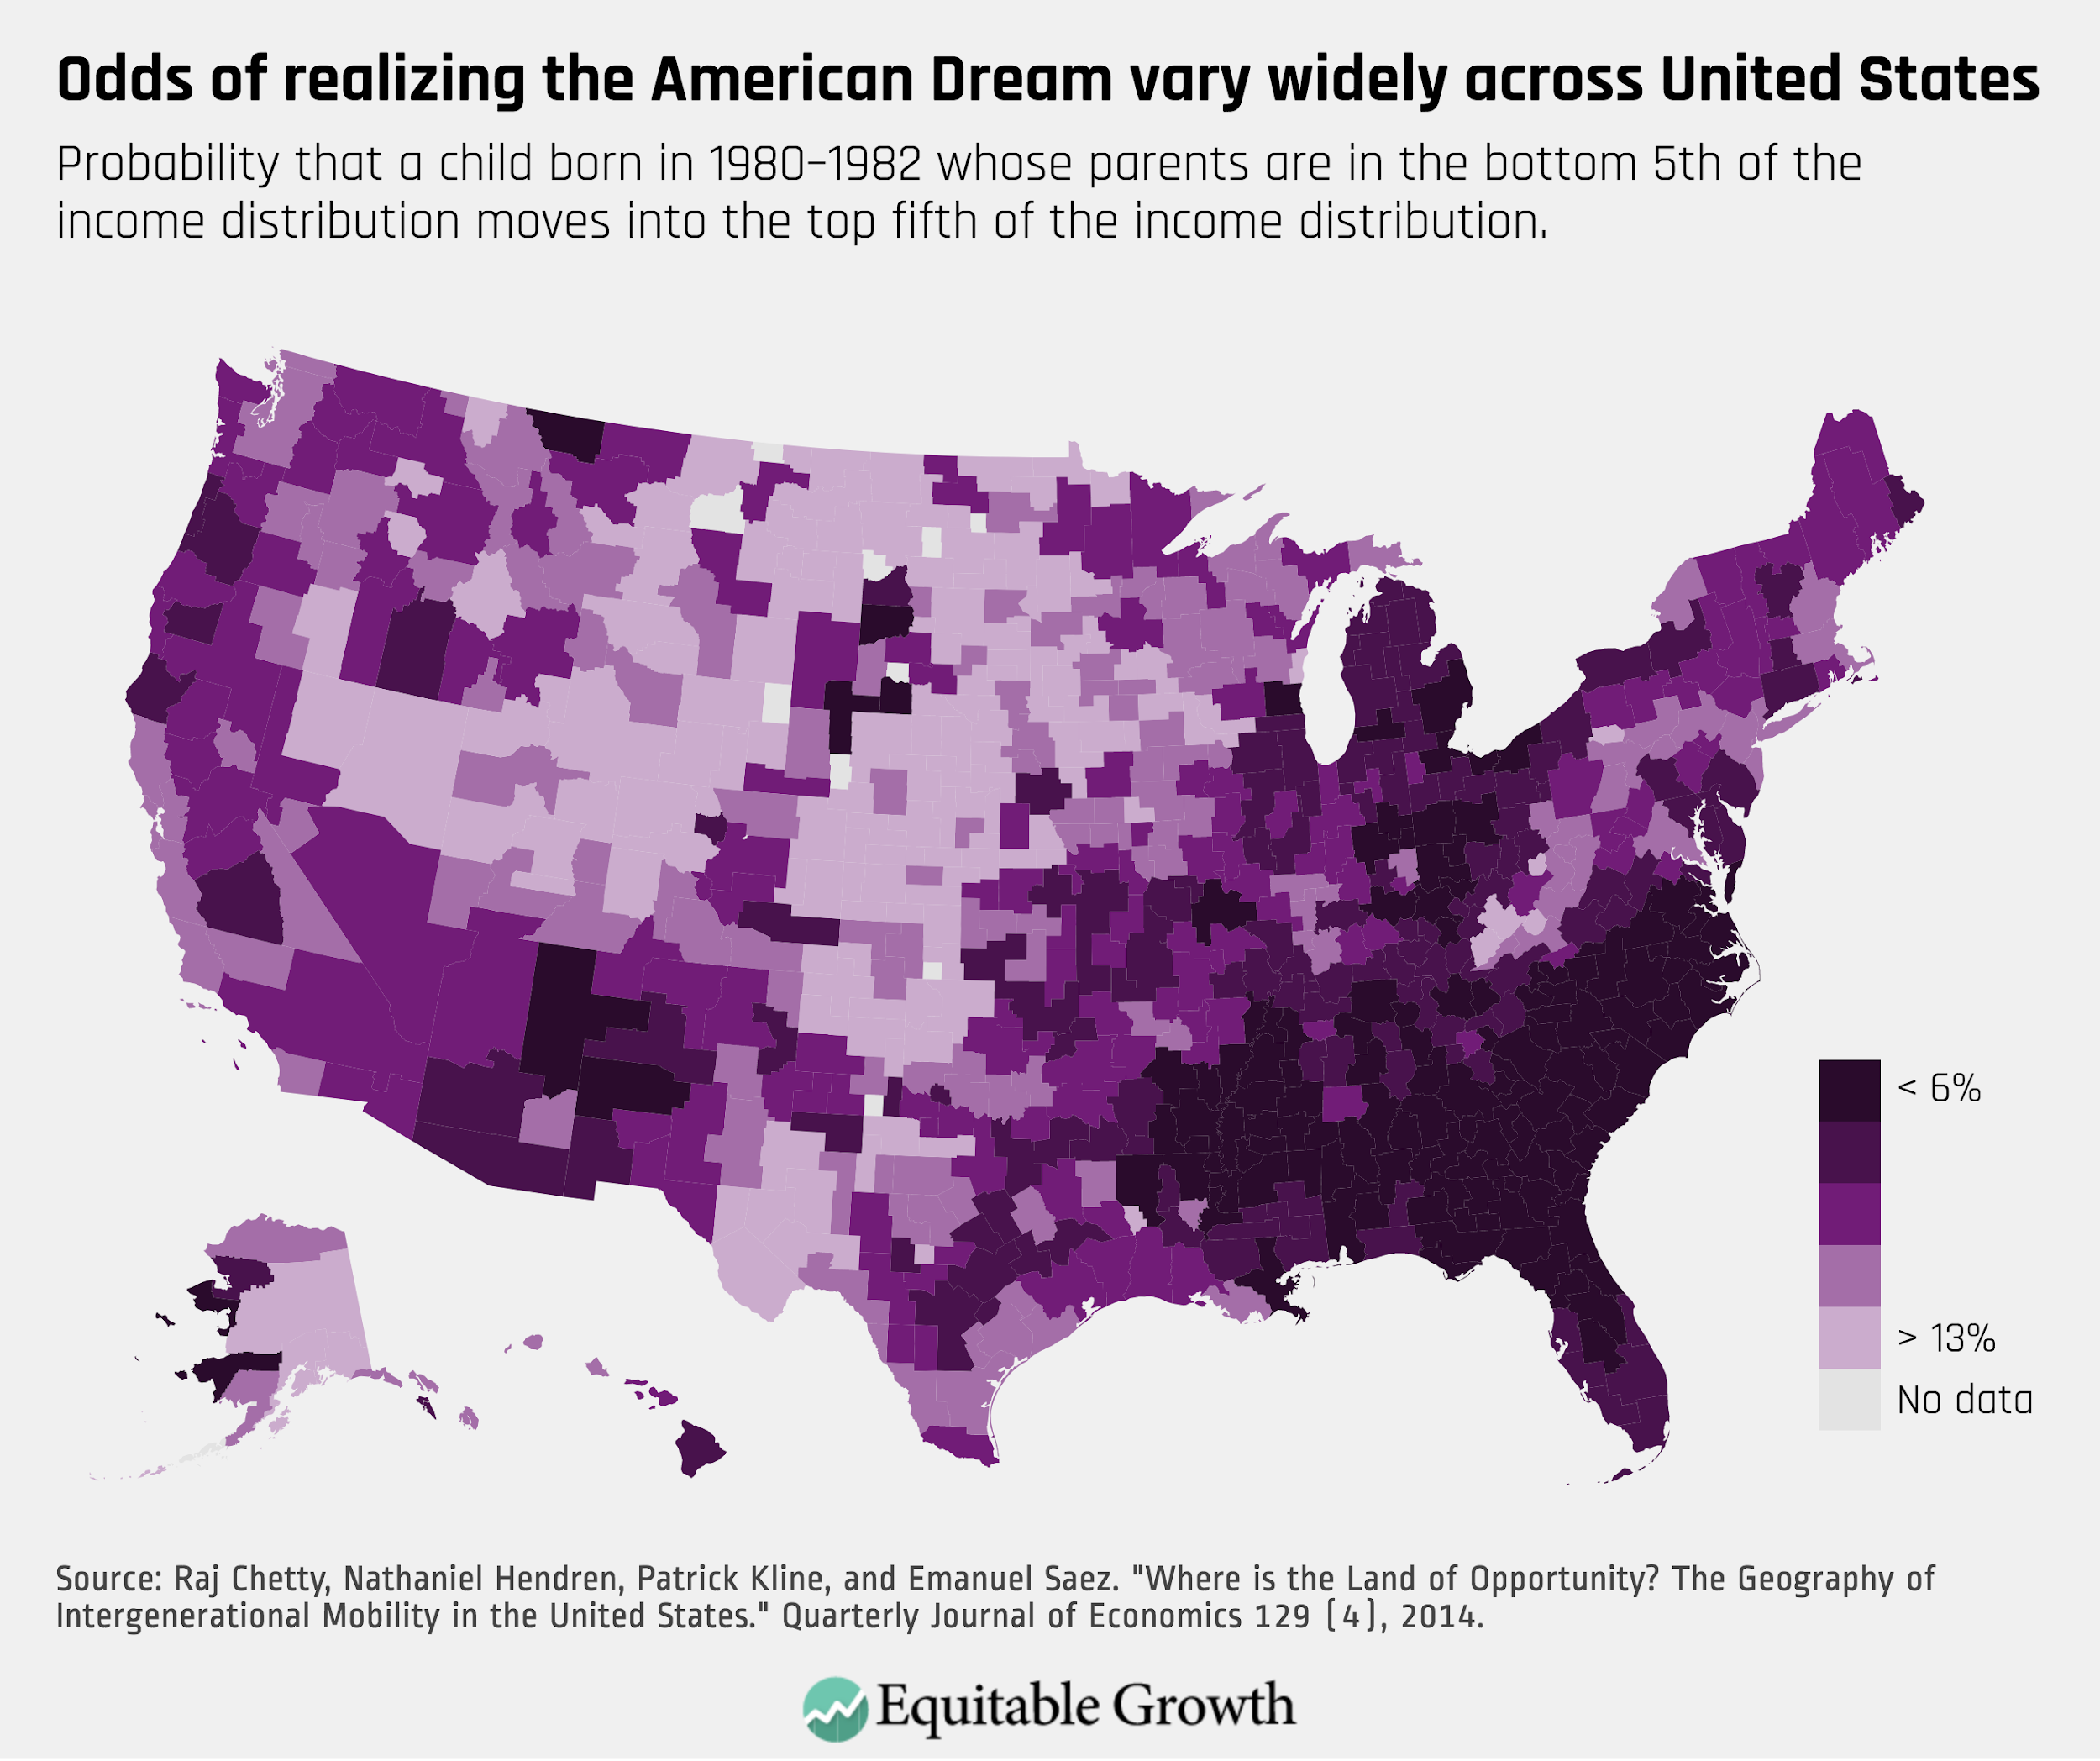
Raj Chetty, Nathaniel Hendren, Patrick Kline, and Emmanuel Saez also found dramatic variance in social mobility across different US geographies. Their data reveal that where you live weighs heavily on your chances of economic mobility.
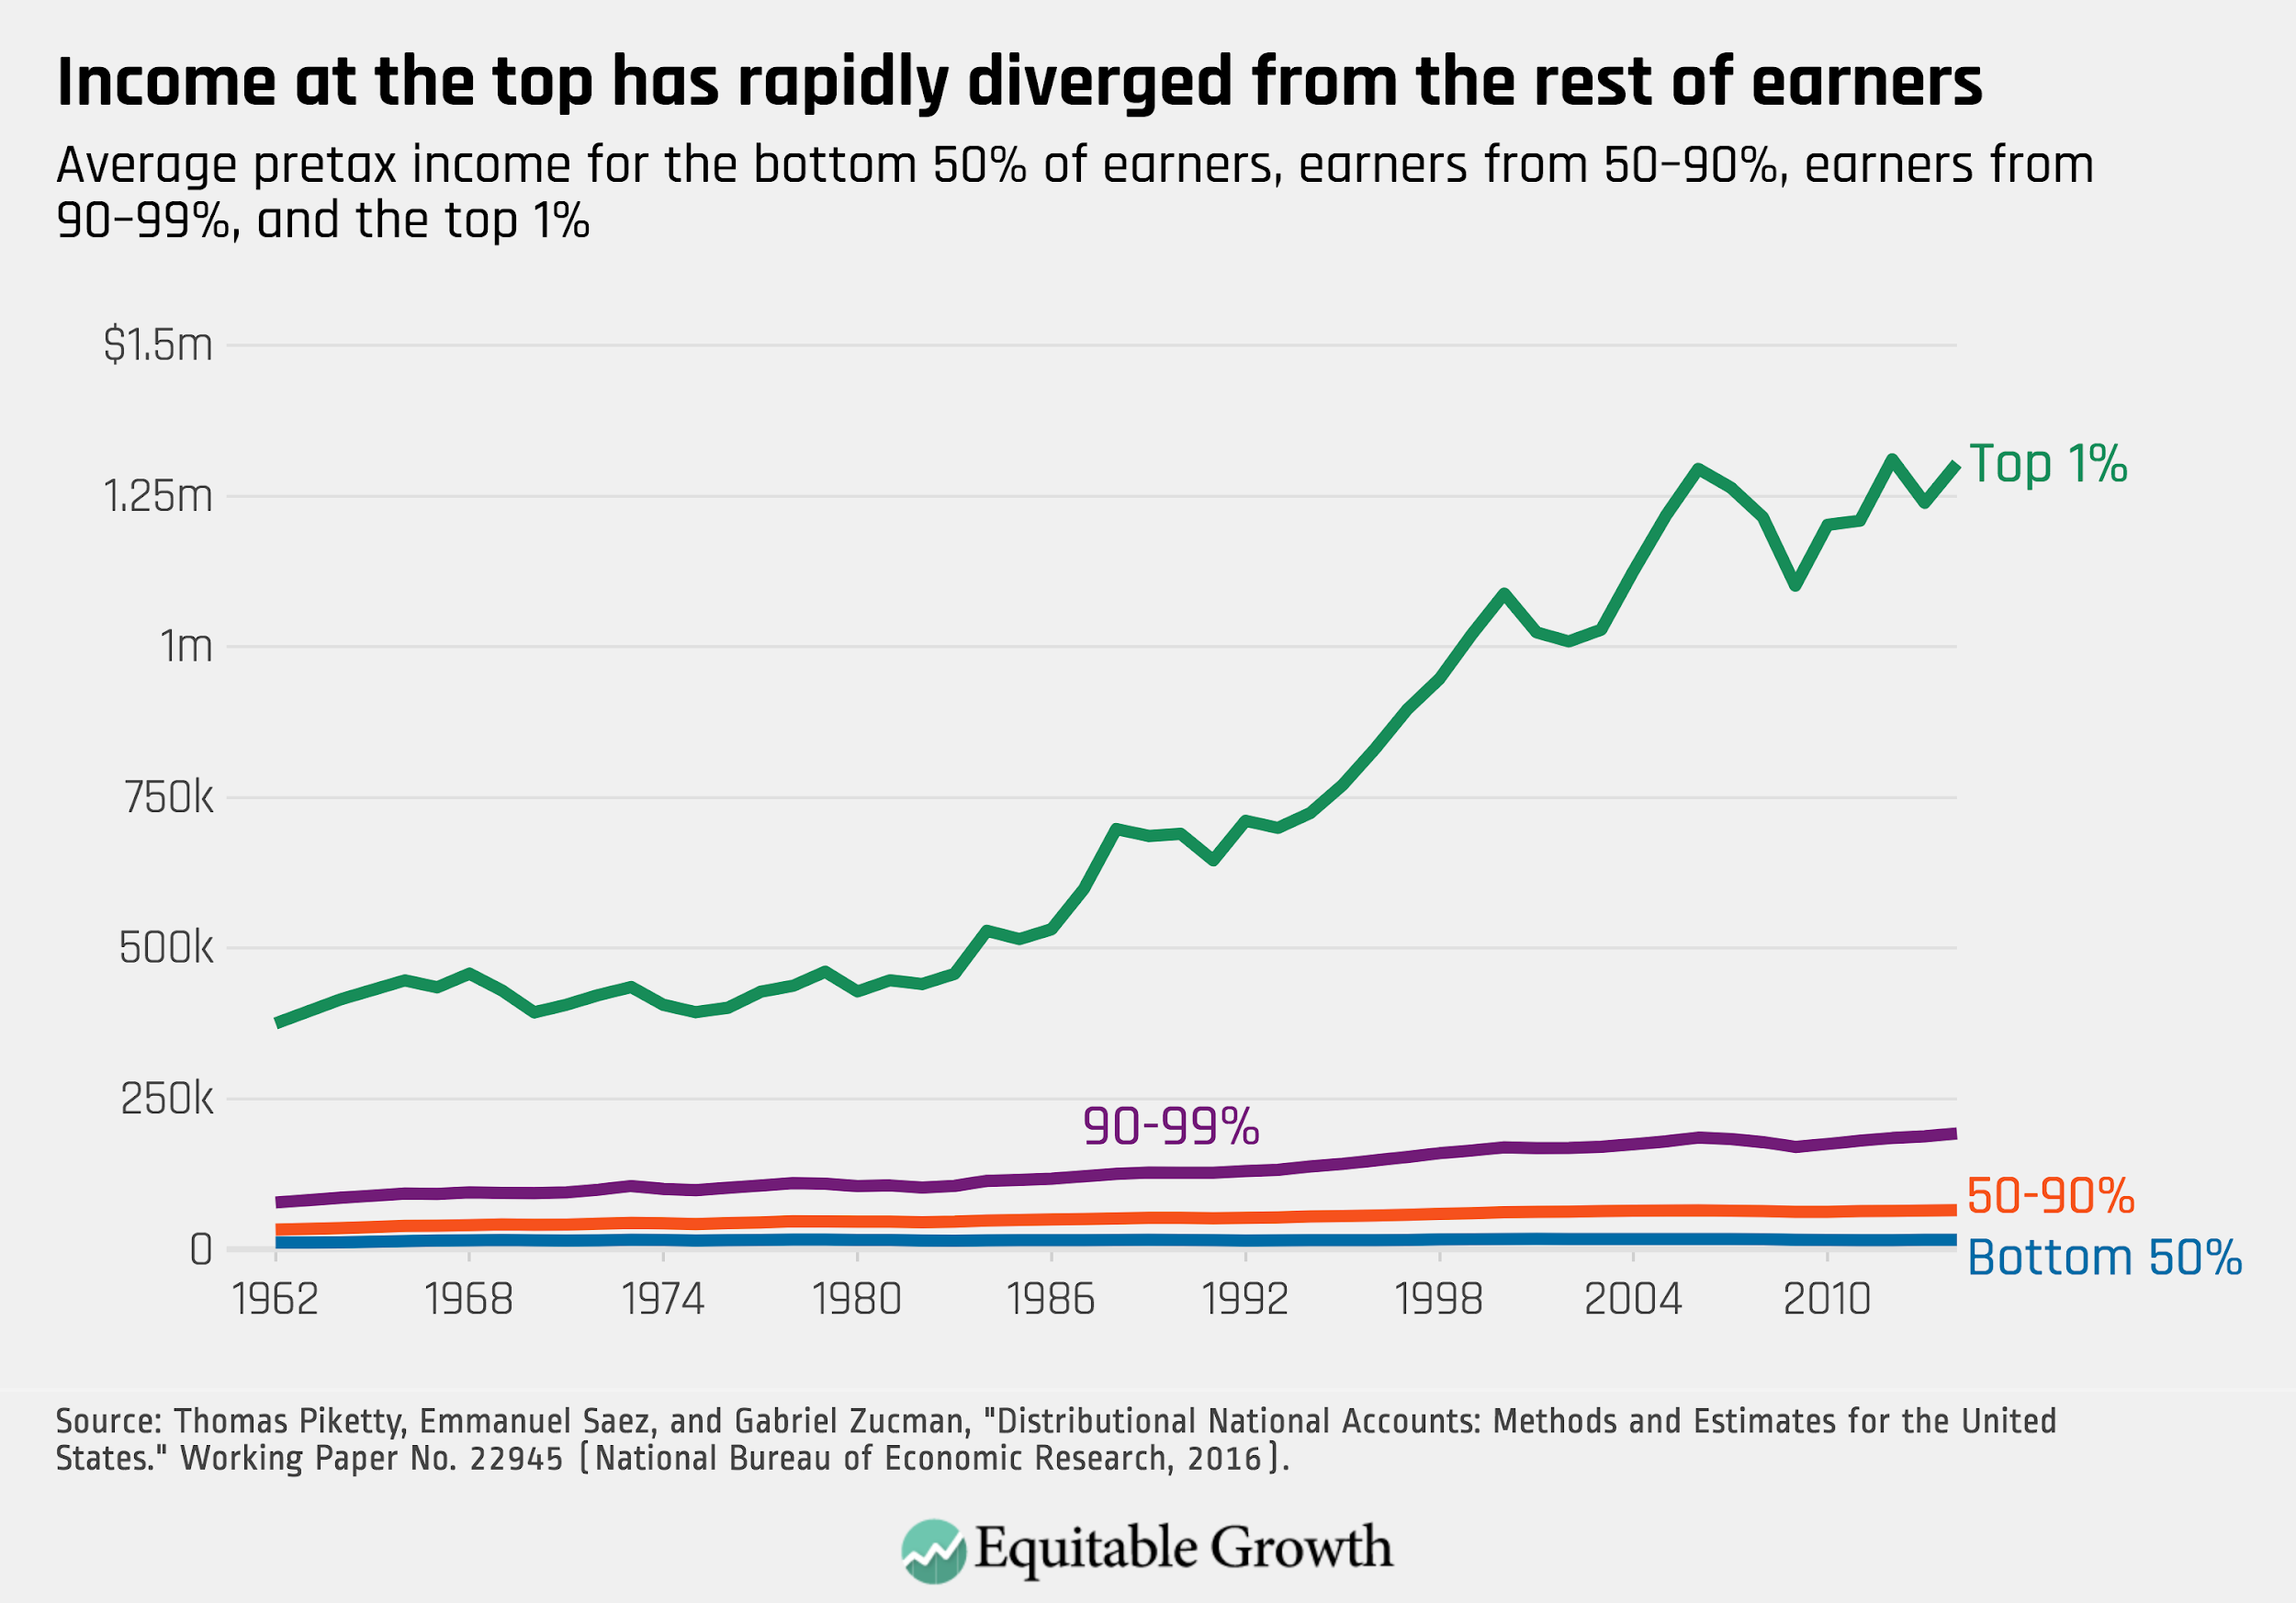
These data, and other work from Thomas Piketty, Emmanuel Saez, and Gabriel Zucman, depict the relationship between inequity and mobility, and a widening gap between the super rich and everyone else.
The research from Chetty, Hendren, Kline, and Saez also singles out five factors that have high correlation with economic mobility. Not surprisingly, one of the five drivers of mobility is social capital—essentially, connectedness. They use social capital indices (a measure for civic connectedness through religious and community institutions) and found a strong correlation with economic mobility. Tim Carney, in his upcoming book Alienated America also makes a powerful case that disconnectedness, not simply economics, is at play in the variance of vibrancy and economic well-being of some American communities versus others. Rupasingha, Goetz, and Freshwater also document a strong correlation between greater amounts of social capital and enhanced economic mobility.
Taken together, these trends of declining mobility and the power of place in predicting the economic prosperity, mobility, and connectedness of individuals are important context for the landscape in which innovation networks operate.
Sorting by Likeness in Networks
In addition to new data about geography as a predictor of economic mobility, there is another emerging trend about place: more and more Americans are living and working near people like them. Well-educated and well-off people are living with other well-educated and well-off people. People are also living close to those who share their political outlook, more so than a generation ago.
This phenomenon, coined the “the Big Sort” by journalist Bill Bishop, forms a thread in research by Richard Florida and Ed Glaeser in their work about the creative classes and about human capital segregation. Bishop and others use different sets of data to map trendlines of Americans living and working with people similar to themselves. This true more today than it was one generation ago. Bishop puts it more plainly in his book, “some cities were sucking up people and income … Others were flinging them out with what appeared to be a centrifugal force.”
While the data on increased sorting across communities in the United States is relatively recent, the idea of sorting by likeness has been documented in the network sciences for hundreds of years. Across disciplines—biology, network science, and the social sciences—there is evidence backing the theory that people and organizations tend to form connections and attractions to others who share similar characteristics, best simplified through the old adage, ‘birds of a feather flock together’. There is name for the phenomenon: homophily. In their article in Annual Review of Sociology, Miller McPherson, Lynn Smith-Lovin, and James M. Cook, describe it this way: “Similarity breeds connection. This principle—the homophily principle—structures network ties of every type.” They also go on to state that homophily limits individuals’ social worlds and has powerful implications.
Our observations about hyper-connected and under-connected city networks could reflect larger trends of economic and social capital sorting. It is also possible they reflect the longstanding principle and property of networks in nature to connect similar people, places, and cohorts, like to like. While they are often thought of as less hierarchical or institutional that other civil society structures, networks are predisposed to sort by type, presenting equity challenges for those seeking to make change across divided geographies.
Closing the Gap
As the ‘big sort’ plays out across a landscape of stratifying economic mobility and social capital, communities become more homogenous: either very rich or very poor, very connected or very disconnected. Networks can either help cross these divides or they can amplify existing fault lines of geographical inequality. For this reason, it matters that some places are networked and others are not. The distribution of networks and other assets to advance the quality of life in place is worth further scrutiny. Our research suggests that networks, without deliberate design plans, run the risk of amplifying the disconnected landscape of declining economic mobility, and polarization of social capital. The spatial data on how communities are divided along racial, economic, educational, social capital, and income lines suggests that network designers need a deliberate plan to bring innovation to all communities, especially if they seek to build solutions that can scale and reach the residents of counties and neighborhoods who are most in need.
There is good news for change-makers and philanthropies who want networks to ameliorate national trends of social capital or economic mobility sorting: our research suggests that this is possible, but only with a design plan for this purpose. Our research found a few cases of networks cutting across these trends. We interviewed numerous network managers who were thinking clearly about the challenges of bringing their networks to more disconnected communities and many who had tried to build capacity and work in communities off the map.
Several networks that we interviewed had experimented with including a network member that had less capacity with varying degrees of success. They often were able to pay for additional staff, or, with the support of a local or national philanthropy, provide resources to build capacity to allow a place to participate in a national network. FUSE Corps is a great example of how capacity can be bolstered for a city or place through additional talent: FUSE places mid-career leaders on the ground in governments they work with, adding staff and capacity on-site. We also found examples of outlier places with smaller populations and resources making enormous progress on thorny challenges. For example, through the Built for Zero Network, Rockford, Ill. was the first U.S. community to reach functional zero in ending veteran homelessness. There are plenty of examples where innovation and capacity building is happening in lesser networked communities.
Networks are being built to tackle challenges from ending police violence to reducing inequity in early education. But they are built on an uneven playing field: the stratified economic and social capital landscape of the U.S. Both the trends on inequity and properties of networks in other contexts indicate network builders and backers should be deliberate about design, in order to combat, not amplify, the larger forces driving inequity across geographies. Our research suggests, if change-makers and philanthropies want networks to address the ‘big sort’, they will need to tackle it head on.
Ten Questions to Ask Before Building a Network of Places
By Denice Ross
Are you a nonprofit, funder, or government leader working on a big problem plaguing many communities, like opioids, climate change, or disaster resilience? In recent years, networks have risen in use as a way to connect practitioners, as well as organize investments and innovation across places. Networks may be especially well suited if:
- The problem you are solving is bigger than one place can solve on its own.
- You’ve identified local innovations already happening and you want to share learnings across places.
- You want to reduce the risk of innovation and embolden local innovators to do more.
Authors Denice Ross and Tara McGuinness interviewed the leaders behind 25 place-based networks like What Works Cities and 100 Resilient Cities, ranging in size from 10 cities to over 200. They found a lot of hard-earned wisdom about the myriad design choices that go into building and improving networks. Even across domains as different as homelessness and carbon emissions, they found that network leaders had similar challenges and successes. This article distills some of the learnings from the interviews into a tool for people thinking about building networks.
Below are the 10 most important questions you’ll want to answer when designing a network.
1. What is the purpose of the network?
Be specific about naming what the network is designed to achieve. A shared purpose will inform network design, such as whether to have a “teams of teams” model or a hub-and-spoke model. A network focus also helps align activities so the people doing them have more to talk about. This can go several ways: sharing goals within a specific domain (e.g., increasing bicycling in underserved neighborhoods like the Big Jump Project) or sharing approaches (e.g., partnering universities and local government leaders to use cities as a living laboratory like MetroLab). While sharpening your purpose, it’s also worth questioning whether a network is actually the best approach at this time. (It may be that a workshop, research project, or a single-place pilot would be a better fit for this stage of your work.) Whatever your goal, be audacious. Built for Zero communities, for example, are aiming to eliminate homelessness.
2. What organizations or people will be in the network? How will you choose them?
Networks by definition are people or things that are interconnected. Who are you connecting, and how will being in a network help them? One of the most important design decisions for a network is the unit of participation. Is it a city government (e.g., Cities of Service)? A school district or university (e.g., #GoOpen or Educational Partnerships for Innovation in Communities Network)? A nonprofit or community-based organization (e.g., Code for America Brigade)? A local cross-sector partnership (e.g., StriveTogether)? Some networks have a mix of institutional types, such as the National Neighborhood Indicators Partnership which includes members hosted at universities and nonprofits. Note that even in networks for specific roles, such as the Civic Analytics Network of municipal Chief Data Officers (CDOs), or the eponymous Urban Sustainability Directors Network, the unit of membership is with the city, and when a CDO or sustainability director moves on, for example, their successor steps in with the network.
Using a competitive or invited application process can help ensure that members have sufficient capacity to be successful, and allows you to carefully curate the cohort (to match cities by size, or focus areas). The downside of selecting for capacity, of course, is that lower-capacity places may be left behind. Another option is to design low barriers to entry, such as the Alliance for Innovation, which has a sliding scale fee for membership based on municipal population size, or even to recruit members with different levels of resources and staffing to do the work, as the Police Data Initiative does to build the field across different types of police departments.
Small and Mid-Sized Cities
Some network leaders we talked to observed that resources often have a greater impact in smaller and mid-sized cities that might not be able to compete head-to-head with the Seattles and Bostons of the world. One of the greatest aspects of place-based networks is when peers learn from each other. It’s hard for a city like Denton, Texas to find commonality with New York City. If you want cities like Denton in your cohort, you must recruit more cities like Denton.
3. Who will be the points of contact between the member organization and the network?
Most networks have designated a point of contact (POC) for each member organization in order to simplify communication and increase accountability. The point of contact quarterbacks the work inside, and communicates back with the network regularly. The more aligned network participation is with the POC’s main job, the more robust the connection will be. When the network work isn’t aligned, POCs often lament that they can’t devote more resources to participating. 100 Resilient Cities addressed this by funding their resilience officers to work in member cities. FUSE Executive Fellows are specifically recruited and funded to work on a project mutually defined by FUSE and their host city, so they have both bandwidth to deliver and unusually high alignment between their network work and their city role. One cautionary tale from several networks was that a member’s participation often drops off when their local point of contact leaves that position. An organizational commitment to network participation can help ensure that a new person steps in to continue the work. Kathy Pettit, Director of the National Neighborhood Indicators Partnership, observes that in addition to having a main point of contact, they work to engage other staff members both for continuity when people leave, and also as “part of [their] mission to help develop more junior professionals in the field.”
4. How big will your network be?
The overarching factors in network size are how much central staff support is required to run the network, and how large the pool of resources is that the network is supplying to its members. Some networks cap participation, like What Works Cities, which added cities over the course of two years until reaching 100, or 100 Resilient Cities, which covered the salary of 100 chief resilience officers in cities globally. Some networks grow very slowly, with great intentionality, like the National Neighborhood Indicators Partnership which has a high bar for membership and might add a new city once a year, while providing ongoing support for candidate organizations. Other networks continue to scale indefinitely. #GoOpen is nearly a self-replicating network, as school districts find so much cost-savings in using open-licensed curricula that the regional sub-networks continue to recruit districts. Alliance for Innovation charges a membership fee that helps cover management costs as the network grows. Benchmark Cities, a network of 29 police chiefs who compare their data annually to up their game, doesn’t itself increase in size, but inspired the International Association of Chiefs of Police (IACP) to create the Law Enforcement Benchmarking and Performance Analytics Portal that can be used by any IACP member jurisdiction.
Joel Carnes, President and CEO of the Alliance for Innovation captures issue of network scale well:
“The secret sauce to working at scale is creating enough space so that network participants can ‘carry the load’ themselves by creating and sustaining groups and programs, while also creating a strong set of guard rails to ensure that everything stays on topic/mission.”
Running a Network
Roughly speaking, the people and internal systems you’ll need for running a network of less than 20 places can be more personal and ad hoc. For networks that range from 20-65 places, more formal systems need to be in place from the beginning to ensure a valuable experience for the participants. For networks larger than 65 places, support staff may be assigned to different sub-networks, and specialized software may be necessary to keep track of the progress and needs of the members.
5. How do you sustain engagement?
Once a network exceeds 20 members, it’s probably worth creating subgroups based on common attributes (geographic location, population size, issue of focus, capacity/maturity, etc.) to shrink their interactions to a manageable size. StriveTogether has its primary membership of organizations (which all meet a basic threshold for civic infrastructure), and also provides support through monthly conference calls, online resources, and technical assistance for would-be members who don’t yet qualify. What Works Cities has a rolling cohort of active cities (that are actively engaged for up to nine months) before transitioning into a lower intensity role. C40 organizes around initiatives such as urban flooding and mass transit. #GoOpen has “Ambassador” school districts who have met their commitments, are scaling and sustaining their efforts, and are then mentoring districts that are still in process. In Built for Zero, communities move progressively through a series of cohorts as they accomplish key milestones. Subnetworks are most effective with dedicated staffing to deliver value for each group. Systems to track progress and challenges will help you measure outcomes and identify common pain points. (See Question 10 below for more on tracking.)
6. What does it take to get into the network?
The barriers to entry increase as you go from requiring commitments from the practitioner, to the whole organization, to multiple stakeholders in a community. However, the impact can also increase as you go from one innovative practitioner to a collective impact model. When you are in the process of recruiting members is the best time to garner commitments for network participation. Though the high level people who make commitments are generally not the ones to do the work (with a few exceptions, such as the Bloomberg-Harvard City Leadership Initiative for mayors and senior officials), their buy-in provides cover and resourcing for those doing the work. Commitments are also an opportunity to get silos within the community to start talking to each other up front. In the Police Data Initiative, for example, the police chief and municipal chief information officer both have to sign off on the commitment to open data on policing, paving the way for the police department to take advantage of the CIO’s infrastructure for data publishing (a connection that often doesn’t manifest spontaneously).
7. Is your network time-limited? or permanent?
Given the reality that many points of contact will need to put in extra time or pull in additional resources to fully participate in your network, timeboxing the effort can make this surge doable. Another benefit of setting an end-date to a network is that once you sunset one network, you can then design the next generation network, iterating on the design based on what you learned the previous round. Building a next gen network (rather than merely continuing the original network) allows you to move the goalposts to reflect the progress you made, trim out any members that haven’t been participating, and invite in new members with high potential.
Timeboxing the network can go hand in hand with the commitments and goal-setting, especially with something like a final report or event at the end to celebrate success and create a sense of urgency to meet goals. End dates aren’t ideal for all networks, though. Some networks are better thought of as permanent civic infrastructure. The Code for America Brigades is a network in perpetuity with surges of activity, for example when disaster strikes. Living Cities is an umbrella of funding institutions that launch time-limited networks opportunistically around the network’s high-priority issues. The Alliance for Innovation is designed to build participation over decades, allowing local governments to develop both the external relationships and the internal capacity to get the most out of the network over the long-term.
8. How do network members connect?
The most appropriate combination of tools to keep a network connected depends on the needs of the network members. Networks typically go with the “lowest common denominator” technology that all participants regularly access. Keep in mind that many local governments may not be able to easily access Slack, Google apps, or webinars. Additionally, government workers may be especially risk averse in sharing their challenges and plans in a forum that might become public. That said, the more personal and relevant the communications to the network are, the more effective they are. The best cadence of check-ins depends on whether the network has an end-date, and its goals. For networks with aggressive goals and a set deadline, bi-weekly works well. For networks more long-term in nature, monthly is good, especially if there’s a means for spontaneous conversation in between. Connect less frequent than monthly, and your network may drop to the bottom of members’ consciousness.
| Scheduled Check-ins | Spontaneous Check-ins |
|---|---|
| Annual meetings and/or piggyback onto existing conferences (e.g., [C40](https://www.c40.org/) meets up at the United Nations Climate Change Conferences and [National Neighborhood Indicators Partnership](https://www.neighborhoodindicators.org/) at the Community Indicators Consortium) Site Visits (These could be trips by administrative staff to each of the sites, or travel as a cohort to see an exemplar city together, such as the [Big Jump Project](https://peopleforbikes.org/placesforbikes/the-big-jump-project/) bringing the network on a European tour to study bicycling infrastructure.) Phone or video calls ([Police Data Initiative](https://www.policedatainitiative.org/) splits up its 130 agencies into smaller groups who report out in regular 30-minute calls.) Webinar-enabled learning (Often these showcase local innovations at the beginning of the webinar, and then open up the floor for Q&A. [What Works Cities](https://whatworkscities.bloomberg.org/) hosts monthly webinars.) |
Email listservs (Whether configured as a distribution or a conversation list depends on the network size and the composition of the list.) Slack channels (most networks tried this and note that it didn’t work). The [Code for America Brigade](https://brigade.codeforamerica.org/) has had success with Slack for quick questions and Discord for more permanent conversations. Web-based forums ([USDN](https://www.usdn.org/home.html?returnUrl=%2findex.html) assures confidentiality of communications in their web site, does a newsletter roundup of the hot topics in the forum so those who aren’t logging on are still in the loop.) Participant directories to facilitate reaching out to colleagues. Facebook groups ([Built for Zero](https://www.community.solutions/what-we-do/built-for-zero) has a closed Facebook Group with more than 1,600 members that go beyond its 70 official cities.) |
9. How will you share successes and tackle common obstacles?
Most networks have some form of storytelling to showcase the success of their members and, ideally, transfer solutions across places. In truth, another benefit of storytelling we heard from our interviews was less about spreading good ideas, and more about the benefits to the place whose story was told. Having a local organization’s work recognized by a national network increases the prominence of the work locally, placates public relations staff who may be anxious about risk-taking, and helps get the work prioritized because it is viewed as high profile. Next Century Cities, whose purpose is making internet access fast, affordable, and reliable everywhere, has a savvy way to collect success stories from their members: they host an annual contest where cities submit their innovations.
Conversely, network members (especially governments) may be reluctant to share what’s not working, but doing so can be transformative for the field. In the Police Data Initiative, a high-capacity jurisdiction once explained during a check-in call that the quality of their traffic stop data was so bad it was unpublishable. This was a relief to the other jurisdictions who thought they were the only ones with that problem, and the disclosure allowed them to move forward with more confidence. Data Driven Justice network members had common concerns about how to comply with HIPAA as they share data about individuals across criminal justice and health organizations, so DDJ partners worked with the U.S. Department of Health and Human Services to create a document that addressed frequently asked questions.
10. How will you know if it is working?
As important as setting goals is tracking them. Demonstrating collective progress is invigorating for the community of practice, and can help demonstrate the value of the work to funders and other external stakeholders. The most common tool for tracking progress of participating cities is a spreadsheet, and the most common regret we heard from networks was that many did not gather baseline data or track progress in a structured way from the beginning. The Big Jump Project got ahead of this by making the first order of business for their cohort of 10 cities to install bicycle counting devices, and the reporting of bicycling data will continue for a year after the three-year network concludes. The larger your network, the more formalized your data tracking will likely need to be. Technical assistance provided by the network administration is often captured in a system that could be as simple as shared Google Docs among TA providers, a custom shared system for note-taking, or specialized customer relationship management software. Member surveys and independent evaluations can also give useful insights on how well your network is delivering value to its members and how you can improve.
In sum, there is no one best way to design or run a network. The most important thing about designing an effective network is to be deliberate in your design plan. If you’d like to learn more about the research we conducted on place-based networks, visit the interactive map of the 25 networks (as of September 2018), or read Can Networks Supercharge American Ingenuity? or the case study on Chicago, which is a super-networked city.
Common Pain Points for Networks and how to Overcome Them
Once your network is up and running, here are some tips and tricks from the interviews we conducted with network managers:
| What can go wrong | How to mitigate |
|---|---|
| Not enough bandwidth at the local level | Provide seasoned talent to lead the work locally, perhaps partnering with a network like [FUSE Corps](https://fusecorps.org/about/). Make the timeframe for the network short enough that local participants can surge their efforts without burning out. |
| Miscommunicating resources | When announcing funding for the network, make it clear exactly how local places benefit, so members can align expectations with available resources. |
| Places left behind | Create a deliberate strategy to include communities that need more help. Consider a tiered network that allows lower capacity members to get involved. Tell success stories of places with lower capacity to model what is within reach. |
| Member places who no longer contribute | Graduate those who’ve met their commitment, and give them a chance to participate as alumni if they wish, but give them a graceful exit if they don’t. Create requirements for participation, and de-list members who don’t meet them. Re-animate members by finding different local points of contact or backbone orgs, or providing intensive technical assistance. Track participation and change the status of members who are not meeting requirements for participation. The National Neighborhood Indicators Partnership has [formalized](https://www.neighborhoodindicators.org/library/guides/nnip-policy-partner-organizations-transition) this in a policy. |
| Overall participation starts to wane | Make sure that participating in the network always delivers more value than the energy members put into it. Create a new challenge that aligns well with the original purpose to reinvigorate the group. Create a governance structure where members guide decisions about resources and priorities and make the network operator more accountable to the membership. |
| Members with lower capacity fall behind | Track participation and reach out to underperformers with offers of technical assistance, funding, staffing. Consider pairing them with mentor or ambassador places like them that are doing well. Provide more than networks, dig in on root causes of execution struggles (staff, funds, other issues.) |
| Funding for local work is scarce | Increase storytelling to amplify local successes to remind communities and funders why they invest in this work. Consider bringing a few places together to pitch funders for cross-site initiatives to accelerate progress on a critical issue. Provide guidance on fundraising to members through venues like funder panels or guides, and share sample proposals and business plans across members. |
| Leadership transitions happen and participation in the network becomes less of a priority | Encourage diverse stakeholders for the local work to insulate against leadership changes. Garner organizational commitments up front so it’s the organization, not an individual, who makes the commitment. Promptly initiate personal connections and other onboarding procedures with new points of contact. |
Chicago: Profile of a Networked City
By Hana Passen
Introduction
Networks are everywhere you look. From General McChrystal’s Team of Teams approach to the war against Al Qaeda in Iraq to the Sustainable Brands Corporate Member Network’s commitment to sustainability, investors and practitioners alike have turned to networks to solve the kinds of intractable problems that can only be tackled by large numbers of people in many places working in a coordinated fashion. In recent years, the world has explicitly begun to focus on networks as a way to make change happen on a large scale.
New America has released a map (as of September 2018) of innovation networks across American communities. We interviewed leaders of 25 place-based, outcome-oriented networks of various sizes and designs that connect over 270 locations with nearly 2,000 connections. We have highlighted a number of lessons about intentional network design and the characteristics of highly networked cities, and identified trends in nationwide equity (you can find more information about the project methodology here).
We found that participating in well-designed networks can help cities punch above their weight nationally. Participation also reduced political risk for the city and gave leverage at the local level to prioritize innovative projects. Network participation energized city innovators with support from peers across the country, and emboldened local communities to ramp up their innovation and creative problem solving. Here, we explore the ways a city that participates in a large number of place-based networks can benefit from some of these effects through its connections to a broad coalition of cities working towards the same goals.
Chicago, Illinois, is what we call a “highly-networked city.” It is well-linked to other cities and resources across the country: Chicago and its metropolitan area are connected to 20 of the 25 networks we sampled, and account for 62 of the nearly 2,000 connections in our research. The networks focus on issue areas as varied as resilience, innovation, sustainability, and homelessness, and provide resources like technical assistance and peer learning.
Chicago is, generally speaking, a well-resourced and civically-engaged city. Chicago is often described as “city of neighborhoods.” It is home to a number of powerful philanthropies with either a Chicago-specific or regionally-based funding portfolio, and institutions across Chicago host highly-respected leadership programs. In 2017, WalletHub ranked Chicago the 15th most caring city in the country based on a number of workforce and community indicators, and there are over two dozen college and universities that call Chicago home. Voter turnout in presidential elections in Chicago’s Cook County regularly exceeds the national average of around 60 percent. The Chicagoan civic technology community is active, and the city was an early adopter of many open government innovations like participatory budgeting, open data, and the creation of the chief data officer position. Chicago is also home to innovative organizations and practitioners doing cutting edge work on community organizing, housing finance, artificial intelligence, public health, and public interest technology, to name a few sectors.
Chicago: Networked for Impact
The City of Chicago is highly networked with other communities around the country, participating in 12 of the 25 networks we examined. When we consider the larger metro area, its inter-city connectedness is even more pronounced: Chicago’s metro area is tied with Boston as the second most networked metro in the country, behind only the San Francisco metro area.
By participating in these networks, Chicago not only inspires communities nationwide with its leadership in civic innovation, it also gains access to the wisdom of other places in fields ranging from homelessness and sustainability to education, resilience, and government innovation.
One example of how networks have improved Chicago’s capacity to address big challenges is the way Chicago leveraged its connections in the Civic Analytics Network (which connects municipal chief data officers) to build a municipal ID program called CityKey. After Chicago passed a Welcoming City Ordinance to emphasize the city’s commitment to its population of undocumented immigrants, city officials needed to develop a system of identification for these Chicago residents. Tom Schenk, former Chief Data Officer of the City of Chicago, explained how he leaned on experiences from his peer in New York City to help build an ID program that would protect Chicago’s undocumented population:
“At the time, for context, NYC was fighting a lawsuit because [the Department of Homeland Security] had subpoenaed all records of anyone holding New York City’s municipal ID. We wanted to avoid that, so in our approach, our CityKey is your bus pass or library card, but we don’t have a database centralized anywhere. So we integrate into existing infrastructure, and we don’t have to worry about being subpoenaed for records … We’ve had 20,000 of those cards issued across the city of Chicago. And by having it as a card that’s a bus pass, library card, discounts at museums, etc, you make it convenient enough to make sure that it’s not just undocumented folks holding onto the card as a scarlet letter.”
In this case, the connection to other cities through the Civic Analytics Network helped Chicago improve upon the New York City model to better serve their residents.
Chicago’s participation in the i-team network (a Bloomberg Philanthropies-funded network which brings innovation teams and a common playbook to execute on a city’s mayoral priorities) has had a different type of lasting effect due to the influx of talent and the shared experience with i-teams in other cities. Many of the Chicago i-team members ended up infusing the network’s innovation focus in other areas of local government, such as the police department and policy team in the mayor’s office. Schenk noted that the i-team “helped the City of Chicago as an institution, that brought people together to work on innovation … A lot of today’s senior [city] leadership really maps to the original i-team.” With the i-team members hired on as staff in the City of Chicago, their innovation-focused approach remained a key part of Chicago’s executive team.
Chicago has demonstrated many of the learnings about what happens to cities when they participate in networks. Chicago’s high levels of connectedness allowed it to learn—and create—best practices on project implementation and staff up city government to address resident needs.
Connecting Within Chicago
Though it is one of the most networked cities across the nation based on the sample of networks we surveyed, opportunities remain to connect within the city. Various actors in Chicago are seeking to build connectivity to address issues like the racial wealth gap and community disinvestment.
It is impossible to consider disconnection in Chicago without also considering historic racial segregation and its long-term effects. Chicago is one of the most segregated cities in the country, with historical redlining and predatory housing practices forming the basis of lasting social and community segregation. Today, the racial wealth gap in Chicago is wider than the already-wide national average. The median income for white Chicagoans is more than twice that of African American Chicagoans, and slightly less than twice that of Latinx Chicagoans. The average white-owned business is worth more than twelve times the average African American-owned business, and the unemployment rate for workers of color in Chicago is three times that of white workers. It is against this backdrop that we consider the lack of connection within Chicago.
Chicago is rich in research on its community networks. There are robust network analysis studies examining climate networks, media habits, and community resources within Chicago neighborhoods. For example, the research organization MDRC produced a very detailed analysis of networks at play in nine Chicago neighborhoods, while the Science of Networks in Communities (SONIC) lab at Northwestern studied community knowledge hubs that might be leveraged to execute on Chicago’s Climate Action Plan in two neighborhoods. The studies showed that strong community networks exist within neighborhoods, that different kinds of organizations play key roles in different neighborhood networks, and that different neighborhood networks are structured in different ways rather than in unified structures across the city.
While a cadre of actors solving a problem in a city may be able to learn from people addressing a similar challenge in other cities—like in the impressive work that All Chicago is doing with Built for Zero to address homelessness in Chicago—connection across places should not be equated with connection within a place. As Tom Schenk explained:
“There were times when it was easier for me to talk to other cities than talk to other institutions within Chicago … With tech and data, it’s easy to reach out to tech and data people in other cities, because we spoke the same language. In reaching out to community organizations, we may not speak the same language. The bond is ‘we want to improve the city of Chicago’, but sometimes the premises of the conversation aren’t enough to build a clean path forwards. And these are not new challenges—tech and data are new, but the things you need to get the job done are classic things: relationship development, getting incentives to align across multiple partners. Tech and data don’t magically solve those.”
Chicago has a vibrant civic tech community, informal structures that connect tech and data work across the city, and an open data portal, and has led pioneering work in civic tech ahead of many other cities in America. Chicago does not participate in the more formal leading national network in city-wide data collaboratives, the National Neighborhood Indicators Partnership (NNIP)*. A 2013 Urban Institute report on Chicago’s community information infrastructure identified two major findings: first, that Chicago was early to adopt open data frameworks and has a wealth of institutions using data for the public good, and second, that no single organization takes responsibility for “the recurrent assembly and dissemination of neighborhood-level national and local data across multiple issue areas.” Existing efforts to use and share data for the public good are at work on a variety of singular projects but opportunities remain to advance data sharing across issues with shared infrastructure.
Conclusion
Chicago is the picture of a highly networked city, in the national context. With twenty networks at play in the metro area, Chicago has been able to learn from its peers, contribute meaningfully on the national stage, collaborate across issue areas, and build the city’s capacity. Chicago also demonstrates that a high level of connectivity across cities does not necessarily mitigate historic differences between neighborhoods within a city. Chicago, like many places, faces ongoing challenges in building across the starkly differently resourced neighborhoods of the city, and the legacy of racial and wealth inequality that spans generations. The “city of neighborhoods” has a large number of community resources that, if connected intentionally, might be brought to bear to address some of the city’s longstanding challenges.
*This article is based on data collected as of September 2018. On November 29, 2018, the National Neighborhood Indicators Partnership (NNIP) welcomed the Institute of Housing Studies at DePaul University in Chicago as a new member of the network.
Appendix: Technical Documentation
Our methodology was to 1) evaluate if the network met our inclusion criteria (below), 2) learn as much as possible from their web site and other public sources, 3) conduct a structured interview with the person who actively manages the network, 4) put the member-places from each network into an Esri StoryMap, 5) standardize the content about each network for the map, 6) summarize interview findings to inform the design of future networks.
Although there are many more than 25 place-based networks, we aimed for diversity of domains, network size, and geographic areas. We stopped interviewing when we reached theoretical saturation, that is, the same concepts kept appearing in our interviews.
We also interviewed points of contact in a super-networked city (New Orleans) to understand more about the on-the-ground experience.
To be included in our research, a network had to be:
- Place-based – Participants focus their work in a specific town, city, county, or region.
- Minimum scale – Networks must operate in at least 10 places to participate, and the geographies must be distributed (e.g., not all in one state or region).
- Role-based – A place's participation outlasts individual participants (e.g., if a sustainability director moves on to the new job, the next director will participate in the network).
- Shared domain of interest – These networks identify a problem being worked across communities (e.g., reducing homelessness, using data analytics better in local government, increasing resilience to climate change).
- Composed of practitioners – People actually doing work in this domain are the ones who participate.
- Peer-to-peer learning – More than a top-down dissemination of best practices, these are innovation networks where members learn from each other.
- Sustained interaction – Although most networks have in-person meetings, sustained interaction (such as webinars, Slack channels, listservs, etc.) is a key element to maintaining momentum.
- Shared repertoire of resources – Common challenges are addressed with centrally located resources such as toolkits, how-to guides, sample contracts, software tools, and case studies.
- Formal process to join – The network has a defined process for becoming a member, perhaps through an application process, a commitment, or payment of dues.
This research does not include:
- Professional associations where individuals, not places, are the members.
- Initiatives where a best practice is propagated top-down; there must be significant opportunity for local innovation and leadership.
- Grant programs that fund in a variety of places.
- Initiatives that do not have a list of “member” places.
Currency of data:
This research relies on data collected primarily in summer of 2018. Network members are subject to change, so please refer to the network web sites for current listing of participating places. Network methodologies also change over time (as they should!). The descriptions in the map represent the network’s approach in summer of 2018.
More About the Authors

Tara Dawson McGuinness
Founder & Executive Director, New Practice Lab

Denice W. Ross

Anne-Marie Slaughter
CEO, New America