Table of Contents
- Introduction
- National Naloxone Access Map
- National Prescription Drop-off Map
- Celebrating Lost Loved Ones Map
- Case Study: Northern Kentucky
- Case Study: Tri-County, Colorado
- Case Study: DuPage County, Illinois
- Case Study: Cook County, Illinois
- Case Study: Alameda County, California
- Case Study: Tempe, Arizona
- Case study: Northeastern University
- Getting Started With Local Opioid Work
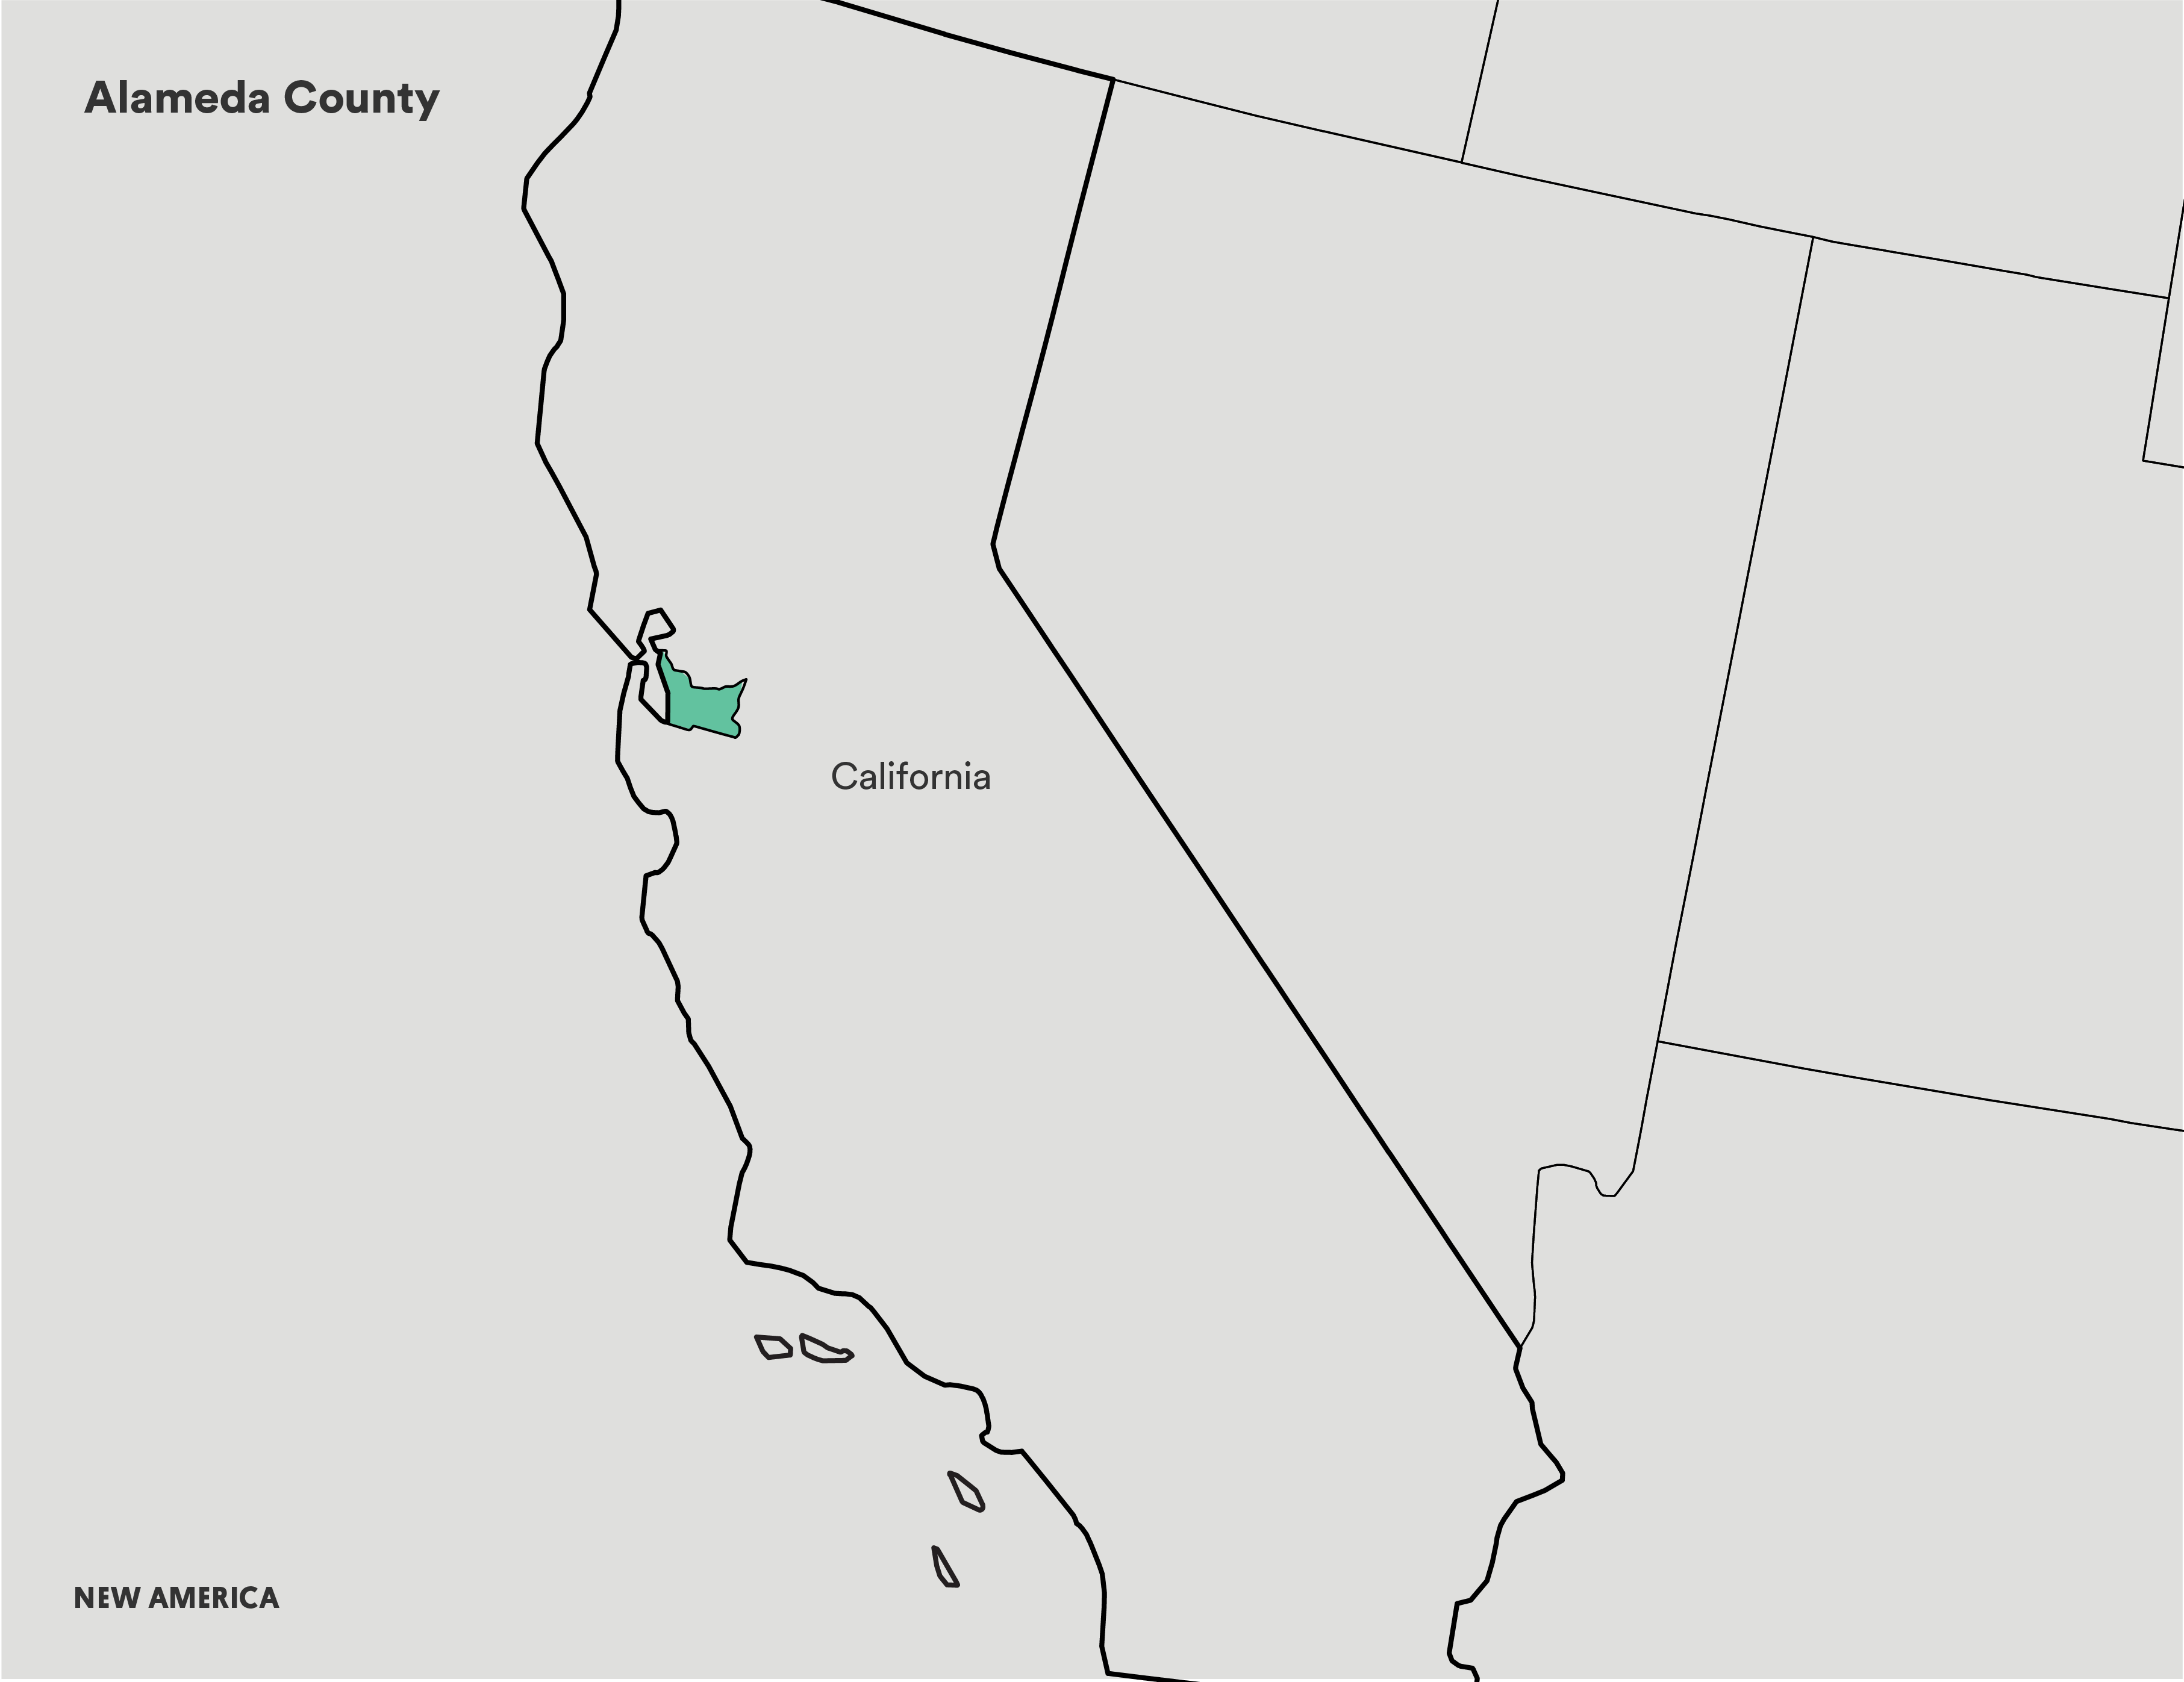
Case Study: Alameda County, California
“Our maps have been instrumental in providing context to the problem of opioid addiction for the East Bay Safe Prescribing Coalition—a group comprised of prescribers, health care providers, and policymakers. Through mapping our data, we have learned that there is so much more to do. We now plan to approach new departments for data, including poison control, emergency services, and the coroner, as well as try to get more timely data on ER visits.”
Matt Beyers, Acting Supervising Epidemiologist, Alameda Public Health Department
Though Alameda County has relatively few opioid-related deaths compared to the rest of California, the opioid epidemic is still a challenge for the community. In particular, the low number of deaths has made it more difficult to confront the epidemic, because it seems like a less pressing concern for residents and therefore can be pushed out of view.
Local coalitions are trying to change this perception by increasing awareness of opioid use, reducing the number of opioid prescriptions given in the county, and increasing access to naloxone. They see their work as “bending the demand curve” by showing the real risk to benefit ratio of taking opioids for any reason.
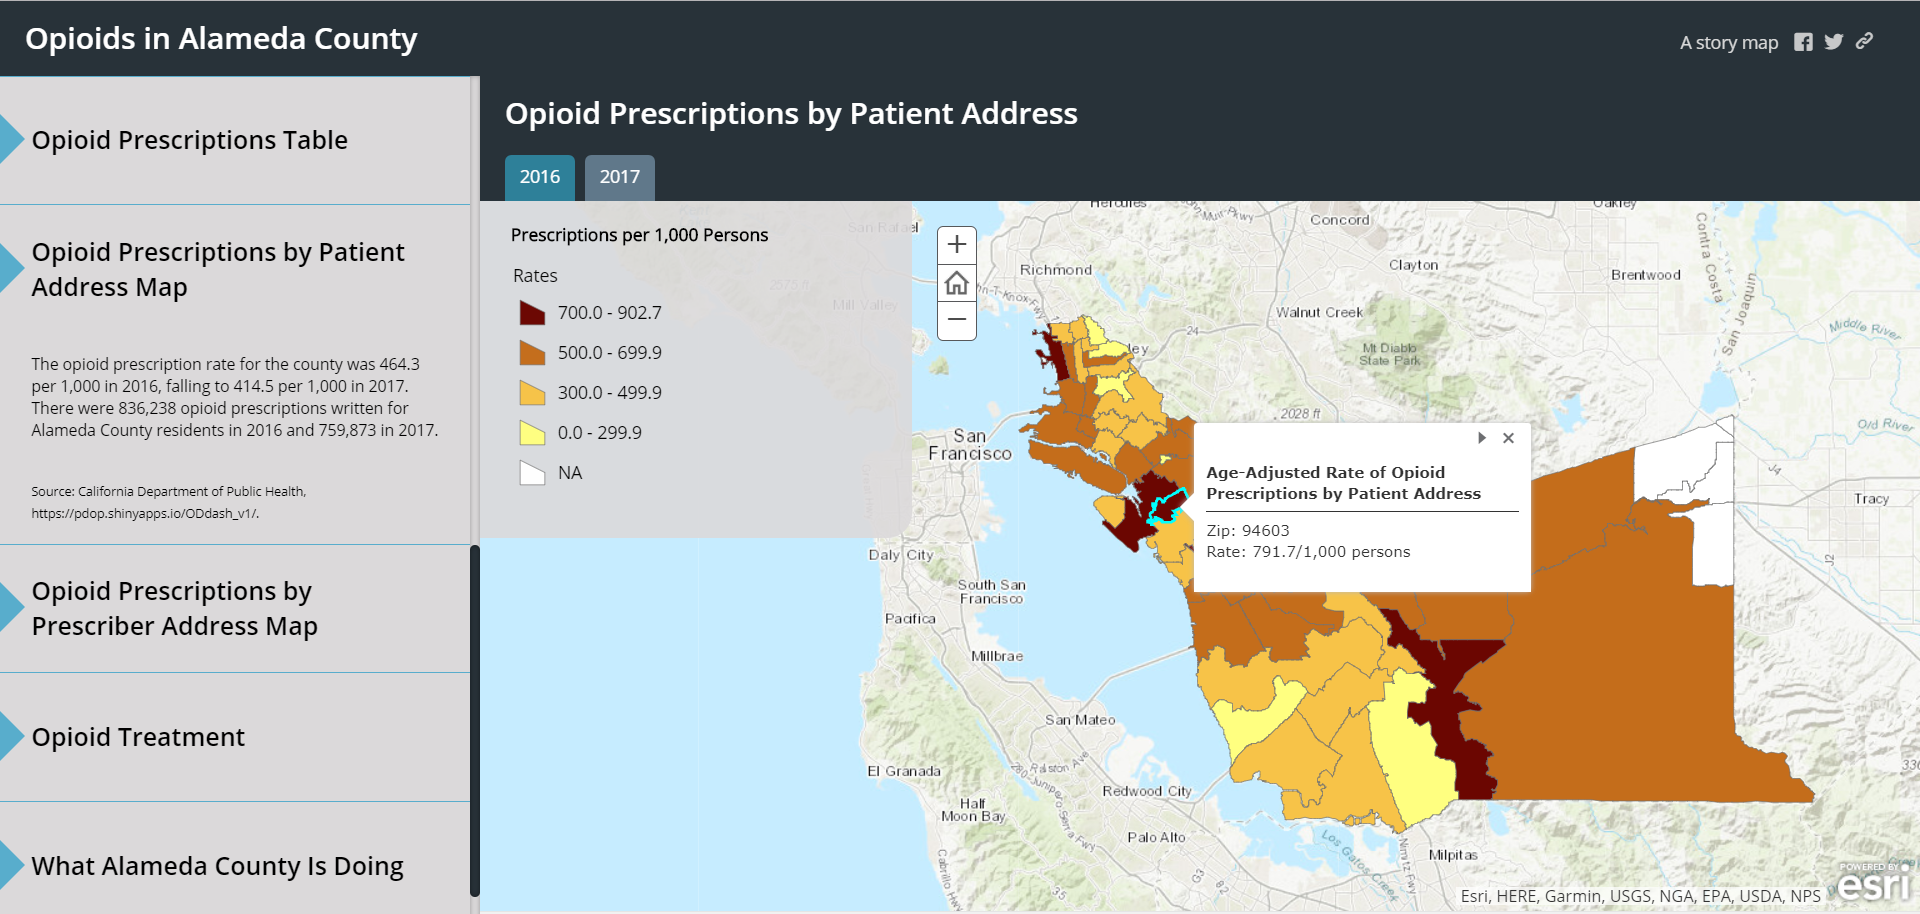
They also engage in the more common mapping techniques of other members of the Opioid Mapping Initiative. They too use a story map to illustrate inpatient visit occurrences for opioid and heroin-related reasons. By charting demographics alongside visits, the local data has contradicted many county-level reports that contended a lower risk of opioids to African American communities in comparison to other races. In fact, the African American community in certain parts of Alameda County is more impacted by opioids than other races. These statistics are vital to public information campaigns.
The county has also mapped opioid prescriptions in order to see where education about the risks of prescription drugs could be most beneficial. By breaking down data from the county to the community level, the maps have been able to show avenues for more targeted responses.