
Table of Contents
Borrowing for Non-Tuition Costs, Family Income, and Sector of Enrollment
Institution Sector
Borrowing behavior varies considerably according to the type of institution that a student attends. For instance, over half of students at private nonprofit and for-profit institutions took out loans in the 2015–16 school year, while just 14 percent of students at public two-year institutions did so.
Differences also emerge in the share of students borrowing in excess of tuition and fees across sectors. Of students at for-profit, private nonprofit, and public four-year institutions, a similar share borrow for non-tuition expenses. This means that much of the variation in the overall share of student borrowing can be attributed to differences in the share of student borrowers who take on debt for tuition costs only. In contrast, even though students at public two-year institutions have much lower rates of borrowing than the other three sectors, nearly all borrowers take on more than they pay in tuition and fees.


Similarly, among students who borrow, the average amount borrowed across all loan sources (including private loans and loans to parents) ranges from $9,000 to $11,000 per year, with the exception of borrowers at community colleges, who borrow far less. These similarities in overall borrowing amounts are complicated by the highly variable tuition that students pay. At public four-year institutions, borrowers pay about $5,000 in tuition and fees after accounting for grants and scholarships, while those at private nonprofit institutions pay over twice that figure, and community college students who borrow pay just one-tenth of that amount.
Related to this wide variation in the net price of tuition, the amount borrowed for non-tuition costs differs significantly across sectors. While students at for-profit institutions typically borrow less than they owe in tuition and fees, students at public four-year institutions apply about $4,000 toward non-tuition expenses.
Family Income Level
Across all sectors, family income is also closely related to whether or not a student borrows in excess of institutional charges.1 Although students from low- and high-income families borrow student or parent loans at roughly the same rate (40 percent), nearly a third of low-income students borrow more than they pay in tuition and fees. Among high-income students, however, just 20 percent borrow for their non-tuition expenses.
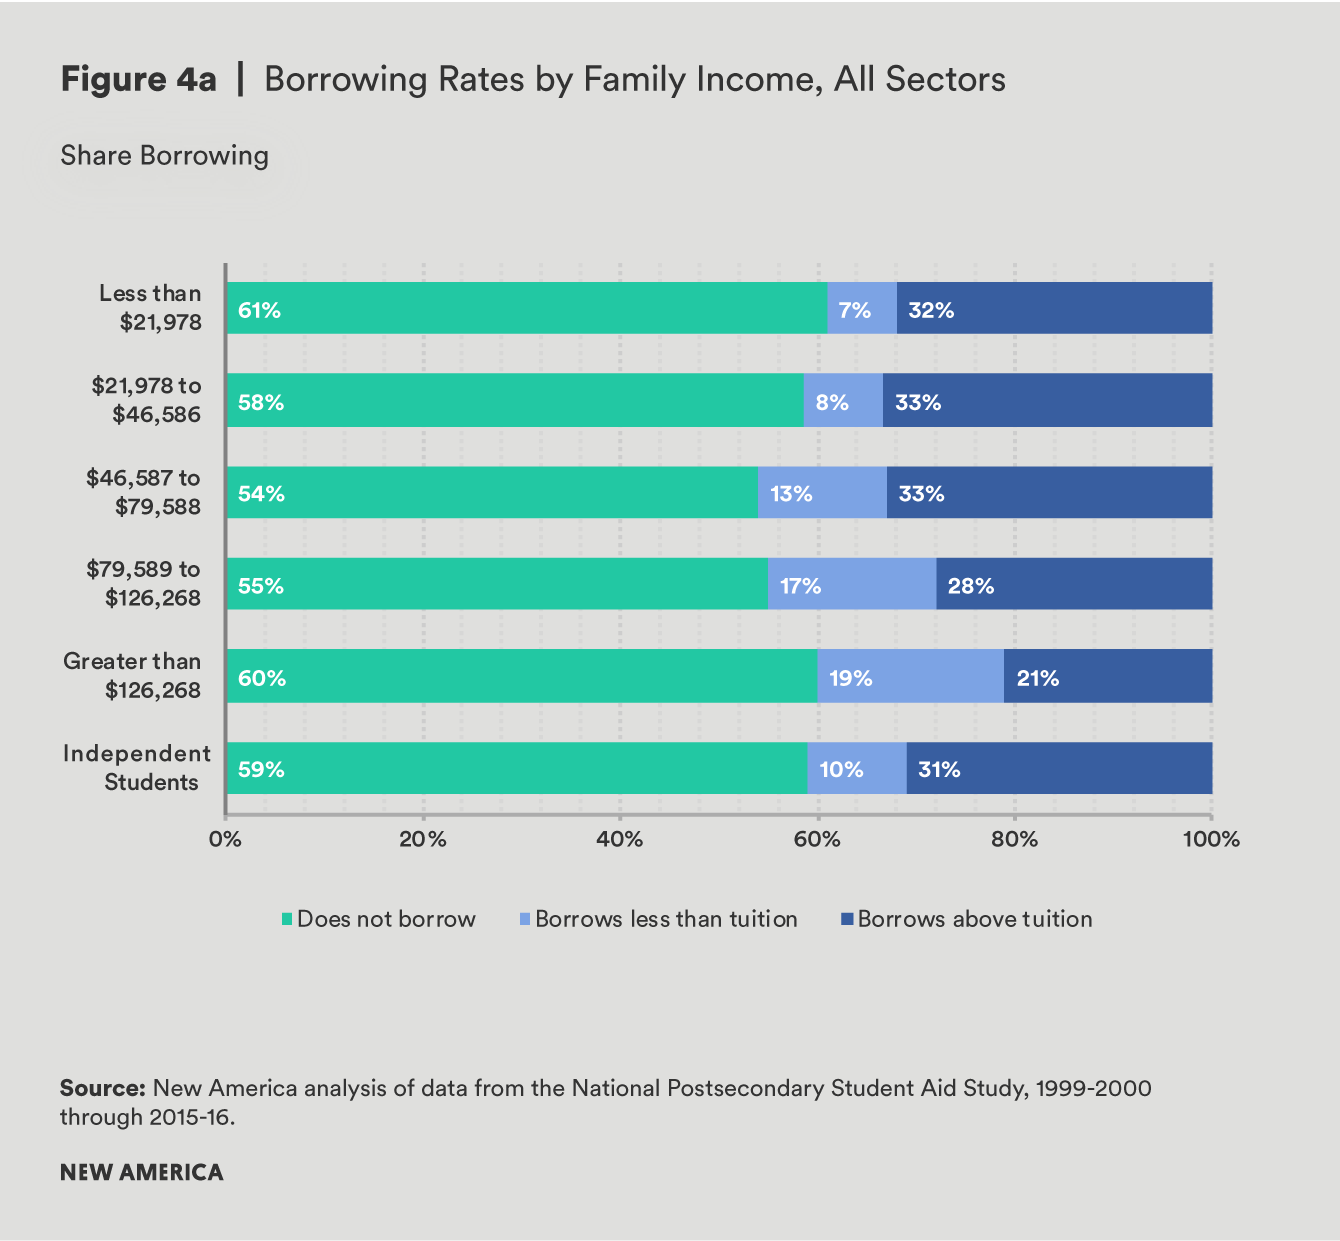

High-income students also borrow far more. With an average of $7,680 in total annual loan debt, low-income borrowers take on about half the amount of those in the highest income category. Despite borrowing less in total, low-income dependent borrowers are much more likely to borrow for their non-tuition costs. Whereas low-income borrowers take on $3,806 more than their net price of tuition, the average high-income borrower takes out $793 less than what he pays in tuition and fees.
In light of the heavy sorting that results between various sectors of higher education based on family income (see Figure 1), analyzing student borrowing rates across these two factors independently only provides a partial glimpse into student borrowing behavior. The following tables focus first on low-income students across sectors of enrollment, before turning to students with varying income levels at public four-year institutions, in order to exemplify broader trends in borrowing for non-tuition expenses at the intersection of family income and institutional sector (see appendix for a detailed breakdown of borrowing behavior by sector and enrollment).
Institutional Sector, Low-Income Students Only
When looking exclusively at low-income students, many of the same patterns seen for all students emerge. Low-income students at community colleges still borrow at much lower rates than low-income students in every other sector, and nearly all borrowing is driven by non-tuition costs for this income group. In contrast, low-income students at private nonprofit and for-profit institutions borrow at much higher rates than those enrolled in either community colleges or public four-year universities, but the share borrowing above the cost of tuition is much lower.


Low-income borrowers at public four- and two-year institutions borrow the lowest dollar amounts by a significant margin. Nonetheless, both groups rely on larger loan amounts to cover non-tuition expenses.
Family Income Level, Public Four-Year Schools Only
Taken together, it is clear that institutional sector is related to borrowing decisions, even among students from similar economic backgrounds. At the same time, students within a given sector can have vastly different experiences based on their family income. In order to explore this, we focus on students of all income levels attending public four-year schools (more detailed breakdowns of student borrowing across income and sector are available in the appendix).

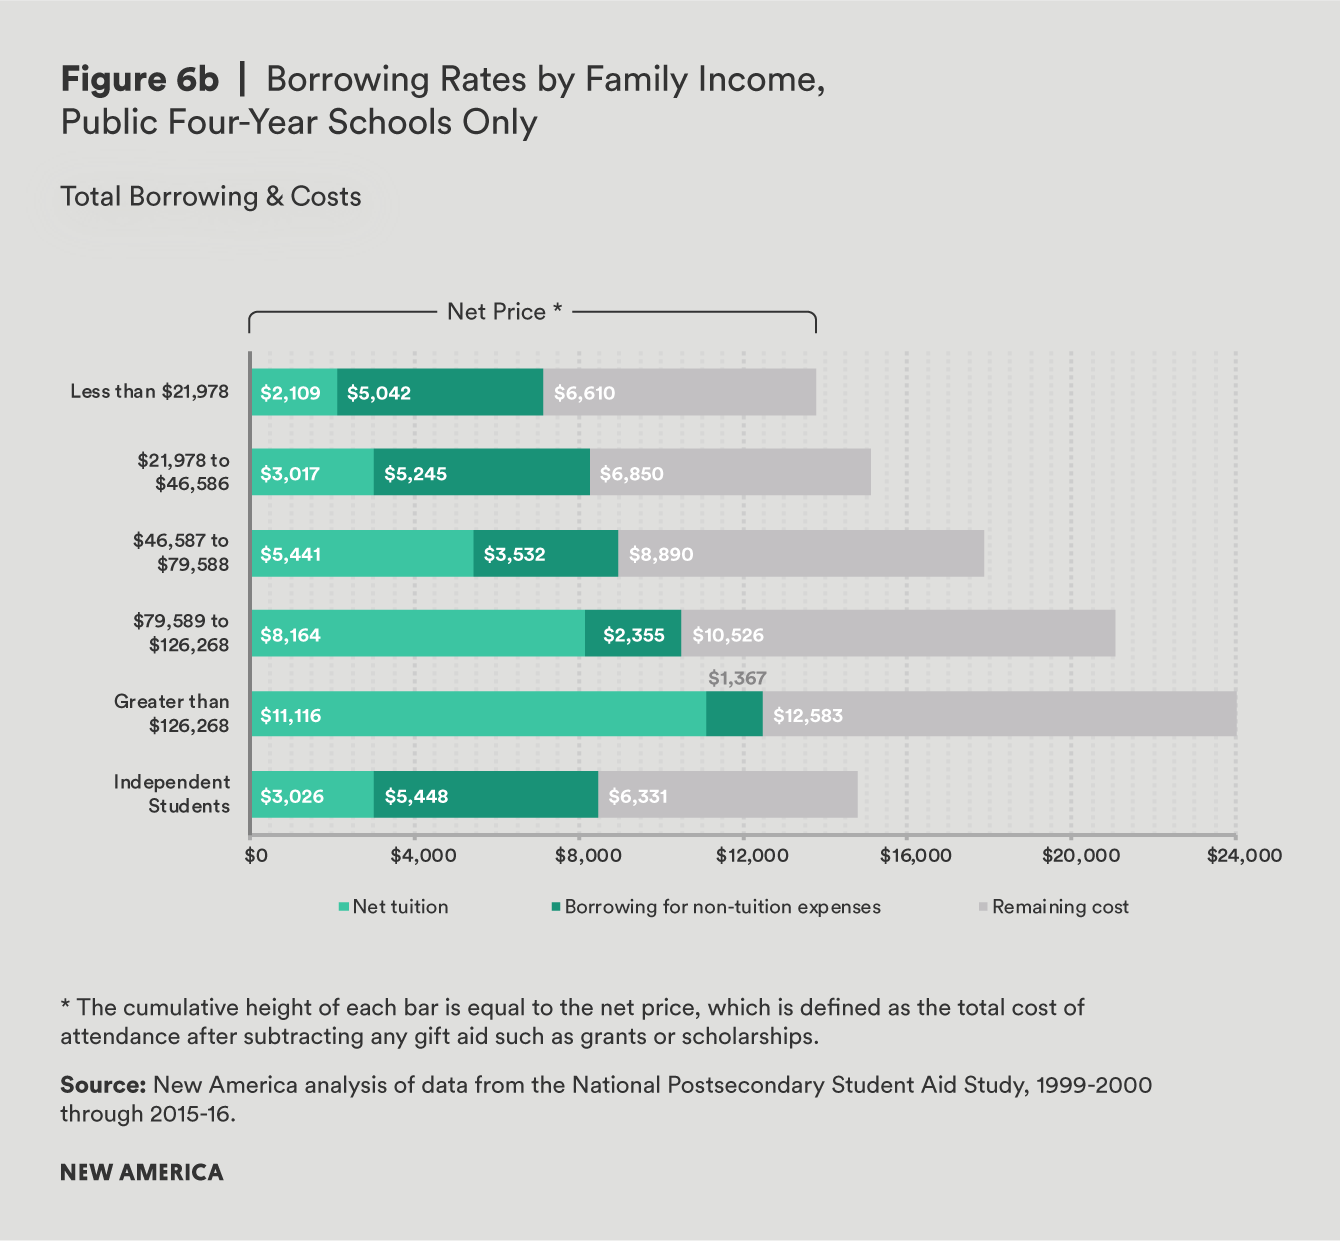
Among students at public four-year schools, those from low-income families are only slightly more likely to borrow than their upper-income peers. For instance, while 53 percent of low-income students at public four-year institutions borrow, 44 percent of those in the highest income quintile do the same. However, when it comes to borrowing for non-tuition costs, 46 percent of low-income dependent students at public four-year schools borrow more than they pay in tuition and fees, compared to just 24 percent of high-income students in the same sector. This pattern is similar to what we see at private nonprofit and for-profit institutions, as well as community colleges, indicating that family income is related to whether or not students borrow for non-tuition costs regardless of the sector of the institution they attend.2
What may be surprising, however, is that even among students attending the same type of institution, the average low-income student borrows significantly less than a student from a higher-income family. For instance, while low-income students at public four-year schools borrow an average of $7,151, students at these schools from the highest income category borrow on average $12,484—or over $5,000 more. This pattern holds across all types of institutions (see appendix).
Importantly, although low-income students tend to borrow less overall–in part because they face lower tuition prices—the amount they borrow for non-tuition expenses tends to be higher within every sector of higher education. Since low-income students and their families have fewer resources to devote to the cost of college, this may explain why they are more likely to use loans to cover non-tuition expenses.
Citations
- We show family income for dependent students only. Because of the way NPSAS measures income information, parental income for independent students is not available. Instead, earnings for independent students often reflect their earnings while enrolled in school, however, these earnings are not always an accurate reflection of the economic circumstances of the student or her family.
- See Appendix for a full breakdown of these numbers by institutional sector and family income.