
Data and Methodology
Data Sources
The data on child care employment come from the CPS.1 Specifically, we rely on monthly CPS samples from September 2023 to July 2025. The analytic sample includes women ages 22 to 64, regardless of whether they are employed and regardless of whether they are foreign- or U.S.-born. Males are not included in the analysis, given that they comprise only 5 percent of the child care workforce (authors’ calculation based on Current Population Survey data). We further limit the sample to those not in the armed services. We report separate results for foreign- and U.S.-born individuals, where the former is defined as someone who is born abroad and is either a noncitizen or a naturalized citizen.
Following the previous work from Ali, Brown, and Herbst, we use the CPS’s industry and occupation codes to examine the effect of ICE arrests on the decision to work in the child care industry.2 The primary outcome is measured as a binary indicator equal to one if a given woman is employed in the child care industry and zero otherwise. This dichotomous measure of child care employment is frequently used in the literature as a proxy for supply. We then examine employment choices within three sectors of the child care industry: center-based providers, home-based providers, and private household caregivers. Center-based workers include non-self-employed individuals working in what the CPS labels the “child daycare services” industry, and whose occupation is a child care worker, preschool or kindergarten teacher, education administrator, special education teacher, or assistant teacher. Those in the home-based sector are self-employed and working in the “child daycare services” industry with an occupation of child care worker or education administrator. Finally, private household caregivers are defined as those employed in what CPS terms the “private household services” industry and whose primary occupation is a child care worker.3 All other individuals in the sample are either employed outside the child care sector or are nonworking. The full sample includes 614,061 individuals, of which 107,672 are foreign-born and 506,389 are U.S.-born.
The data on ICE arrests were obtained from the Deportation Data Project, which collects and makes publicly available anonymized U.S. government immigration enforcement datasets, typically by using Freedom of Information Act (FOIA) requests. The current analysis relies on a dataset of arrests (or apprehensions) by ICE during the period September 2023 to (late) July 2025. Arranged at the (individual) arrest-level, the data contain 291,723 arrests. ICE agents record a variety of information about each arrest, including the date of arrest, the state in which it occurred, the apprehension method (e.g., at a local jail, a workplace raid, or a traffic stop), and a nearby landmark. The data also include unique person identifiers as well as information on the gender, year of birth, and country of citizenship of those arrested.
To prepare the data to be merged with the CPS, we first removed all duplicate arrests as well as those occurring outside the United States.4 Of the 283,580 remaining arrests, 229,415 contained information on the state in which the arrest occurred. We utilized the following procedures to assign a state of arrest to as many missing fields as possible. First, there are 25 ICE Enforcement and Removal Operations (ERO) offices in the United States, each one covering a different Area of Responsibility. Most of these EROs cover multiple states.5 However, 10 EROs cover a single state.6 Under the assumption that the ICE arrests listed under each of these 10 EROs occurred in the corresponding state, we assigned that state to the arrests with missing state information. This was overwhelmingly the case in practice. For example, 99.9 percent of arrests in the Buffalo Area of Responsibility occurred in New York; 98.2 percent of arrests in the Baltimore Area of Responsibility occurred in Maryland; 99.9 percent of arrests in the Phoenix Area of Responsibility occurred in Arizona; and 99.9 percent of arrests in the San Antonio Area of Responsibility occurred in Texas.
Second, we used the “apprehension landmark” variable to make additional state-of-arrest assignments. This variable frequently includes information on the actual location of the arrest (e.g., jail or sheriff’s office name), a physical landmark, or street name, or it includes the name of the county or state in which the arrest occurred. We relied on a combination of artificial intelligence (AI) and searches on Google Maps to assign state names based on this information.7 Ultimately, we were able to assign a state name to all but 7,669 ICE arrests (which were dropped).
We then produced a state-by-month dataset of the number of arrests over the period September 2023 to July 2025. In the regression analysis, this variable is expressed as the log number of ICE arrests per foreign-born individual. The foreign-born population was calculated in state-by-month cells using the CPS. It is important to note that the reference period for the CPS’s labor force participation questions is the calendar week that includes the 12th day of the month. Therefore, we attempted to achieve a more precise temporal match between the CPS’s reference period and the date of arrests recorded by ICE. All arrests made in the first 15 days of a given month are assigned to the same month.8 However, arrests made after the 15th day of the month are assigned to the following month. Once these revised assignments were completed, we merged the arrest data to the CPS in state-by-month cells.
Methodology
The data described above are used to estimate two models. To examine the impact of ICE arrests on child care employment decisions for foreign- and U.S.-born women, we estimate the following:
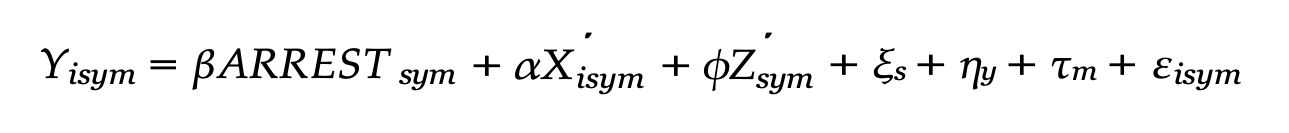
where Yisym denotes the binary indicator for employment in the child care industry for woman i located in state s in year y and month m. The primary variable of interest is ARRESTsym, which represents the log number of ICE arrests per foreign-born individual.9 The coefficient on this variable, β, is interpreted as the percentage point change in the likelihood that a woman is employed as a child care worker for a 1-percent increase in the rate of ICE arrests. The model includes a set of individual-level demographic controls (X′ ), including age fixed effects, separate binary indicators for whether the individual is married and is non-white, the number of children in the household, family size, and educational attainment fixed effects. Also included are a set of time-varying state characteristics (Z′ ), including the Hispanic share of the population, the share residing in metropolitan areas, and the share employed. Finally, the models include a set of state fixed effects, ξs, year fixed effects, ηy, and month fixed effects, τm, to account for any geographic and temporal unobservables that may be correlated with women’s occupational choices.
We then examine whether the ICE arrests during the first six (full) months of the new Trump administration affected child care labor supply differently than the arrests made prior to President Trump taking office. Formally, the analysis is conducted by way of the following model:

where ARRESTsym is defined in the same manner as above, and TRUMPym is a binary indicator equal to one for all observations between February and July of 2025 and zero otherwise. In this model, the coefficient β captures the impact of ICE arrests on child care employment in the time period before President Trump’s second inauguration, hereafter referred to as the pre-Trump period, while the coefficient on the interaction term, ζ, captures whether there was a slope shift in—or a differential effect of—ICE arrests after the inauguration. In this setup, the sum of β and ζ gives the impact of ICE arrests in the post-Trump period, defined in this report as after his second inauguration (i.e., between February and July of 2025).
Both models are weighted using the CPS final person-level weight, and the standard errors are clustered at the state level. We report separate results for foreign- and U.S.-born individuals as well as by child care sector (i.e., center-based services, home-based providers, and private household caregivers). Some models also report results by level of schooling attainment and by Hispanic ethnicity. In the child care employment analysis, individuals with no more than a high school degree are referred to as “low-education,” while those with more than a high school degree are referred to as “high-education.”
Citations
- Sarah Flood et al., Current Population Survey Data for Social, Economic and Health Research: IPUMS CPS: Version 13.0 [dataset] (Integrated Public Use Microdata Series, 2025), source.
- Ali, Brown, and Herbst, “Secure Communities as Immigration Enforcement,” source; Chris M. Herbst, “The Declining Relative Quality of the Child Care Workforce,” Economics of Education Review 109 (December 2025): 102726, source.
- Home-based child care providers typically operate independent, small businesses out of their own home and care for small groups of children of varying ages. Private household caregivers are employed in the home of the family using the child care and are either unpaid or paid at a negotiated rate. Such individuals are sometimes referred to as nannies or au pairs.
- For example, under the data field “apprehension state,” some arrests were reported to have occurred in Guam and the Virgin Islands or to have involved European-based members of the armed forces.
- For example, Atlanta’s ERO office is responsible for Georgia, North Carolina, and South Carolina as its AOR.
- The 10 offices (and their associated states) are: Baltimore Area of Responsibility (Maryland), Buffalo Area of Responsibility (New York), Harlingen Area of Responsibility (South Texas), Houston Area of Responsibility (Southeast Texas), Los Angeles Area of Responsibility (California), New York City Area of Responsibility (New York City and parts of upstate New York), Newark Area of Responsibility (New Jersey), Phoenix Area of Responsibility (Arizona), San Antonio Area of Responsibility (Central Texas), and San Diego Area of Responsibility (California).
- The AI procedure is a form of text-based geographic inference, which is conceptually related to but distinct from traditional geocoding. Instead of matching structured address data to a spatial database, the AI approach uses natural language processing and pattern recognition to infer geographic entities from unstructured text. The model interprets contextual cues—such as city, county, or institutional names and state abbreviations—to identify the most likely state associated with each “landmark” entry.
- For example, if an arrest occurred on March 10, 2025, we assigned the month of arrest as March. But if an arrest occurred on March 25, 2025, we assigned it to April. We experimented with other cut-off dates, such as the twelfth, and our regression results are very similar.
- There is a small number of state-months containing zero ICE arrests. We therefore add one arrest to all state-month combinations before taking the log.