
Table of Contents
Predatory Loans Hit Chicago’s Black and Latino/a Communities Hard
Exorbitant interest and fees have cost Black and Latino/a communities dearly, as those same communities struggled with fewer assets, lower incomes, and lesser access to banks and affordable financial products. Over the years, predatory loans have taken a major financial toll in Black communities in the Chicago area, especially, making it more difficult for families to build a cushion of assets to weather major disasters and build a secure future.
Nationally, studies on payday loans specifically have shown that the majority of users are non-white. In 2016, nearly half of the households who used payday loans were non-white (47 percent). Black households were 2.5 times more likely than white households to have used a payday loan.1 Although these loans allow traditionally excluded households access to cash, this access is provided under high-pressure conditions, along with extremely high-interest rates, that ultimately threaten long-term financial stability. While individuals often use these loans to make ends meet, the incredibly high-interest rates end up taking money needed for living expenses, throwing people into a wrenching cycle of debt.
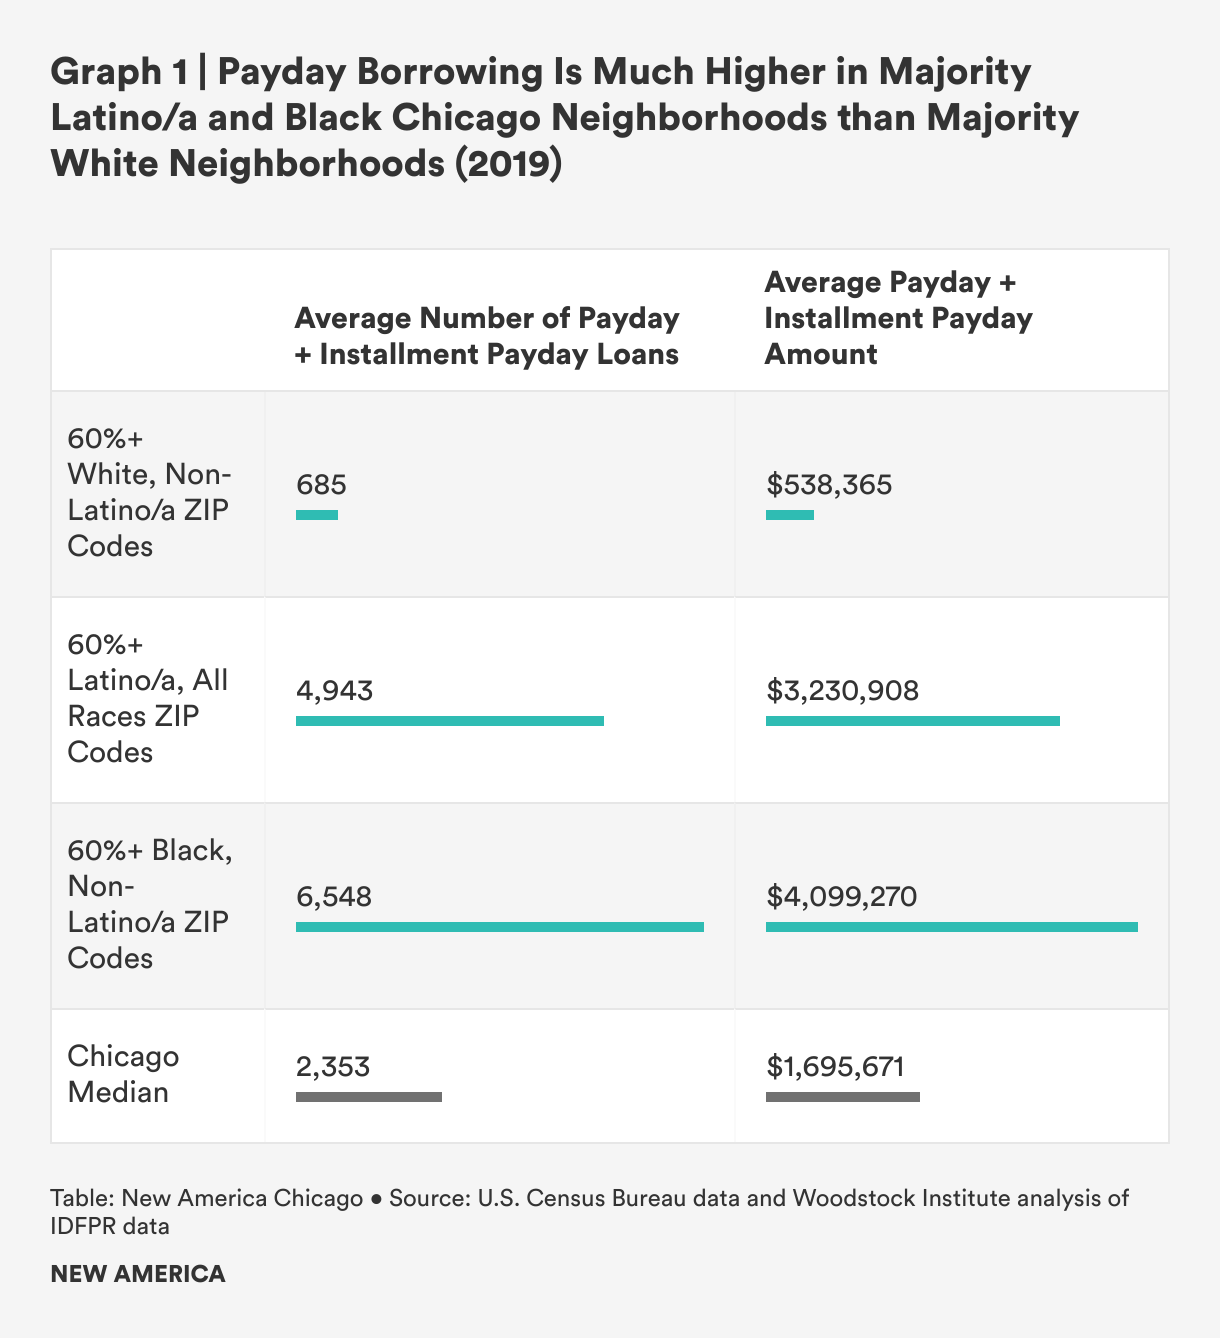
Our analysis of two types of payday loan data shows a similar pattern.2 Across the state, two major types of predatory borrowing, payday and installment payday loans, were much more concentrated in majority Black, majority Latino/a, and majority-minority ZIP codes than majority white ZIP codes.3 In Chicago, by the sheer number of loans and dollars borrowed, payday and installment payday loans were almost ten times more common on average in majority Black ZIP codes and over seven times more common in majority Latino/a ZIP codes than white ZIP codes.

Predatory Loans are Particularly High in Black Chicago Metro Area Communities
These loans are particularly high in Chicago metro area Black communities, with a substantial number of loans in Latino/a areas as well. A considerable amount of these loans are concentrated in primarily Black suburbs. Dolton, Broadview, and Robbins have some of the highest rates of payday and installment payday loan usage in the entire state. The first two have just over 20 loans per 100 people. Robbins has almost 19 payday loans per 100 people. The residents of Dolton are over 92 percent Black, and all three suburbs are over 75 percent Black. Several other suburbs with high concentrations of Black residents include ZIP codes with some of the highest rates of payday loans statewide (see Appendix B for a detailed list).
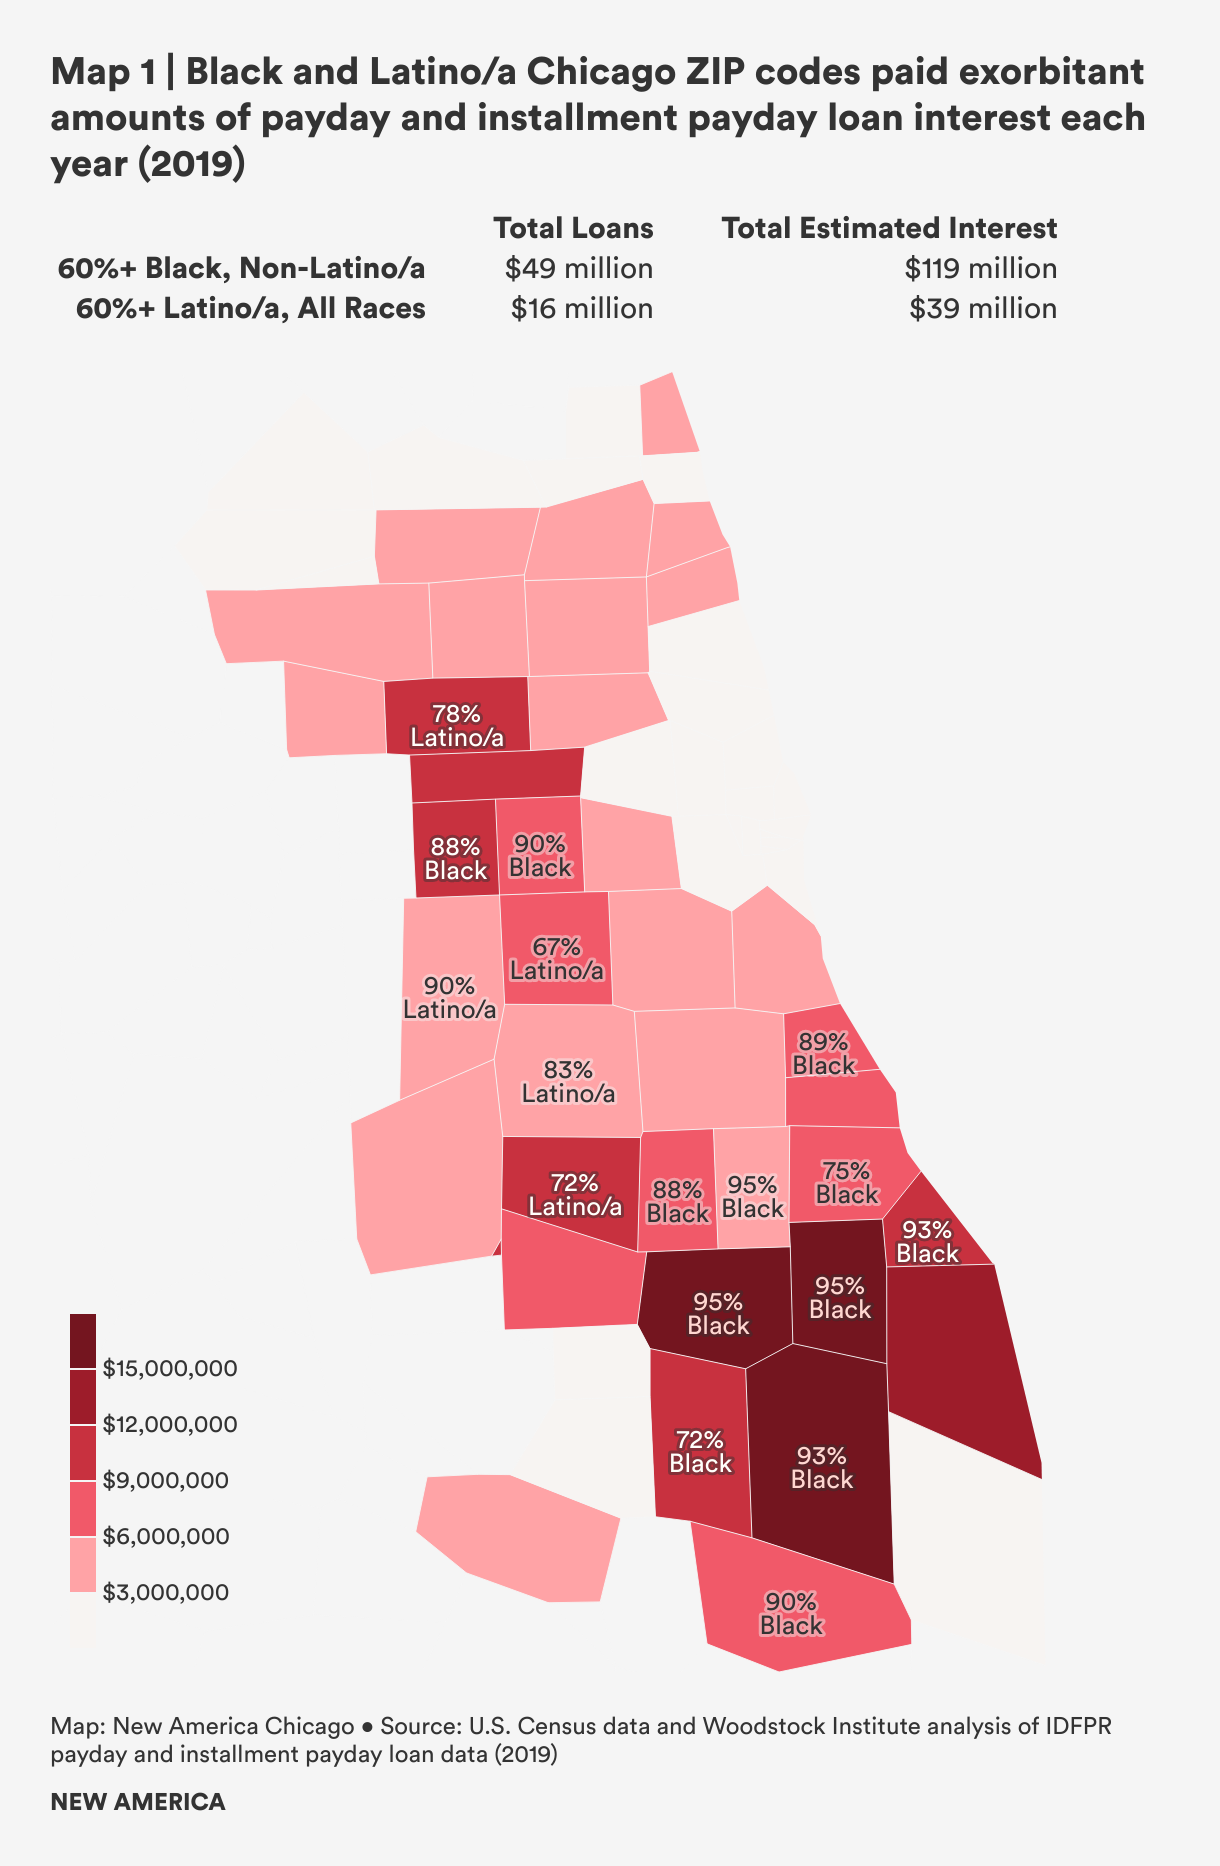
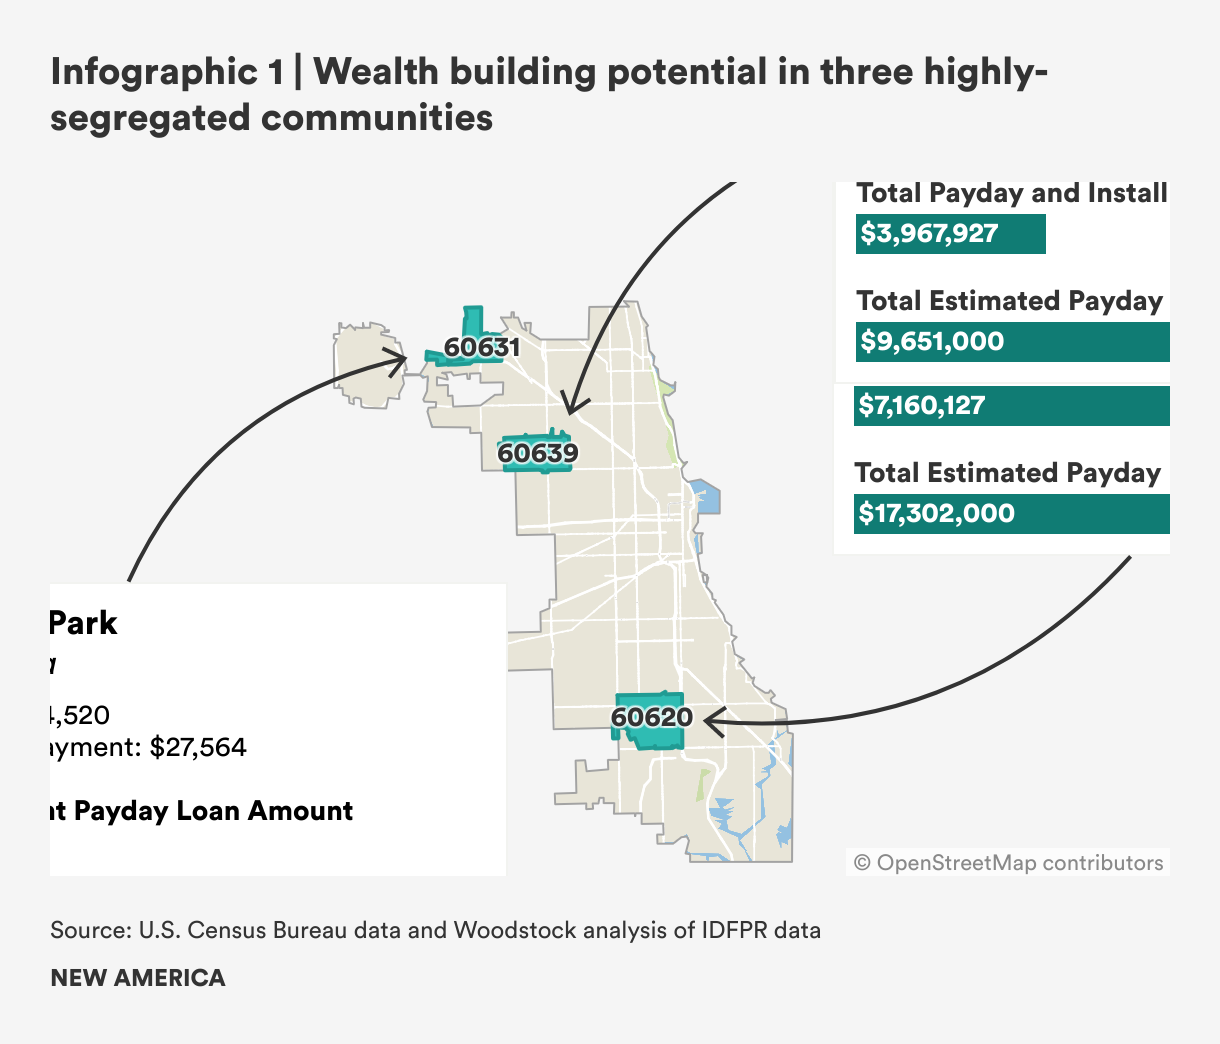
In the city of Chicago proper, payday and installment payday loans were highest in highly segregated Black ZIP codes. Looking at how common these loans are and taking population size into account, the seven ZIP codes in Chicago with the highest number of loans per person are all over 87 percent Black, with the exception of one ZIP code in the Loop. The highest number of payday loans per capita is found in 60619, which also has the highest percentage of Black residents in the city. The area includes Burnside and Chatham, among other neighborhoods, and has nearly 17 payday and installment payday loans per 100 people. Following close behind, 60620, which includes parts of Auburn Gresham and Washington Heights, among other neighborhoods, is second in per capita payday loans and is also over 95 percent Black. These two ZIP codes alone paid over $30 million in interest on just the payday loans made in one year. Yet both communities have median annual incomes between $37,000 to $39,000. In 60620, the interest paid would have consumed the average mortgage payments for an entire year for 1,300 families.
Latino/a Areas Less Concentrated but Pay Millions in Exorbitant Interest Each Year
In the Chicago area and all over the state, there are much fewer concentrated Latino/a ZIP codes. So, targeting these ethnic communities based on geographic location is more difficult to do and there are fewer obvious patterns in loan usage. Payday loans are less common in concentrated Latino/a ZIP codes than in concentrated Black ZIP codes. However, payday loans are still much more common on average in majority Latino/a ZIP codes than in majority white ZIP codes in Chicago. In particular, the average number of loans and amount of loans is considerably higher in majority Latino/a ZIP codes in the city than in white areas. The Latino/a areas with the highest payday borrowing dollar amounts also tend to have lower median incomes than other areas. Payday loans show a slightly different pattern than installment payday loans suggesting they may have been more common in Latino/a areas.
Payday borrowing was somewhat higher in 2019 in Latino/a areas of the city ($16.2 million) than majority Latino/a suburban areas ($12.3 million). Across Latino/a metro areas, the highest amount owed in payday loans was found in the city in 60629 (Chicago Lawn and West Lawn). This was followed by 60639 (Belmont-Cragin and Hermosa) and 60623 (North and South Lawndale). While city of Chicago majority Latino/a areas lead overall in the amount of dollars borrowed, one suburban area edged out city ZIP codes in per person incidence. Across metro area ZIP codes with high concentrations of Latino/a residents, the highest number of payday loans per 100 people was in 60432 (Joliet) despite a lower dollar amount, followed by 60639 (Belmont-Cragin) and 60623 (North and South Lawndale). The other two areas rounding out the top five were both suburban 60165 (Stone Park) and 60160 (Melrose Park). Across the majority Latino/a areas of the metro area, 60623 had the lowest median income at $34,431, over $12,000 less per year than any other majority Latino/a ZIP code (see Appendix B for a detailed list).
In just one year, people in highly concentrated Chicago Black and Latino/a ZIP codes borrowed $65.3 million in payday and installment payday loans. With average interest rates and fees equaling 299 percent for payday loans and 233 percent for installment loans, this means these 17 ZIP codes lost another $158.2 million in interest just from 2019 loans. Including majority Black and Latino/a communities across the city and suburbs, these communities paid $261.9 million in exorbitant interest rates for loans made in 2019.
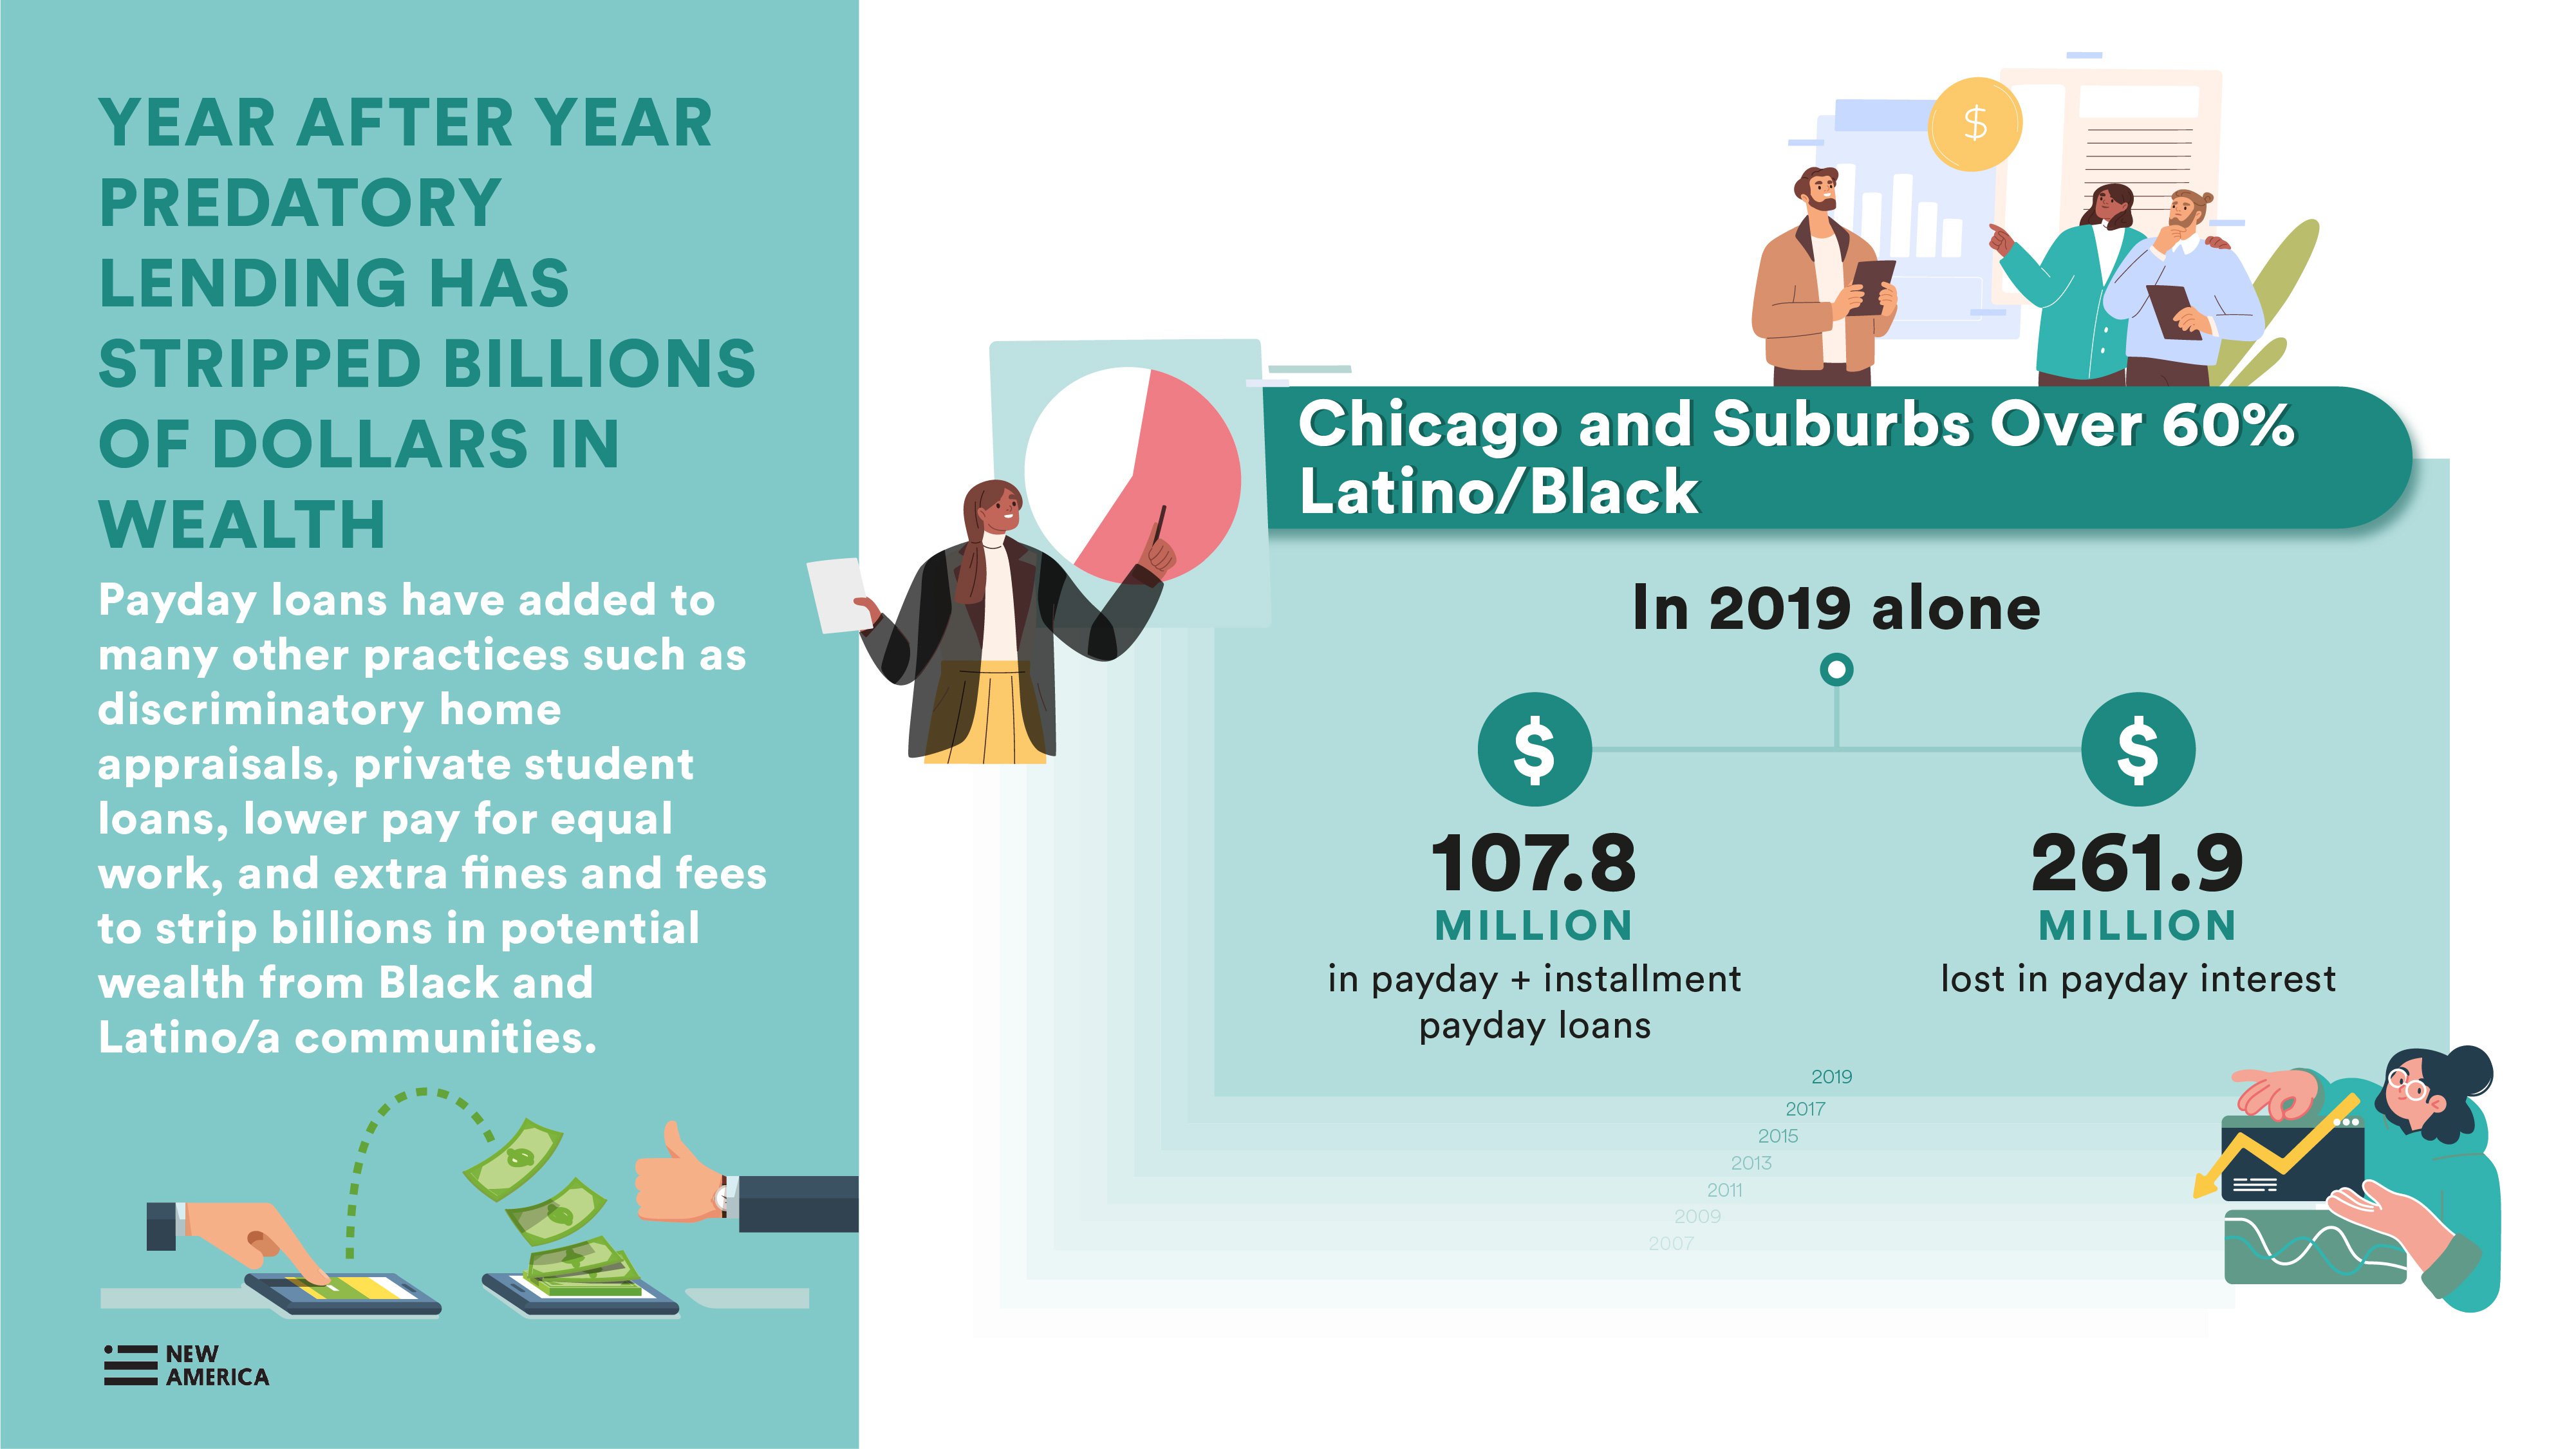
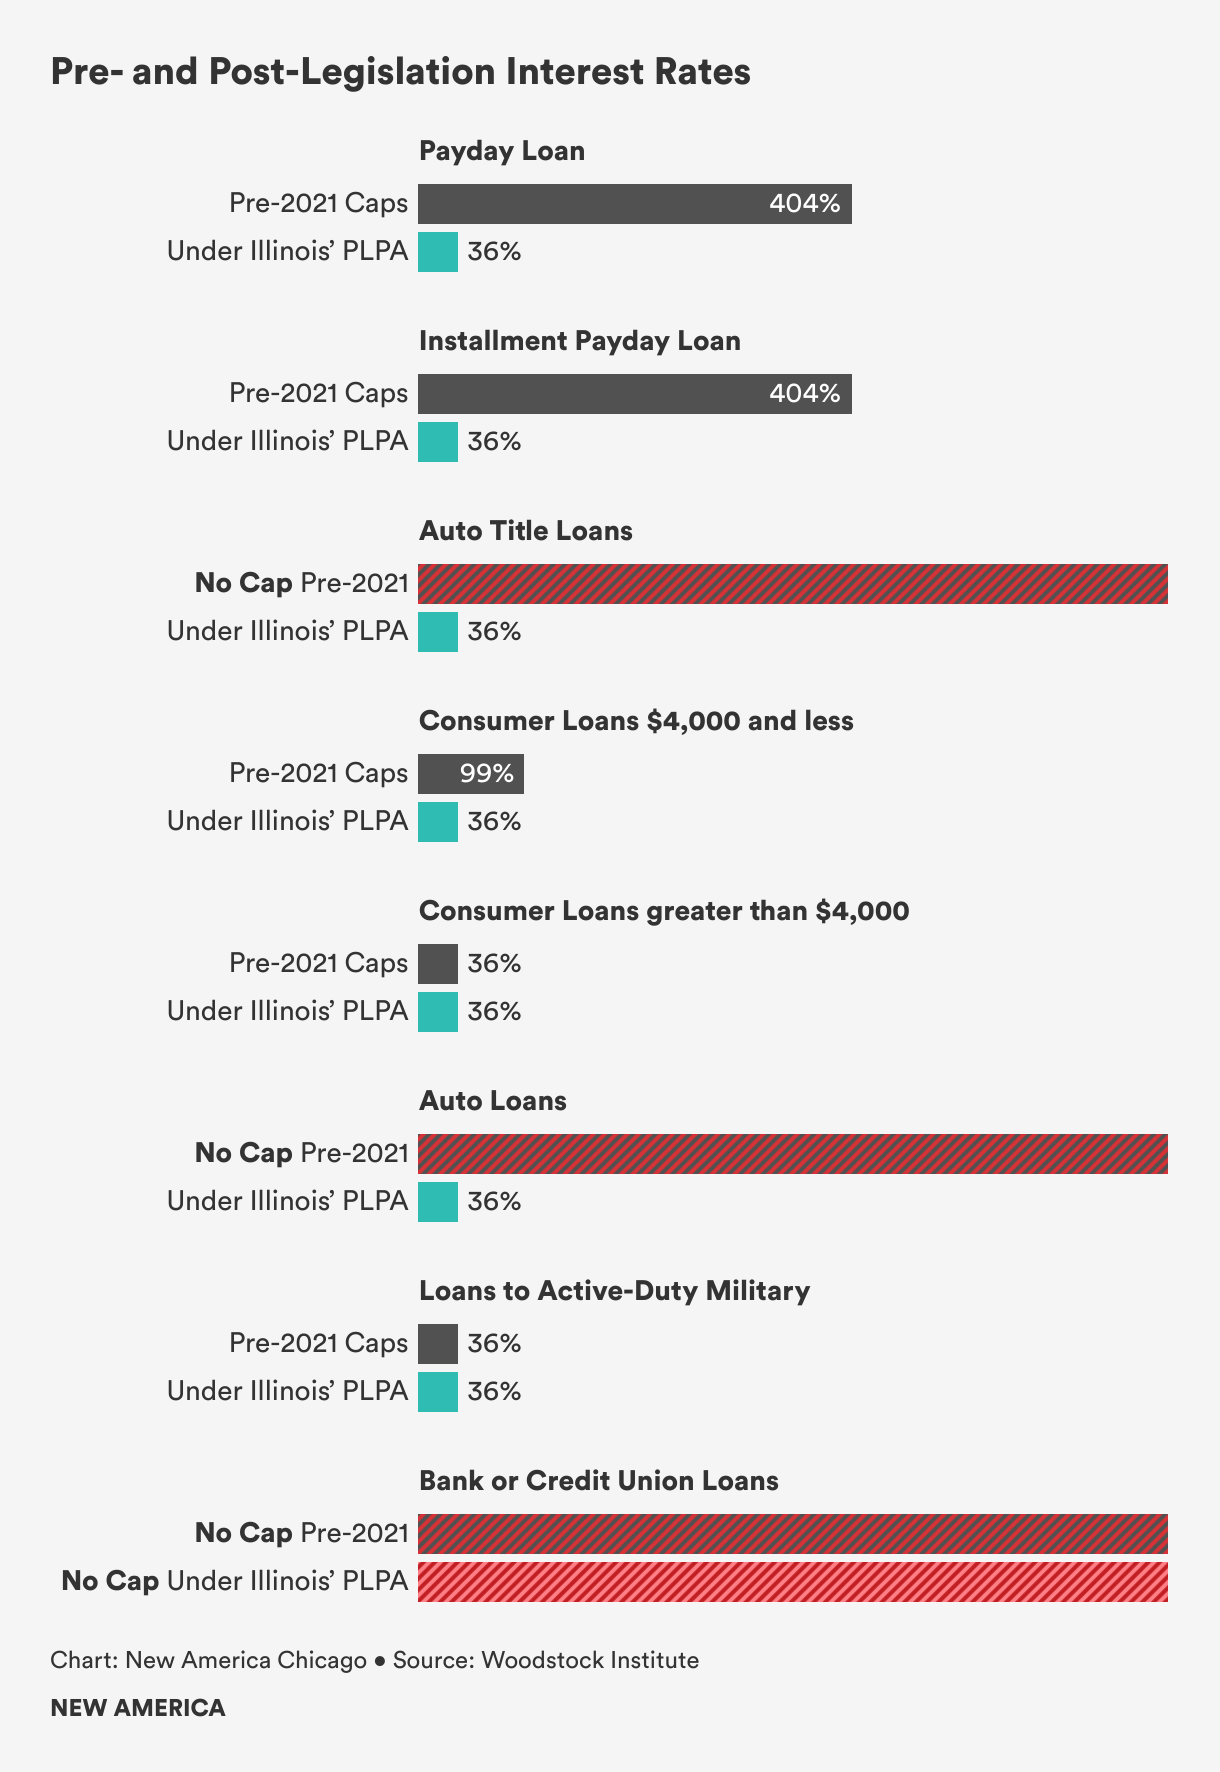
It’s important to note that auto title and auto purchase loans, which had no cap prior to the PLPA, are not included in these figures. This suggests that the financial hit to Black and Latino/a communities is much higher than realized. Over many years, the combined cost to communities represents billions of dollars in lost wealth.

Illinois Consumers Are Still Struggling to Pay Pre-PLPA Loans
In fall 2021, New America Chicago conducted interviews with borrowers from the Chicagoland area who have taken out short-term, high-interest loans within the last two years to better understand their experiences and how these loans have impacted their financial well-being. Interviewees who had taken loans out prior to the passage of PLPA were still struggling to pay them back. In particular, unclear terms as well as high fees and interest rates had jacked up the cost of the loans and made them difficult to pay off.
The interviews confirmed much of the current literature on consumer borrowers. Interviewers found that the participants all took out loans for commonly cited reasons, including lapses in income (e.g., laid off from work, money tied up somewhere else), planned expenses (e.g., bills, rent, the holiday season), and unexpected expenses (e.g., medical bills, car repairs). However, we also found that the pandemic unexpectedly impacted many people’s employment situations and exacerbated their need for money. Hours were cut at work, or they were laid off entirely, with no clear sign as to when they were going to return. Fortunately, many participants are currently in a better place financially and attributed that to the additional support provided in response to COVID-19 like the extended and enhanced unemployment insurance benefits, the expanded Child Tax Credit (CTC), and more. Small dollar lending in Illinois also dropped following the beginning of relief dollars to individuals. Lending dropped substantially in April through August of 2020 compared to the first three months of 2020.4
“I have been fully booked [for work] for 20 years, every summer for weddings. So I'm fully booked by January…So everything gets shut down in May and canceled. I just bought my house. We just put everything into it. OK? So my husband is a carpenter. It was horrible. It was scary and it was horrible.” – Tracy, former auto title loan borrower
One common factor amongst nearly all of the participants was time. People stressed how payday, auto title, and payday installment loans seemed to be the best option for getting small amounts of cash quickly. Those that were banked mentioned attempting or contemplating borrowing from their financial institution but that the process was too cumbersome for the amount they needed. On the other hand, high-cost lenders pride themselves on “quick cash,” so one could apply for one of these short-term, high-interest loans and receive funds as soon as the next day, if not the same day. Ironically, while getting the cash was especially quick, getting out of the ensuing cycle of debt was unexpectedly long.
Misaligned income and emergencies happen. However, a lack of accessible, fast lending options combined with predatory lenders’ robust marketing and easy-to-find products drive consumers to high-interest products, which unfortunately have been designed to fit this very niche. As inflation increases the costs of basic living essentials and relief funding comes to an end, access to cash is likely to become more of an issue over time for Chicago residents.
Citations
- Charron-Chenier, R. “Predatory Inclusion in Consumer Credit: Explaining Black and White Disparities in Payday Loan Use” Social Science Research, Vol. 35, No. 2, June 2020
- Data made available from the Illinois Department of Financial and Professional Regulations only included two types of loans, payday and installment payday. Several other types exist and also have historically had very high average interest rates and in some cases no caps on interest rates.
- Our analysis uses ZIP Code Tabulation Areas (ZCTAs) from the Census Bureau an approximation of ZIP codes from the USPS. We use the term ZIP code for readers who aren’t familiar with ZCTAs.
- Woodstock Institute analysis of 2020 data from the Illinois Department of Financial and Professional Regulation.