Table of Contents
Appendices
Appendix A: Methodology
Data for the analysis of patterns of predatory consumer lending came from three sources:
- The first data source was a list of all payday and installment payday loans made between January 2019 and December 2020. The Illinois Department of Financial and Professional Regulation (IDFPR) provided the data in response to requests Woodstock Institute made under the Freedom of Information Act. The data included the loan date, loan amount, and the ZIP code of the borrower. The initial data that IDFPR provided covered the period from January 2019 through August 2020. IDFPR later supplemented the data to include loans made through December 2020, although we were not able to complete analysis of 2020 data prior to writing this report.
- The second data source was the 2019 American Community Survey (ACS) 5-year estimates for ZIP Code Tabulation Areas (ZCTA) in Illinois. The data included counts of the population in each ZCTA broken down by whether the respondent identified as Hispanic/Latino, non-Hispanic Black, non-Hispanic White, and non-Hispanic of some other race. ZCTAs are the geographic area that the Census Bureau publishes as its approximation of ZIP code geographies, which the United States Postal Service defines. While the boundaries of ZCTAs do not align perfectly with those of ZIP codes, ZCTA data are commonly used as a proxy for ZIP code data.
- The third data source was the annual Illinois Trends Report: Select Consumer Loan Products, prepared for IDFPR annually by Veritec Solutions, LLC, for all years from 2012 to 2019, as well as the subsequent report for all years from 2012 to 2020. Those reports present summaries of payday loans, installment payday loans, and auto title loans, including the total number of loans, customers, and fees for each category of consumer loan.
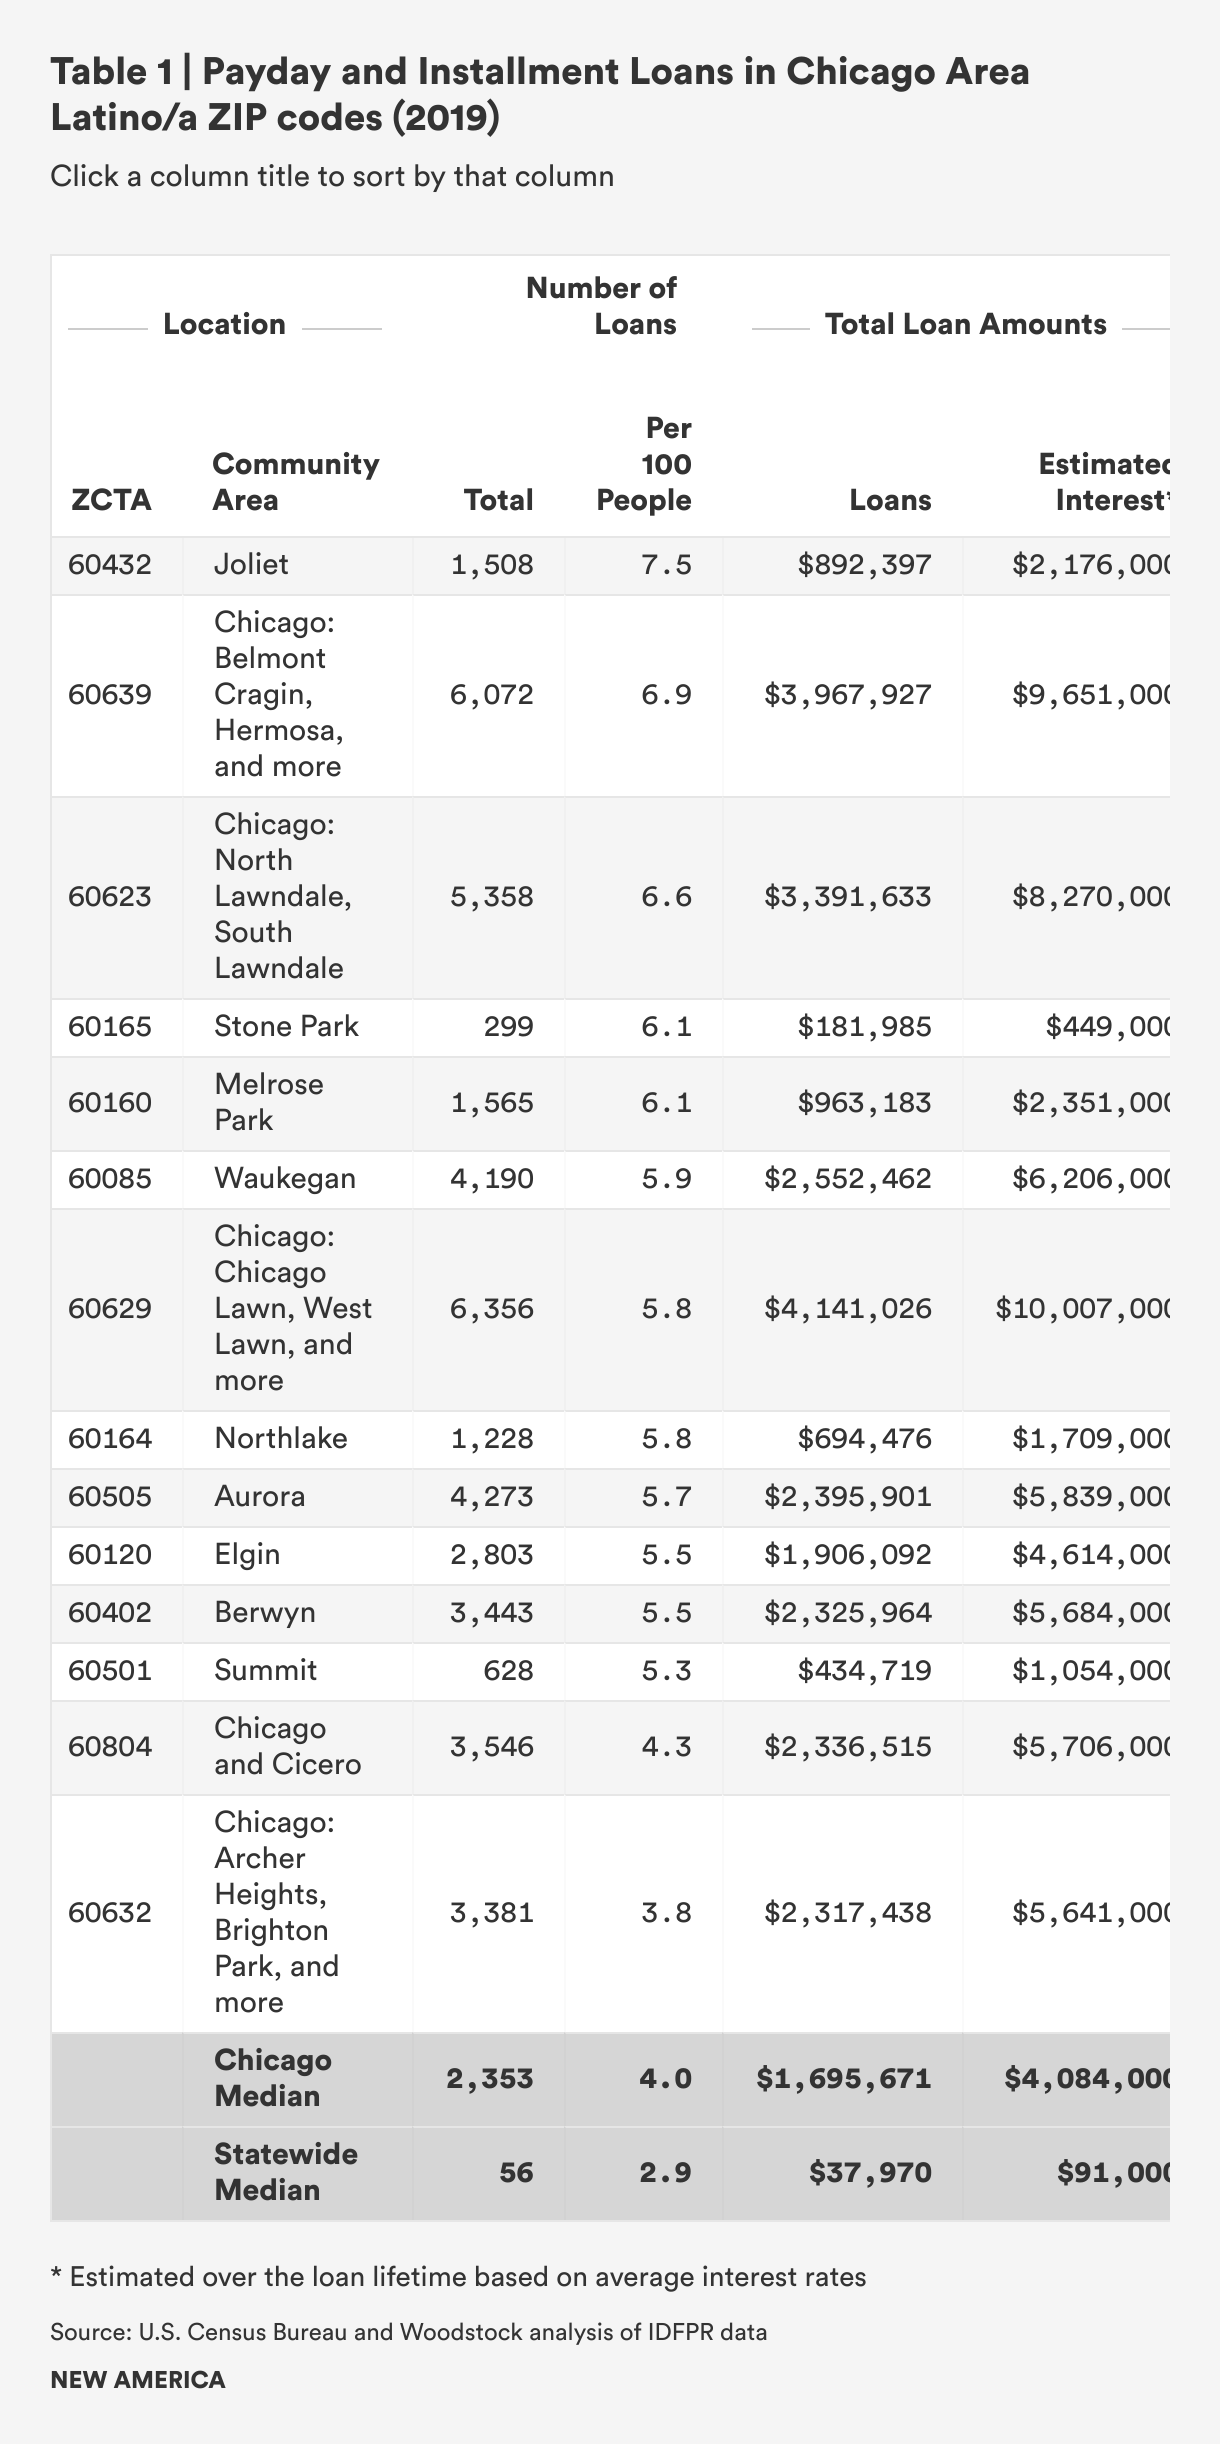
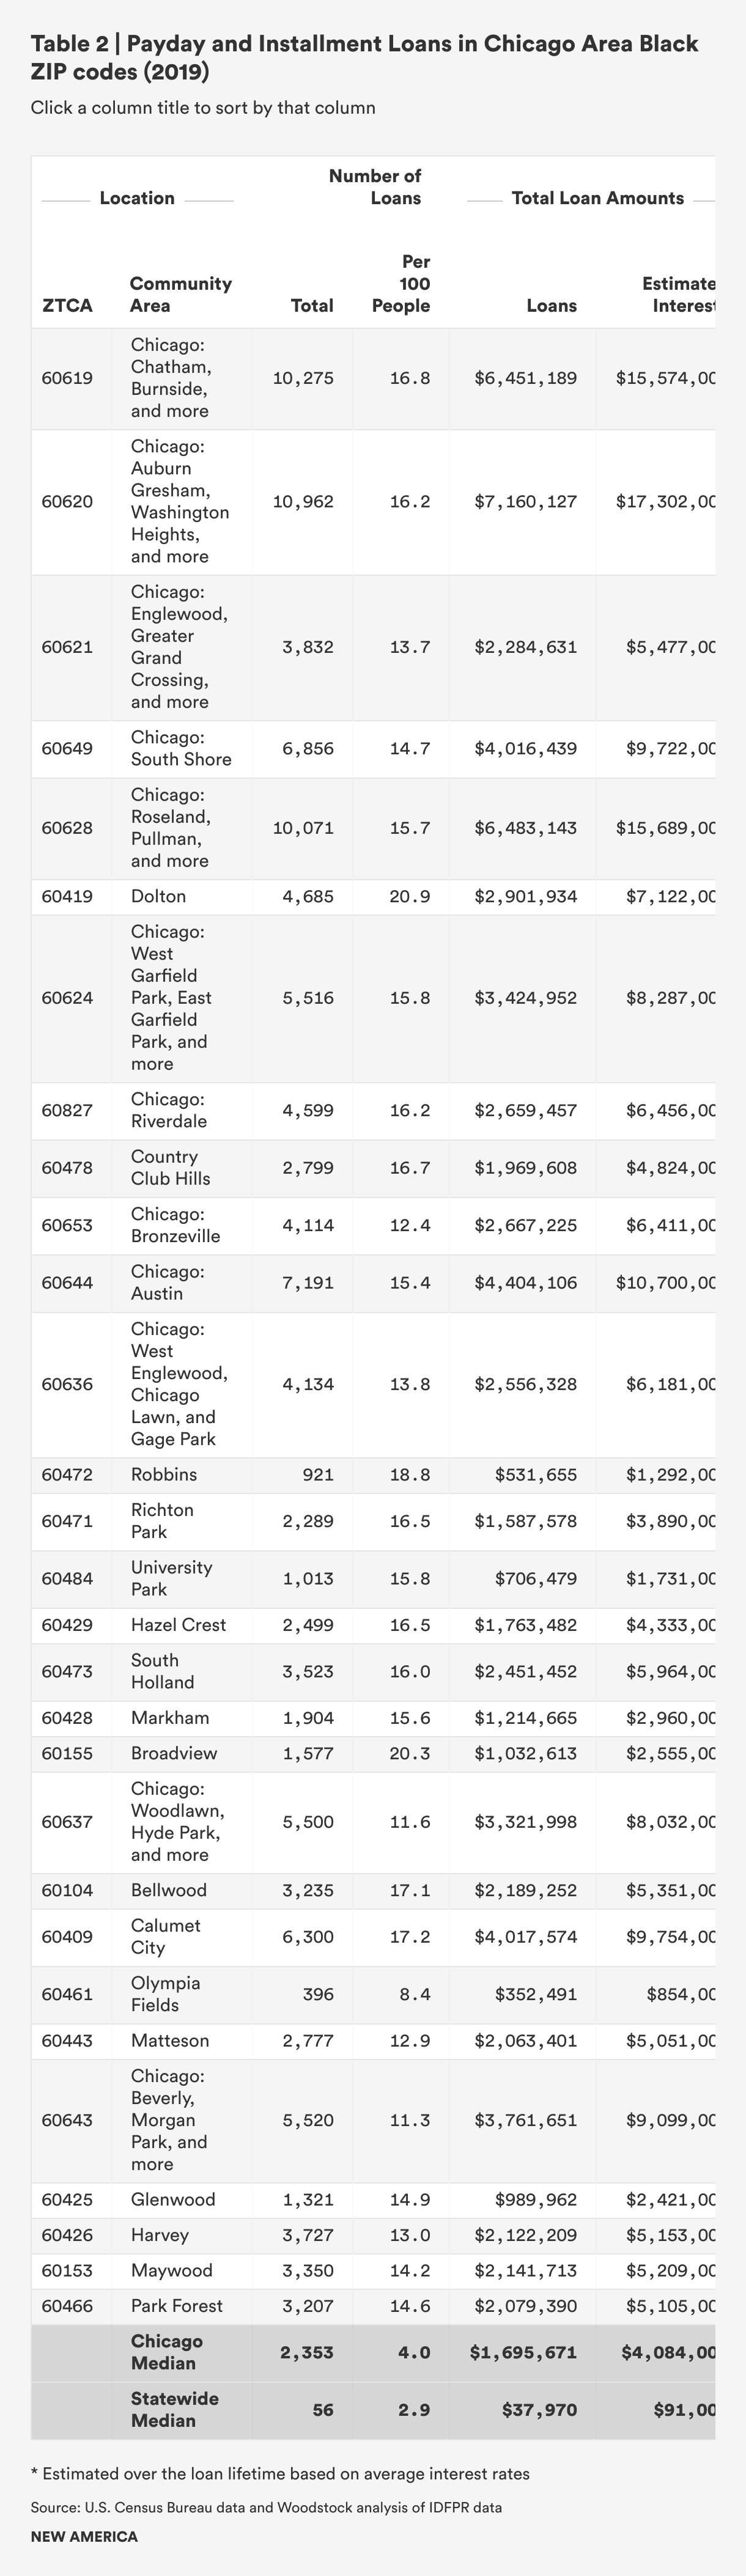
Analysis aggregated the payday and installment payday loan data for 2019 by ZIP code and linked those data with the ZCTA data on ethnicity/race. The linked dataset showed the correlations between, and the magnitude of, the disparities in the use of payday and installment payday loans and the ethnic or racial characteristics of the ZIP code in which the borrower lived. That analysis showed strong correlations between the racial or ethnic composition of the ZCTA and the number and amount per capita of payday and installment payday lending, with the highest levels in ZCTAs with the highest percentage of Black or Latino/a population.
For the purpose of this report, after much discussion the coalition agreed to use disaggregated Census data to do both ethnic and racial analysis. Unless otherwise stated, white refers to people who identified themselves as white, not Hispanic. Black refers to those who identified themselves as Black, not Hispanic. Latino/a numbers include anyone of any race who considers themselves ethnically Hispanic.
The next part of the analysis used data from the Trends Reports for the annual total number and amount of payday, installment payday, and auto title loans, and estimate the total fees charged in connection with each category of loan. The reported amount of fees in each successive Trends Report is an average amount based on the sum of fees charged for each category of loan from January, 2012, to the end of the reporting year (the “Reporting Period”). Estimating the average amount of fees per loan in 2019, therefore, meant determining how high the average fees per loan would have had to be in 2019 to raise the average from what it was in 2018. The average total fees for payday loans were $52.06 in 2019 and $51.24 in 2018. The product of the number of loans in the Reporting Period for 2019 times the average fees ($52.06) is the total fees paid between January 2012 and December 2019. The product of the number of loans in the Reporting Period for 2018 times the average fees ($51.24) is the total fees paid between January 2012 and December 2018. The difference between the total for 2019 and the total for 2018 is the amount of fees paid in 2019. That difference was $476.6 million in total fees for payday, installment payday, and auto title loans combined.
The third part of the analysis compared the number and amount of payday and installment payday loans, by ZIP code, for the period between January and March 2020 and the period from April through August 2020. That comparison showed the difference between the levels of payday and installment payday lending before and after the major impacts of COVID-19 began to affect the economy, and COVID relief programs began providing support to people adversely affected by the pandemic. The analysis showed a substantial decrease in the use of payday and installment payday loans in the period after the beginning of the pandemic.
Appendix B: Payday and Installment Loans and Interest In Majority Black and Latino/a ZIP Code Tabulation Areas
Click on the header of each column to sort by that column.