Table of Contents
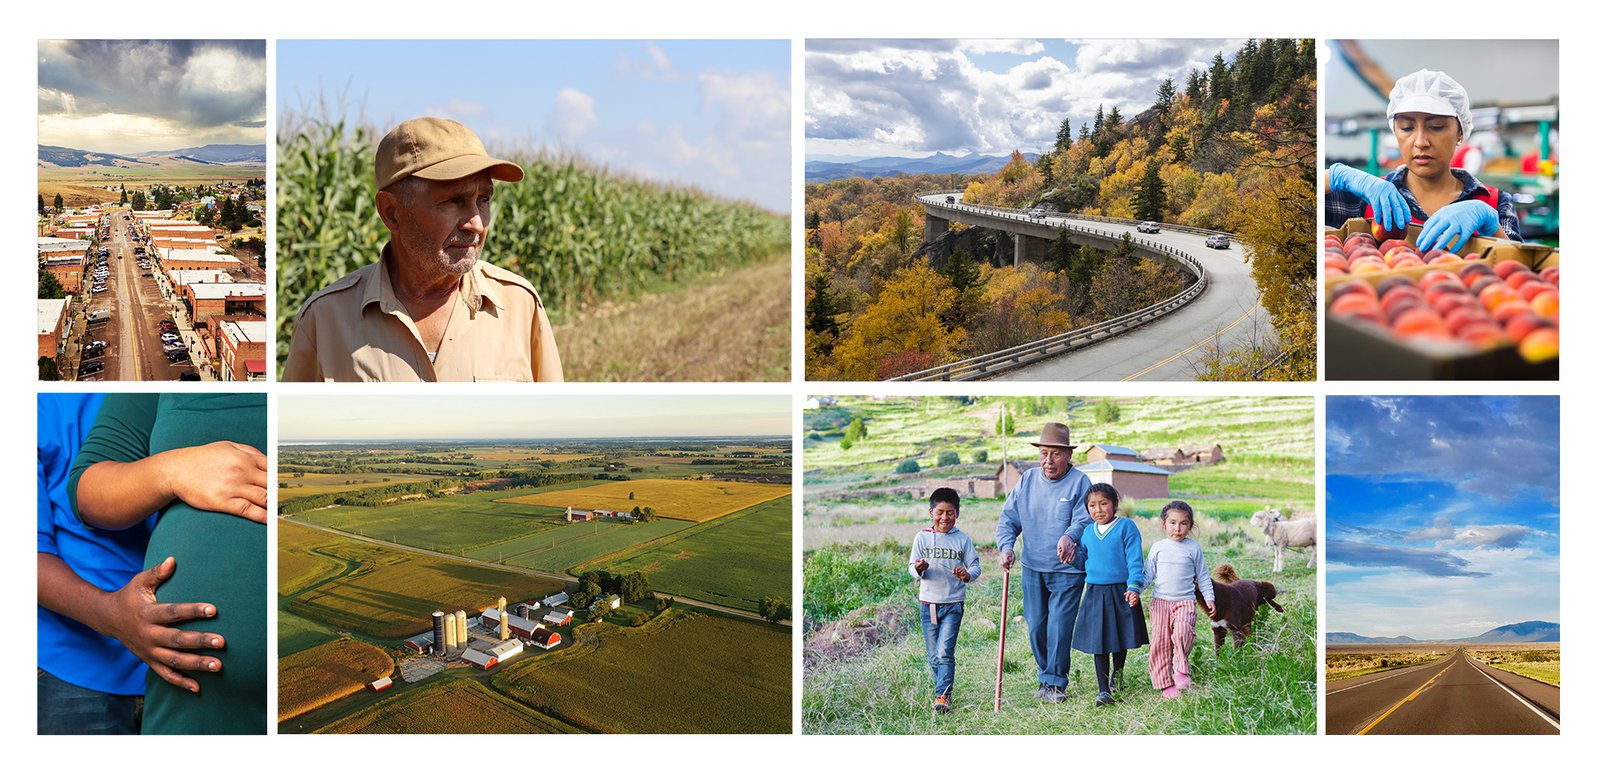
A Snapshot of America’s Rural Communities
This first section of the report puts into context the factors in rural communities that make paid family and medical leave and paid sick time uniquely important. Paid family and medical leave is defined as a period of weeks or months a worker may need to care for a new child, a seriously ill, injured or disabled loved one, or their own serious health issue. Paid sick time is defined as hours or days away from work to address a routine personal or family health need—most commonly to stay home with an uncomplicated but contagious cold or flu or to seek preventive health services. These are two policies among several, including child care, home- and community-based care, higher wages and better job quality for paid care workers, and flexible and predictable work schedules, that can help working people manage paid work and unpaid caregiving responsibilities.
The factors we discuss below: (A) the demographics of rural communities, (B) the job and industry composition or rural communities, (C) the health status of rural populations, and (D) caregiving needs in rural communities, all heighten the need for expanded access to paid leave and paid sick time. These policies help ensure that rural workers can provide or receive care and seek health services that they or a loved one need without jeopardizing their jobs or harming their household’s financial stability or longer-term economic security. The implications of access to paid leave go beyond individuals and their families. Better access to paid leave boosts labor force participation and reduces gender, racial, and economic inequities and contributes to overall community economic opportunity and well-being.
Due to data limitations, our analysis relies on varying definitions of “rural”—national government surveys may use the U.S. Census Bureau definition or the Office of Management and Budget definition; some random sample surveys use respondents’ self-reported residential location. Other researchers in their analyses of rural demographic, labor, health, and economic conditions use a similar array of definitions according to their data availability and research purpose. We acknowledge that, if we had the ability to use a consistent definition, the analyses could look different. The Methodology section at the end of the report provides more detail and resources for more information.
A. Demographics
Rural counties account for nearly 63 percent of all counties in the United States, but they house a minority of the U.S. population. An estimated 46 million people lived in 1,969 rural counties in 2020, but they comprised just 14 percent of the United States’ population.1 We note that census-tract based definitions of rural communities, rather than counties, yield a higher estimate of 62.2 million rural residents by pulling in some “metro fringe” areas—non-densely populated areas on the edge of metro areas—that look more like suburbs and benefit from urban economies.2

Our analysis tends to focus more on counties and uses the metropolitan/non-metropolitan distinction most often because of the sources available for analysis; when we deviate, we specify the definition we are using. We take solace in guidance from the Center on Rural Innovation (CORI) that, “When forced to choose these two definitions, we believe the nonmetro definition best describes places that share common characteristics, better represents the diversity of rural America, and reflects the critical social and economic dynamics of smaller economies that link open land areas and small towns.”3
Residents who identify their own location as rural are more likely than people in urban and suburban areas to report living in their community for an extended period of time (54 percent) and to live near the community where they grew up (42 percent); a full quarter (26 percent) report they have always lived in their community. Family is a main reason to stay or return.4 Rural communities are far less densely populated than non-rural areas, with about one-tenth the number of people in a typical rural county as in a typical metropolitan county.5
1. Population Changes—and an Aging Population—Over Time
Prior to the pandemic, the share of the U.S. population living in rural counties was declining (14 percent in 2016 versus 16 percent in 2000), with half having fewer residents in 2016 than in 2000, and population growth in urban and suburban counties is many times that of rural counties.6 From 2010 to 2020, migration decreased and the number of births only slightly exceeded the number of deaths.7 Increased remote work opportunities for white collar workers during the pandemic and other factors led to a spike in non-metropolitan population growth, but it remains to be seen whether this is a blip or will endure.8
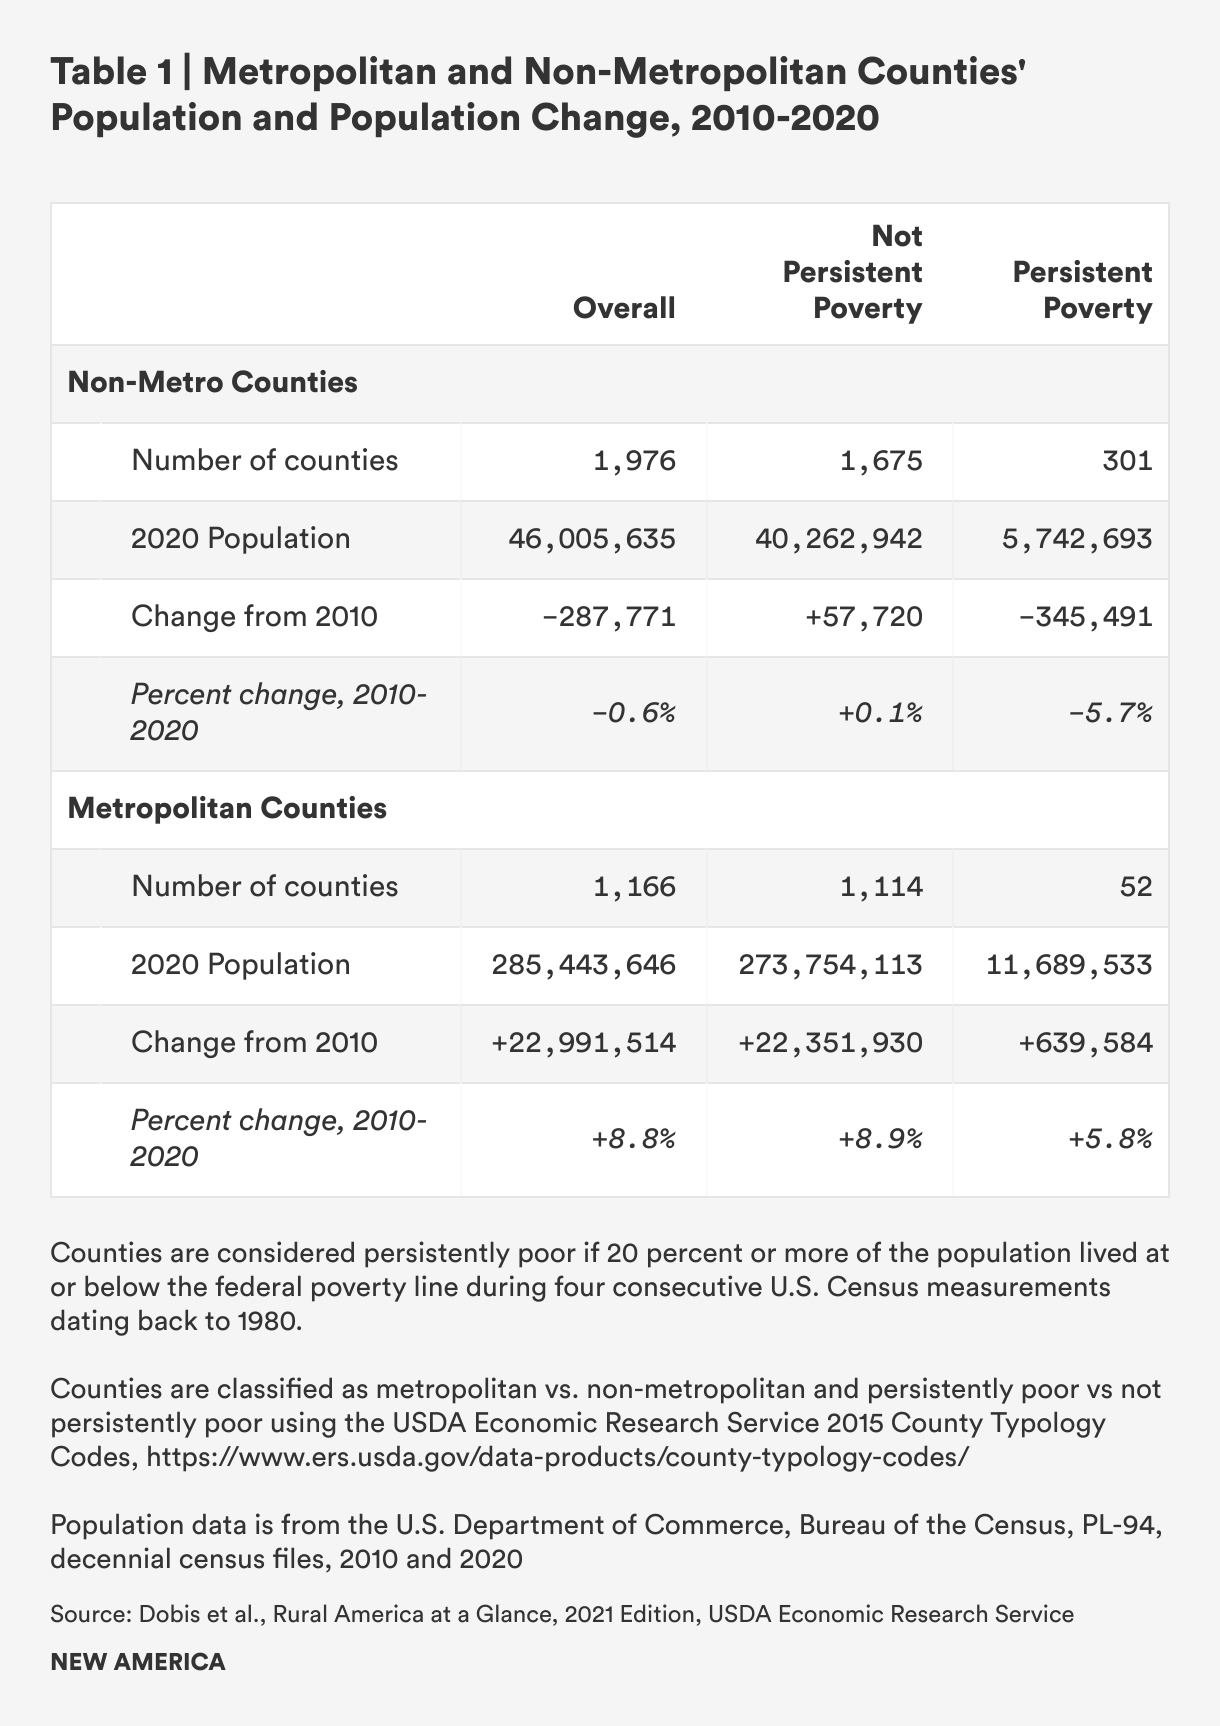
Areas of persistent poverty in rural communities—defined as a poverty rate of 20 percent or more in each of four or more consecutive U.S. Census Bureau measurements since 1980—have suffered sharp population losses, and this contrasts with population trends in non-persistently poor counties. Persistently poor rural counties lost population over the past 10 plus years (5.7 percent population decrease), whereas other rural counties have grown their populations slightly (.1 percent increase). However, both persistently poor and non-persistently poor rural counties lag in population growth relative to metropolitan counties, where both persistently poor and non-persistently poor counties saw population increases between 2010 and 2020 (5.8 percent and 8.9 percent, respectively).9
Rural population decline has implications for employers, the provision of health services to older, ill and disabled people, and the tax base needed to fund essential services and thriving, effective public institutions like schools and libraries.10 One of the main areas of focus for rural communities is attracting younger workers and families by creating good jobs—something that may be made easier by establishing baseline benefits through public policies.
Rural counties are not only losing population and lagging in population growth, they are also aging more rapidly than metro areas. Some rural areas have also attracted retirees. Overall, rural counties have a higher share of residents aged 65 and older relative to urban and suburban areas (18 percent compared to 13 percent and 15 percent, respectively)—and that share has grown since 2000.11 This has societal implications: An aging population requires more caregiving from family members or paid caregivers. The share of 35-to-64 year-olds in rural, urban, and suburban areas is constant (39 percent of the population in each), which means that the ratio of working age-to-older people in rural areas is lower than in urban and suburban areas. As a result, working-aged people in rural counties must care for a larger group of older adults than their urban and suburban counterparts.
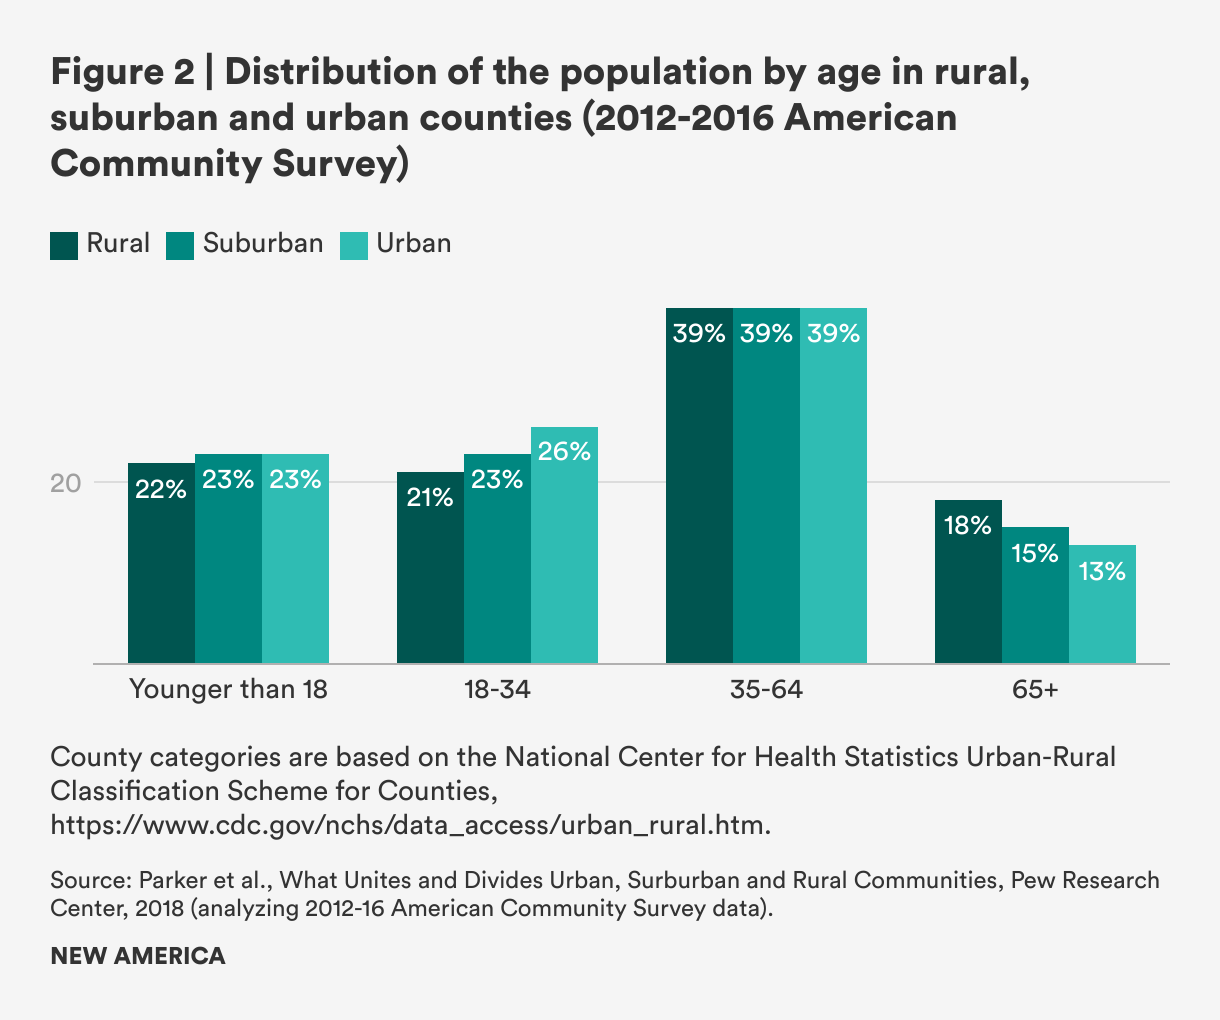
At the same time, the population of 18-to-34 year-olds is lower in rural counties than in urban and suburban areas (21 percent versus 26 percent and 23 percent, respectively)—which means a smaller number of births per capita in these counties simply due to a smaller population; this fact is potentially also exacerbated by greater difficulties accessing good jobs with living wages, child care, paid family and medical leave, and health care. The share of children under 18 in rural counties as a percentage of the total population is also slightly lower than in other areas—22 percent versus 23 percent.12 Between 2010 and 2020, the number of births only slightly exceeded the number of deaths, whereas in the prior decade, there were more than a million more births than deaths.13
Attracting younger people to rural communities and incentivizing births is an economic development and community-well-being strategy for the future—provided that supports and systems are in place to allow people to raise happy, healthy, cared-for children. Paid leave could be one of several policies and investments—including in housing, community services, and more—that helps attract workers and families to rural communities.
2. Race, Ethnicity, and Native Populations—and Poverty
The racial and ethnic composition of rural counties differ from urban and suburban areas. Whereas the white population is now a minority in urban counties and a declining share of suburban counties’ population, most rural counties have populations that are majority white, and the decline in the white population has been smaller in rural counties than in other areas. As of 2018, 79 percent of rural residents were white, 8 percent were Black, 8 percent were Hispanic or Latine, and smaller shares were Asian and Native American, but a higher share of the Native population lived in rural counties than in suburban or urban counties.14
As CORI explains, however, there is tremendous variation in racial and ethnic diversity within different types of rural communities—and portraying rural America as overwhelmingly white misses important nuances. Small towns—high-population areas within non-metropolitan areas that the U.S. Census Bureau’s definition of “rural” excludes but that the Office of Management and Budget’s definition includes and which are shrinking relative to other areas classified as rural (open lands and low-population-density areas on the fringe of metropolitan areas)—are more diverse than other rural places: CORI’s analysis shows that 10.7 percent of residents of small towns identify as Black and 13.1 percent identify as Hispanic or Latine.15
Rural counties are poorer than suburban and urban areas. In 2019, the rural poverty rate was 15.4 percent, compared to 11.9 percent in metro areas—and the gap is largest in the southern United States (19.7 percent in non-metro counties versus 13.8 percent in metro counties). Although metro and non-metro poverty rates declined from 2013 to 2019, non-metro rates declined less.16 Non-metro counties in the Mississippi Delta (which tend to be disproportionately populated by residents who are Black), in Appalachia, on Native American lands, as well as in the Southwest and the northern Midwest have the highest concentrations of poverty.17
Child poverty is also higher in non-metro areas: 21.1 percent compared to 16.1 percent, according to the USDA’s analysis of Census data from 2015-2019. Of the 138 counties in the United States with poverty rates of 40 percent or higher, 127 were in non-metro counties—disproportionately concentrated in the South (especially in counties with high concentrations of Black people), upper Midwest, and in South Dakota, where Native Americans make up the majority of the population.18
Poverty in rural America is also more entrenched than in metropolitan areas. About 12.5 percent of rural residents live in counties with persistent poverty compared to just 4.1 percent of residents in metropolitan counties.19 Race, ethnicity, poverty, and opportunity intersect dramatically: Black, Latine, Native and Asian rural residents are concentrated geographically and more likely to live in areas with persistent poverty, exacerbating the overlapping work, health, and care challenges they face.
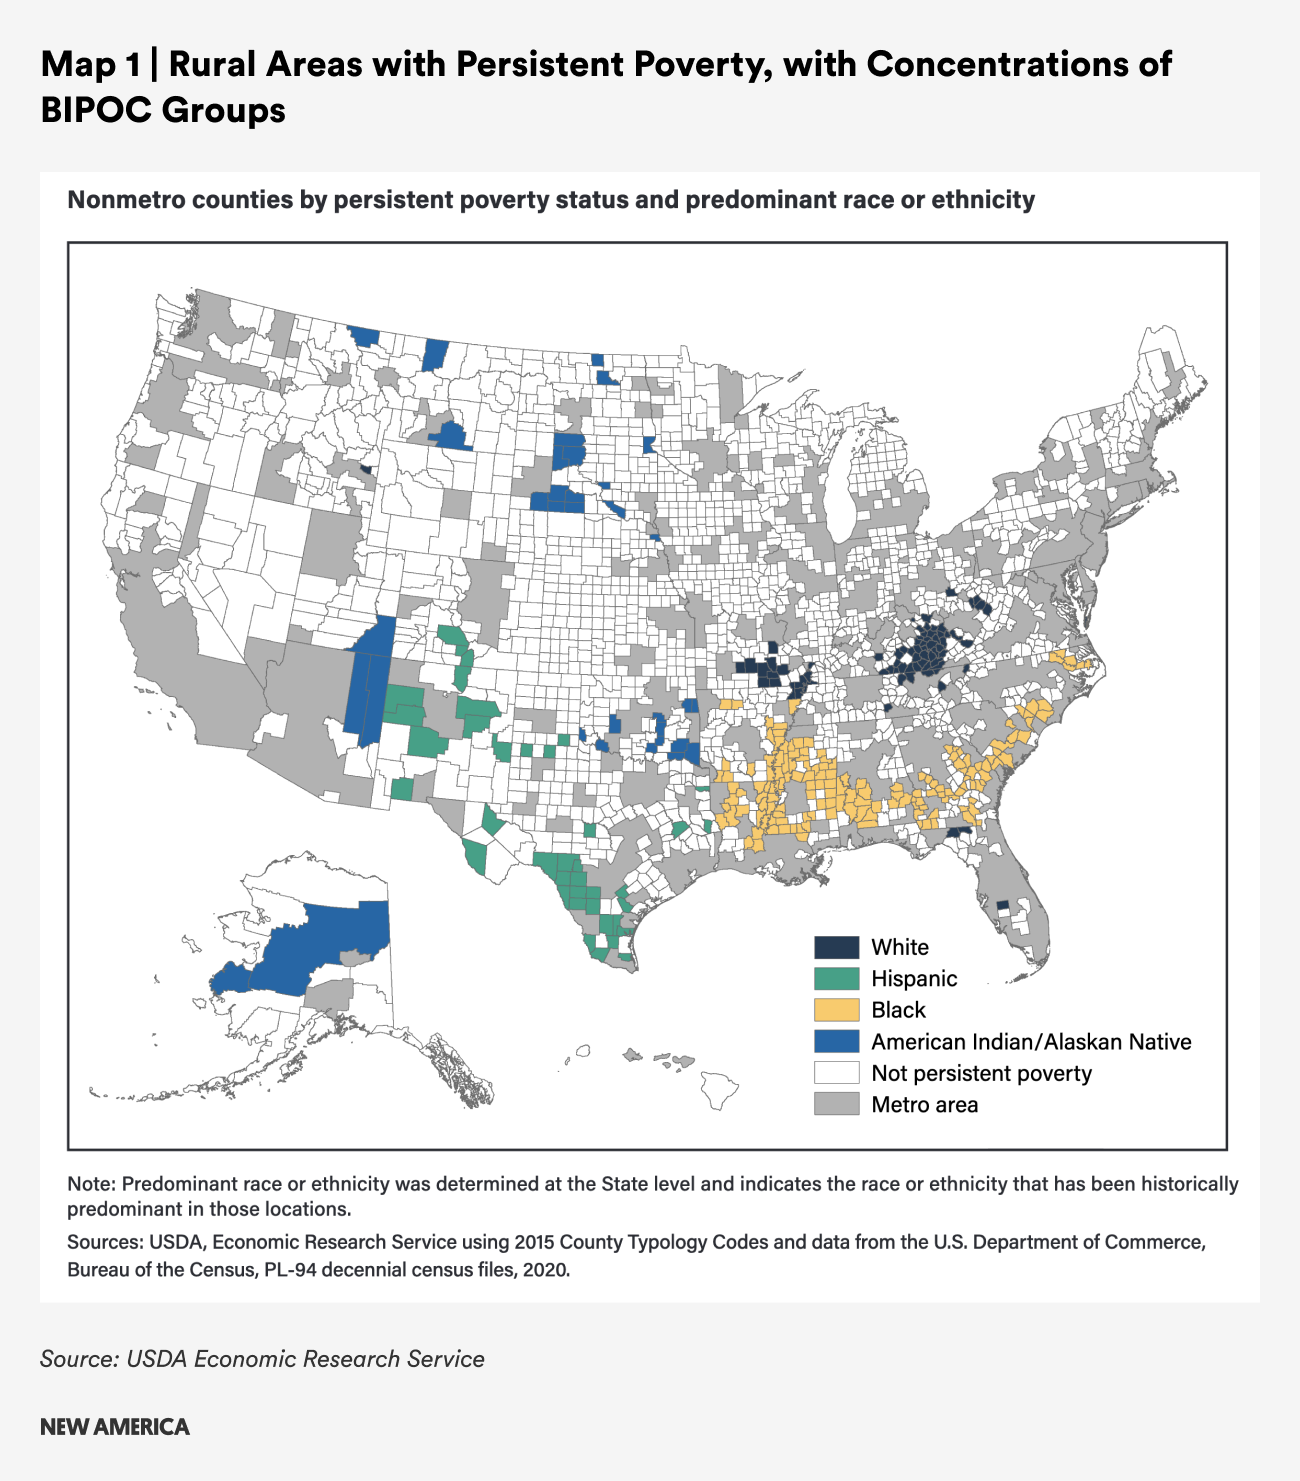
White people are under-represented in rural counties that are persistently poor, making up just 53 percent of the population in these counties (compared to 79 percent of the population in counties that are not persistently poor). Black people make up 25 percent of the population in persistently poor counties but they are just 5 percent of the population in rural counties that are not persistently poor; the share of Latine and Native American residents is also substantially higher in persistently poor versus non-persistently poor counties.20 Concentrations of Black people in persistent poverty rural counties tend to be in the Southeast; Latine concentrations are in the Southwest; Native populations are in the Southwest and the Plains and Midwest; and Asian persistent poverty is concentrated in the Southeast, especially in Georgia.21
Implications of Travel Distances on Family Economic Security When the Need for Sick Time or Family or Medical Leave Arises
For all workers in rural communities, travel for specialized health care services is burdensome, and inadequate paid time off for treatments is an additional barrier. Among states with more than 20 percent of the population living in rural areas, none guarantees workers access to paid family and medical leave and only two (Vermont and New Mexico) guarantee access to paid sick time.22

The stress of managing work and treatment when long travel distances are involved takes a toll. One study that focuses on female cancer survivors in rural Illinois revealed the intersecting challenges posed by work and distances to care and treatment.23 Women in higher-quality jobs with access to paid time off and flexibility to work from home were better able to continue working through treatment and beyond. For example, Paula, an accountant explained the commute she had to treatment. She was working at the time she spoke with a researcher, and credited her continued employment to her employer’s willingness to accommodate her need for paid time off and flexibility—but the travel still took a toll:
During the radiation treatments, I would leave [my house], drive to work, drive to [nearby city] [for radiation], and drive home. And that was like an 85-mile round trip every day for seven weeks. So, it really wore me out. — Paula, Accountant, White, Age 67, Breast Cancer Survivor
Two other cancer survivors who were able to continue working had a similar experience with a very long commute on top of work and treatment. Yet, thanks to paid leave and employer flexibility, they were able to retain their jobs throughout—creating stability for their households.
I would drive thirty-five miles to my work. I would work for like six or seven hours and then I would go forty miles to my radiation. Then thirty-five miles back home. It was like in a big triangle. That's a lot of driving. — Marie, Nurse, White, Age 62, Breast Cancer Survivor
I had 30 sessions of radiology. And I went over there every afternoon. I would work during that period. I would come in every morning, and I think I left at 12:30 or something, because my appointments were always at 2pm. That's how they set it up. Same time, every day. So, I did that for 30 sessions, which took a period of a month and a half. So, I did that Monday through Friday. My husband was able to take me for a good portion of my appointments. I did drive at the end the last couple weeks…I probably had to go over there 10 times for injectable chemo. From my house, it's probably 50 miles. Because, on the interstate from here to St. Louis, it's 45 miles. — Misty, Health Department, White, 41, Brain Cancer Survivor
Having caregivers available to help with driving and support is also important but can be challenging, especially for patients who are disabled as a result of their cancer and cannot drive themselves.
My sister would basically just be like transportation every time we had to go to Chicago or that area [for treatment]. She would take me places I needed to go, but she also had a job at the time too. So she would take off some work that she was allowed to take off, but she couldn't take off too much. — Cynthia, Disabled on SSDI due to osteoporosis from cancer treatment, White, Age 61, Reproductive Cancer System Survivor
The challenges are even greater for workers whose work is physically demanding and those who are paid low wages and in families with low incomes. For example, among the Illinois cancer survivors, a cafeteria lunch room worker, a crane operator, and a taxi driver all faced challenges maintaining work after cancer treatments because of the work’s physical demands; several others faced discrimination when seeking jobs with prospective employers; others noted that the job market in their rural area was just too limited to make finding new work possible.
Among the 610 counties in 40 states plus Puerto Rico with poverty rates at 20 percent or above in 2020, only 40 counties are covered by state protections providing access to paid leave or paid sick time, which exacerbates employment and health challenges.24 Only Washington state, New York, Colorado and California have paid family and medical leave programs and paid sick days guarantees; Arizona, Maryland and New Mexico have paid sick day laws.25 No other state with a high-poverty county requires employers to provide workers with paid sick days or has established a statewide paid family and medical leave program that provides paid leave to new parents, family caregivers or workers with their own serious health condition. In addition, people who live in poverty and are employed most often work in low-wage jobs that do not offer paid leave—as we discuss more in the next section. Employed people in rural counties with high poverty may be especially likely to risk their jobs or their income when they need time to seek or provide care, and unemployed people may have lost or left jobs as a result of care needs.
The consequences of going without pay are significant: Even a few days of work without pay means people making tough choices about buying food or gas, housing, utility costs and more. Nationally, in 2017, for workers who were paid low wages, lost wages from two unpaid days away from work was roughly equivalent to a month’s worth of gas. Three unpaid days away from work accounted for a family’s entire monthly grocery budget or a household’s monthly utilities.26 The cost of missed wages in terms of affording basic expenses is likely to be even greater now since wages have not kept up with inflation for lower-wage households.27 In rural counties, the costs may be greater and the hardship even more severe because of longer travel distances to work and higher costs of gas, food and utilities, especially in a time of rising prices.28
Similarly, the need for a longer leave for family or medical needs exacts a high price. Nationally, among families who are not in economic hardship before the need for a longer, six-week family or medical leave, 18 percent—including 26 percent of Hispanic and Black families and 25 percent of Native families—are estimated to fall below 200 percent of the poverty line.29 For those already in economic hardship—which people in rural counties are more likely to be—the effects of an unpaid leave on families’ financial security and well-being can be even greater. People who do not have paid leave and people who are low-income are more likely to forgo a family or medical leave they need and are more likely to suffer other forms of economic hardship—the inability to pay bills, the need to borrow from savings or to borrow from friends or family—and to use public assistance programs.30
B. Jobs, Wages, and Work
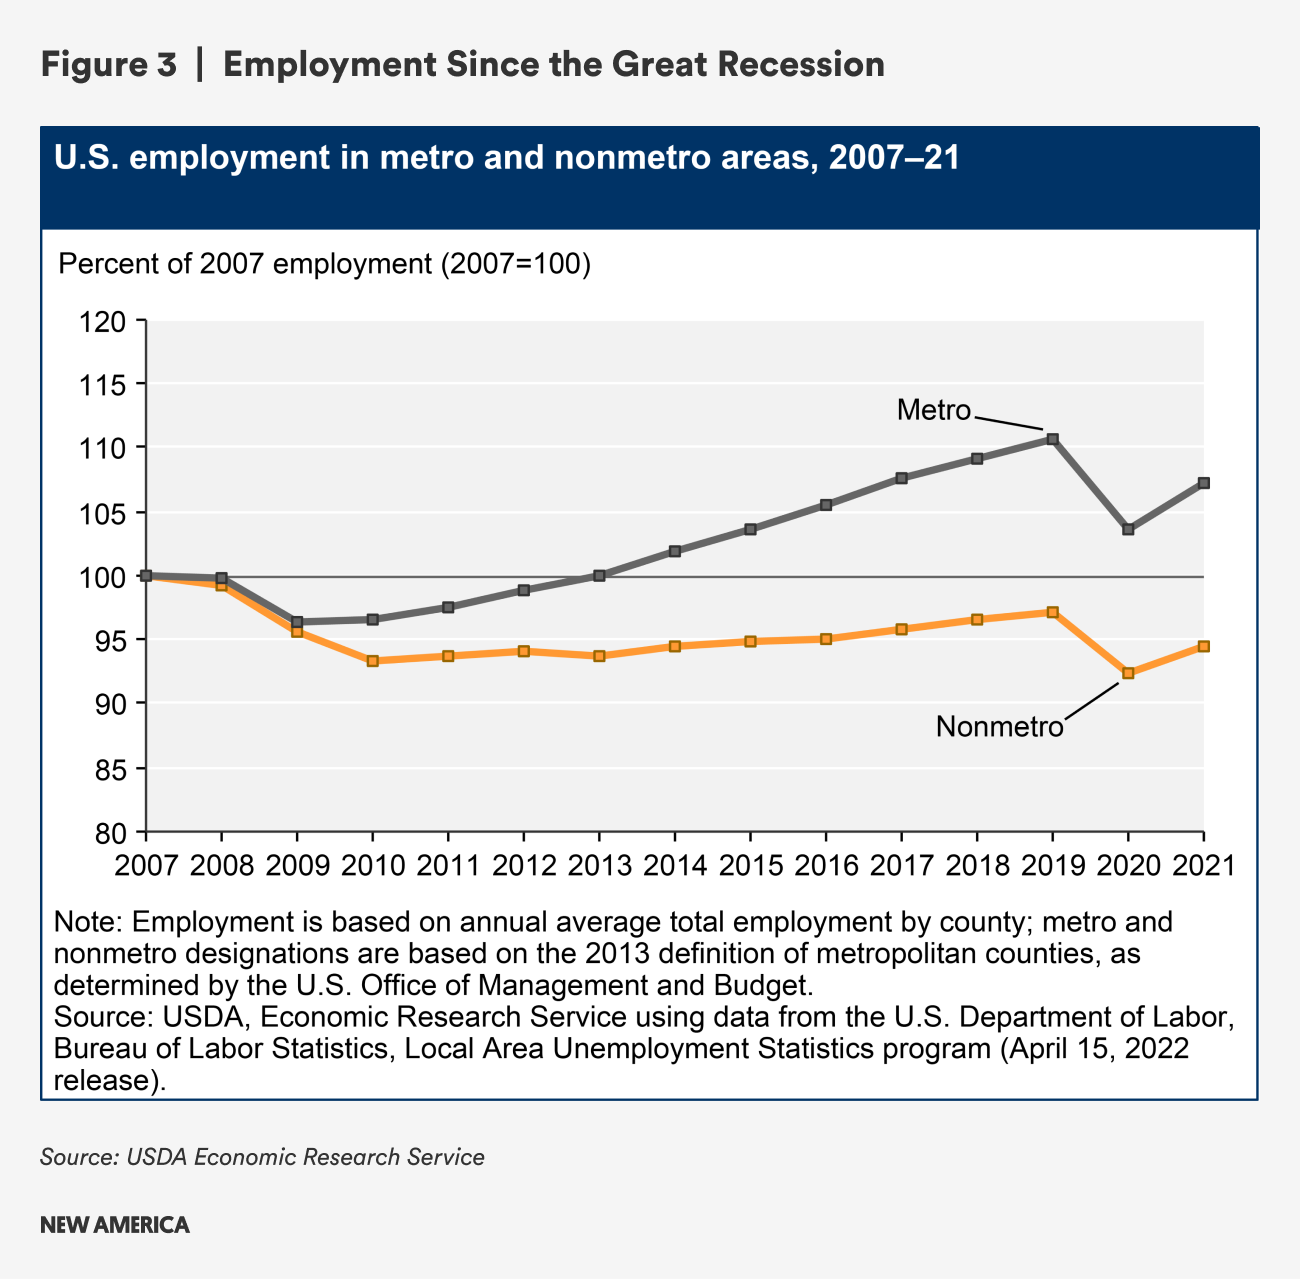
Jobs, wages, and work are central to thriving economies and vibrant communities. After the Great Recession in the late 2000s caused historic job losses, employment in rural areas did not rebound as quickly as in metropolitan counties.
One analysis from 2015 showed that the average number of jobs available to the typical resident of a rural community is 52 times smaller than in the largest metro areas.31
By 2017, while metropolitan areas exceeded their pre-2007 employment rates, rural counties had only recovered about 95 percent of theirs; labor force participation rates in rural counties dropped by about 6 percent over that same time period, while labor force participation rates in metropolitan counties rebounded and exceeded pre-2007 levels.32 One study found that, among people of “prime working age” (25-54) in rural counties, just 71 percent were employed, compared to 77 percent in urban and suburban counties, as of 2016.33
The COVID-19 pandemic substantially affected employment in rural communities in the United States. While initial evidence showed that rural employment recovered from the effects of the COVID-19 pandemic more quickly and resiliently than metropolitan areas,34 more recent data tells a different story: Nearly six-in-ten rural counties (58.4 percent) had fewer jobs in July 2022 than three years before. Overall, rural counties had 210,000 fewer jobs than before the pandemic, and rural counties are adding jobs back at half the rate of metropolitan areas.35
“… The average number of jobs available to the typical resident of a rural community is 52 times smaller than in the largest metro areas.”
Wages are also lower in rural areas than in urban and suburban counties. In 2016, rural workers were paid just $35,171, while urban workers were paid an average of $49,515 annually and suburban workers were paid just over $46,000—though the cost of living in rural areas is also different across these areas—higher for some expenses and lower for others.36
The rural employment story differs by region. Counties and areas with access to natural resources, both for recreation and tourism and for harvesting and trade have fared better over the last two decades (and in pandemic recovery), as have those that are centers for innovation in agriculture and particular types of manufacturing.37 Unemployment in these areas tends to be lower, job growth has been more swift, and wages are growing faster.38
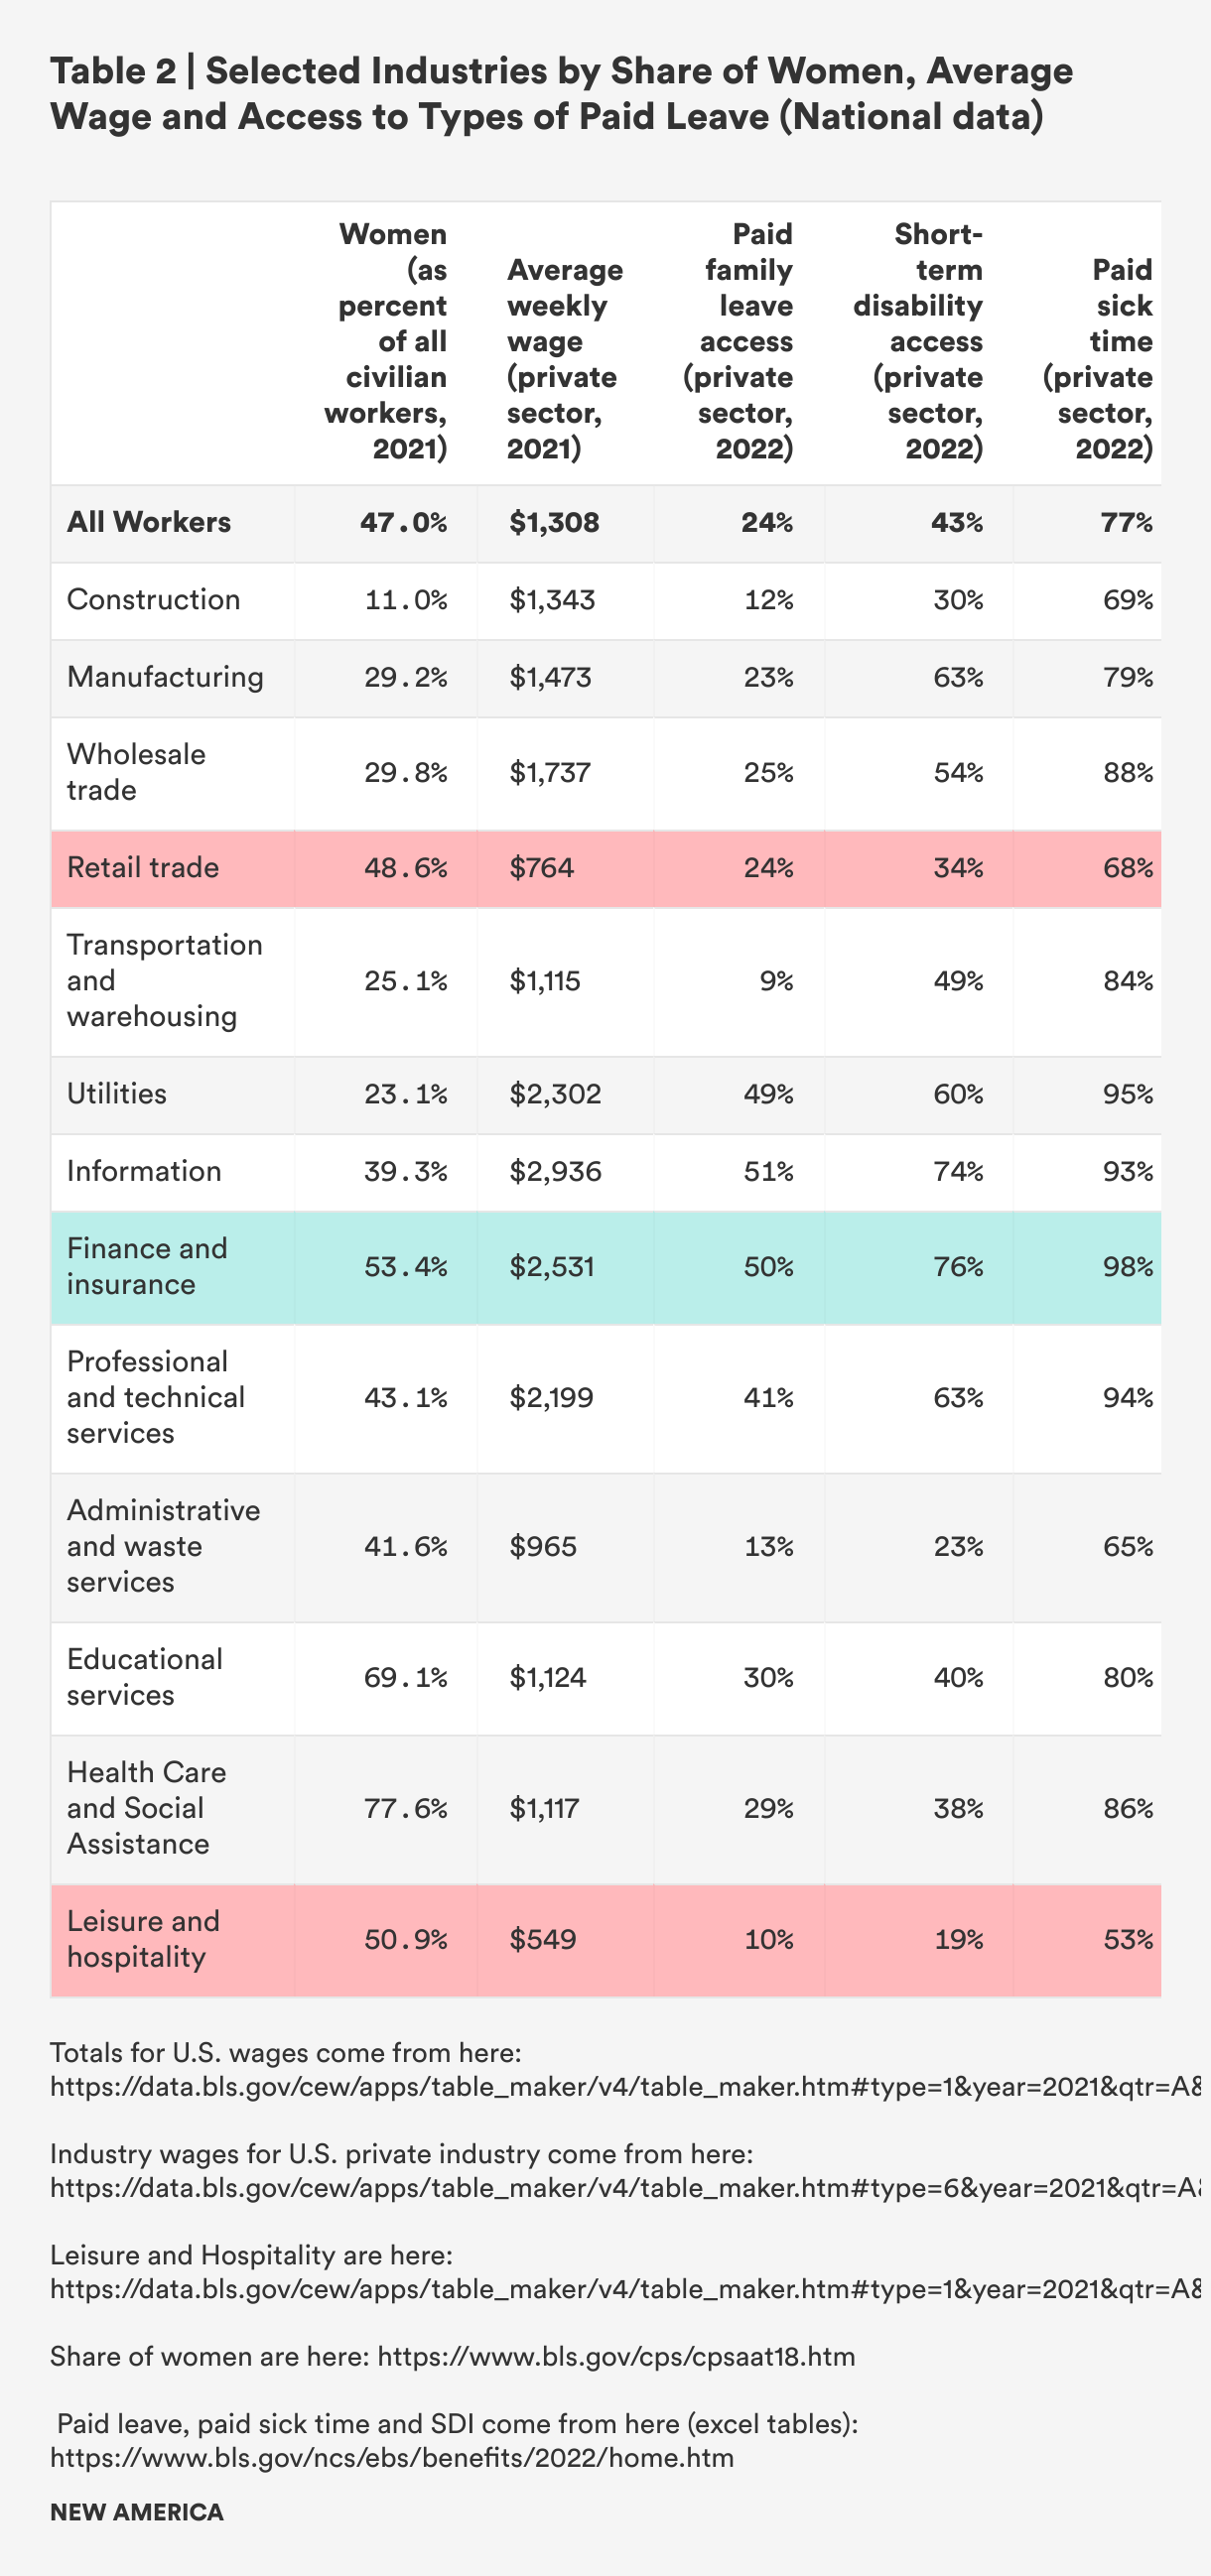
However, as of 2015, a plurality of employment in the 704 counties that are entirely rural was focused on human services—health care, education and social assistance (22.3 percent)—as well as retail trade (10.9 percent) and leisure and hospitality (arts, entertainment, recreation, accommodation and food services) (7.3 percent). Another segment with high shares of employment were manufacturing (12.1 percent), agriculture (9.6 percent) and construction (8.4 percent). Just 4.3 percent of rural employment was focused on finance and insurance, 2.3 percent on wholesale trade and 1.3 percent in information.39 A similar industry distribution was true for all non-metropolitan counties as of 2019.40
Notably, with implications for health and caregiving, overall in the United States, jobs in human services, retail, and leisure tend to be held by women, tend to pay lower-than-average wages, and tend to be less likely to offer benefits like paid leave, short-term disability insurance, or paid sick time. Among higher wage industries with better benefits, women tend to be a minority of workers—finance and insurance is the one exception.41 (See Table 2.)
There is perhaps no greater illustration of the differing experiences of workers in rural America than the influx of knowledge workers who telecommuted to their jobs during the pandemic in relative safety juxtaposed against the disproportionate share of in-person, Black and Latine workers in schools, on farms and in factories, who suffered higher rates of COVID-19 and faced higher rates of death.42
On-Site Work, Lack of Paid Leave = Death
In 2021, Jacqueline Lowery, a 28-year old teacher and mother, died of COVID-19. Her cousin told the New York Times, “She had not yet tested positive for the virus, and she needed to before she could qualify for Covid pay from her employer. In the meantime, she was using up valuable sick days … She was the sole provider, and she had to pay bills, and she wasn’t going to get paid because she’d missed a solid week of school … They kept telling her she needed proof of positive Covid status.”43
The ability to find and maintain good employment is a concern to rural residents. More than four in 10 rural residents (42 percent), including 53 percent of non-white rural residents, identified the availability of jobs as an area of major concern for them in 2018—a far higher share than urban or rural residents overall (34 percent and 22 percent, respectively) and urban residents by race. And rural residents were less optimistic than suburban and urban residents about the availability of jobs improving over the next 10 years.44 When people are concerned about being able to find jobs, they tend to focus less on the quality of the jobs that are available—and that means employers can pay low wages and offer few benefits. This harms workers’ health and community well-being in the long run.
More specifically, there may be some connection between poorer rural health, discussed below, the limited job market and employment rates. A large study of workers in Vermont found that rural workers were more likely to retire early after a cancer diagnosis; one hypothesis is that the prevalence of physically demanding work creates fewer return-to-work opportunities, as a larger share of rural residents than urban residents work in agriculture, forestry, fishing, mining, and construction.45
A second qualitative study of women cancer survivors in rural Illinois identified the limited rural job market as a barrier to employment after cancer treatment. Cancer survivors who left work—most of whom had insecure employment prior to their cancer diagnosis and treatment—cited as barriers to rejoining the workforce the lack of job opportunities in their local area, limited remote work opportunities, and the dominance of physically taxing manufacturing and service jobs with few protections, which cancer survivors could not physically do without harming themselves or further compromising their health.46 Notably, none of these industries are likely to provide paid leave as a workplace benefit.47
All of this underscores the importance of paid leave provided to everyone, regardless of their job or their employer. Rural economic development requires focusing on creating good jobs across a range of sectors and investing in policies to support a healthy workforce. Boosting rural labor force participation rates is an important goal for rural economic and community development. Access to higher wages, workplace benefits, and the ability to manage work and family demands can help boost labor force participation rates.
Both nonprofit organizations and for-profit management consultants are aligning around solutions that require greater government and private sector investments in creating livable communities and higher-quality workplace practices.48 The health care sector has been an important focal point of conversations about equitable and inclusive economic development, and has potential to marry conversations about health, work and care.49
C. Health
The health of rural populations, especially those in persistently poor counties and among people of color, is concerning and heightens the need for access to workplace leave for both workers and caregivers. Prior to the COVID-19 pandemic, 81 percent of persistently poor counties were in the bottom quartile of U.S. counties in terms of health outcomes, and—as noted above—these counties are disproportionately located in rural areas.50 The spread of COVID-19 in rural counties, where Black, Latine, and Native residents comprised a disproportionate share of deaths, was exacerbated by factors that affect rural population health overall, including more in-person work in industries with high rates of transmission, less access to and awareness of vaccines, further distances to health care, and more.51
The health of people in rural communities is affected by the social determinants of health, including higher poverty rates and lower incomes, lesser job quality, and lesser access to health care services.52 The prevalence of unhealthy behaviors like smoking and lack of aerobic exercise (likely due to lack of walkability in many rural communities) is higher in rural areas than in metro areas. Lower rates of privately provided health insurance and higher average ages are also among the drivers of health disparities and overall poorer rural population health.53
For nearly two decades, the distance to health care services has been identified as a barrier to preventive care and treatment for people in rural communities.54 The closure of rural hospitals and reduced accessibility to health care providers between 2012 and 2018 mean that rural people must travel even longer distances to receive health care evaluations, treatments, and care.55 Researchers at the North Carolina Rural Health Research Program examined closures over time and found that rural counties with hospital closures in the past decade were more likely to border metro areas and have higher shares of Black and Latine residents, and that—overall—counties with hospital closures have higher levels of income inequality, lower per capita income, and higher unemployment compared to the median rural county, and that they tend to be in the South.56 Closures are likely affecting residents’ perceptions and experiences: Two-thirds of rural residents identified access to good doctors and hospitals as a major or minor problem in 2018, whereas the opposite was true elsewhere: 64 percent of suburban residents said access to good doctors and hospitals was not a concern.57 Distances to health care and reduced access to health care services, which contribute to lower rates of preventive care and screenings, mean missed opportunities for early interventions that could eliminate or ameliorate more serious health problems in the future.
“Two-thirds of rural residents identified access to good doctors and hospitals as a major or minor problem in 2018.”
As a result of the myriad factors that affect rural health, deaths from serious conditions are higher in rural counties. Heart disease, cancer, respiratory disease, and stroke are more prevalent and death rates are higher in rural communities.58 One study found that, after hospitalization, Medicare patients in rural areas are more likely to die within 30 and 90 days than residents of urban areas, less likely to receive home health services in their community post-discharge, and less likely to be readmitted to the hospital. The study authors hypothesize that these poorer outcomes may be related to travel distances for home health aides and from rural communities to hospitals when readmission might otherwise be advisable.59 Rural counties also see more deaths that are considered preventable for each of these common conditions because they occur at a younger age than would normally be expected.60

“Heart disease, cancer, respiratory disease, and stroke are more prevalent and death rates are higher in rural communities.”
Rural health outcomes related to pregnancy and childbirth are also poor relative to urban areas—and the implications of this are likely to become even more dire in the wake of newly restricted access to reproductive health care, including contraception and abortion care services. At least half of rural areas do not have hospital-based obstetrics services, and 2.4 million women of reproductive age live in these counties. These counties, which are disproportionately more rural and geographically isolated than counties that have obstetrics services, also have fewer family physicians per capita than other rural counties and urban areas. Difficulty accessing obstetrics care is most acute in rural counties with higher percentages of non-Hispanic Black women, lower median income, and less access to publicly-funded health insurance due to restrictive Medicaid eligibility rules. During a 10 year period from 2004 to 2014, these were the same counties where access became even more limited due to hospital obstetrics department closures, potentially exacerbating racial and income-based disparities in maternal and infant health outcomes.61
Perhaps in part due both to overall poorer health and more difficulty accessing obstetrics care, maternal mortality rates are considerably higher in rural counties, with 19.8 pregnancy-related deaths per 100,000 live births in micropolitan counties (counties with 2,500 to 49,999 people) and nearly 23.8 in smaller rural counties, compared to 14.6 in large urban areas and 16.2 in medium and small metropolitan counties. Maternal mortality rates for Black women in smaller rural counties are the highest of any group—59.3 per 100,000 live births and the same is true for Black women in micropolitan counties (52.8 per 100,000 live births). American Indian and Alaska Native women’s maternal mortality rates are also significantly higher than rates for other rural women (37.5 in smaller rural counties and 32.3 in larger counties per 1000,000 women).62
The same higher mortality risk is true for rural babies, as well: neonatal mortality and infant mortality rates are 8 percent and 20 percent higher, respectively, in rural areas than in large urban counties, and rural infant mortality rates increase dramatically by maternal age—from 8 percent higher among mothers in their 20s, 30 percent higher among mothers in their 30s, and 54 percent higher for mothers in their 40s or beyond. In contrast, infant mortality rates are lower, and distinctions by maternal age for mothers in their 20s and 30s are absent, in urban areas.63 Infant mortality is a particular concern in Appalachia, which comprises West Virginia and some counties in Alabama, Georgia, Kentucky, Maryland, Mississippi, New York, North Carolina, Ohio, Pennsylvania, South Carolina, Tennessee, and Virginia. This is likely due to higher rates of preterm birth, low birth weights, maternal diabetes, and maternal hypertension in Appalachia than in other areas—in combination with higher poverty, lower employment and education levels, and lower rates of physician availability relative to need.64
Difficulty accessing high-quality maternal, neonatal, and maternal health services in rural areas is likely a significant factor in these substantial differences. Practitioners and state-based stakeholders cite prohibitive costs for travel long distances, transportation challenges, lack of financial resources that affect a person’s ability to get care, lack of insurance coverage, and lack of skilled obstetrics providers as among the factors affecting maternal mortality.65 Some data in the United States and internationally show that access to paid sick time and paid leave may play a role too.66 For example, the introduction of paid family leave in California was associated with a 12 percent reduction in post-neonatal mortality rates between 2004 when California’s program went into effect and 2008.67 Further research should examine the extent to which maternal lack of access to paid sick time for prenatal care and lack of access to paid maternity and parental leave affects maternal and infant mortality and health in rural areas.
D. Care and Caregiving
The aging U.S. population and the shrinking number of younger, working age people available to provide care to older and disabled loved ones is creating pressures for millions of working people and their families. One-in-five Americans—an estimated 53 million people—provided care to an older or disabled adult or to a child with disabilities in 2020, up from 43.5 million caregivers in 2015. Six-in-ten caregivers are also employed, and most report at least one work-related impact including late arrivals and early departures or taking time away from work to manage a loved one’s care.68
Family caregiving is a staple of life in rural communities in the United States. In 2021, nearly one-in-four rural residents (23 percent) report having provided care to a family, friend, or loved one within the past 30 days, according to analysis of the caregiver module in the Behavioral Risk Factor Surveillance System CDC Survey (BRFSS), which is a survey module administered to adults in most states.69
According to the National Alliance for Caregiving (NAC)/AARP study, Caregiving in the United States 2020 report and additional analysis of that data, a slightly higher share of caregivers reporting that they care for someone who lives in a rural area are employed, compared to non-rural caregivers (63 percent compared to 61.2 percent), but they tend to work just under two hours a week less, on average, than non-rural caregivers (34 hours per week compared to 35.9 hours per week), and a lower share of rural caregivers work a full-time 40-hour a week job.70
In rural counties, the need for caregiving is exacerbated by a relatively high share of people aged 65 and older and shrinking shares of working age and younger adults. A typical caregiver to a rural adult is 47.6 years old, which is two years younger than the typical adult caregiver in the non-rural areas (49.6), and their care recipient is also typically slightly younger than other adults who are cared for across the United States.71
Rural adults receiving care from a loved one are about as likely to have a long-term physical condition as non-rural residents (64 percent rural and 62 percent non-rural), but are slightly more likely to have a short-term physical condition (32 percent rural vs. 29 percent non-rural), a memory problem (35 percent vs. 30 percent), an emotional or mental health issue (31 percent vs. 28 percent), a developmental or intellectual disorder (11 percent vs. 8 percent), or a behavioral issue (10.3 percent vs. 7.4 percent). Children in rural areas who are receiving special health-related care are also more likely to have a short-term physical condition (31 percent vs. 26 percent).72 Short-term physical health issues may require a period of time away from work for caregivers, and short-term physical health issues, ongoing disability, mental health, and behavior issues may necessitate caregivers’ presence at medical visits, a more unpredictable need for leave and episodic care—all of which are difficult without access to paid leave and paid sick time.
Many rural caregivers do not live in a rural area themselves: Just 12 percent of the nation’s caregivers live in rural areas (about 6.4 million caregivers to adults), while 31 percent of care recipients are reported to have rural residency. This means care must be coordinated remotely or the caregiver must take time from work to travel to provide care.73 Rural counties also have higher shares of adults with disabilities who may struggle to find employment that provides paid leave, or who require care.74
Expectations about future caregiving responsibilities are higher in rural areas. Analysis of the 2021 BRFSS data shows that nearly 15 percent of rural residents compared to 13 percent non-rural residents believe that they will be called on to provide care to a family member or loved one in the next two years.75
Spotlight on Women, All Caregivers and Work
Women, particularly mothers, in rural areas may have particular challenges due to work and caregiving—both in terms of perceptions and actual navigation of work and care. In 2018, 62 percent of rural women said it is harder for women to get ahead, compared to 43 percent of rural men.76
In the wake of the COVID-19 pandemic, women with children under 18 and women with both children and other family caregiving responsibilities who work for pay outside their homes have been especially stretched—both nationally and in rural areas. According to a recent survey commissioned by the Bipartisan Policy Center, nearly six in ten rural mothers to children under 18 who had jobs in the past 12 months (57 percent) say they feel less economically secure than before the pandemic, significantly more than the shares of suburban and urban women who say the same.77 At a time when both illness and caregiving forced people to take time away from work, more than two-thirds of rural mothers (68 percent) said they could not afford four or fewer weeks off without pay (compared to 59 percent of women overall), including one-third of rural mothers (34 percent) who said they could not afford even one week without pay and still meet their family’s financial needs (compared to 26 percent of women overall).78
More than one-third of working rural mothers and mothers overall (37 percent) reported that caregiving has made it hard to remain in the workforce. A full one-quarter (25 percent) of rural mothers reported quitting a job because of caregiving in the past two years—more than mothers overall (20 percent).79
Rural mothers were less likely than mothers nationally to report having access to paid vacation time (71 percent versus 75 percent), paid sick days (64 percent versus 70 percent), paid parental leave to care for a new child (42 percent versus 48 percent), flexible work from home options (39 percent versus 45 percent), or affordable childcare or financial assistance for child care (13 percent versus 17 percent). Working mothers’ access to paid family caregiving leave is about the same in rural communities as nationally—32 percent or rural mothers and 34 percent of mothers overall report access. About half of all mothers nationwide who do not have paid parental or family caregiving leave say these supports would positively impact their ability to stay in the workforce, their financial security, their ability to fulfill their family responsibilities, and their mental health and stress levels.80
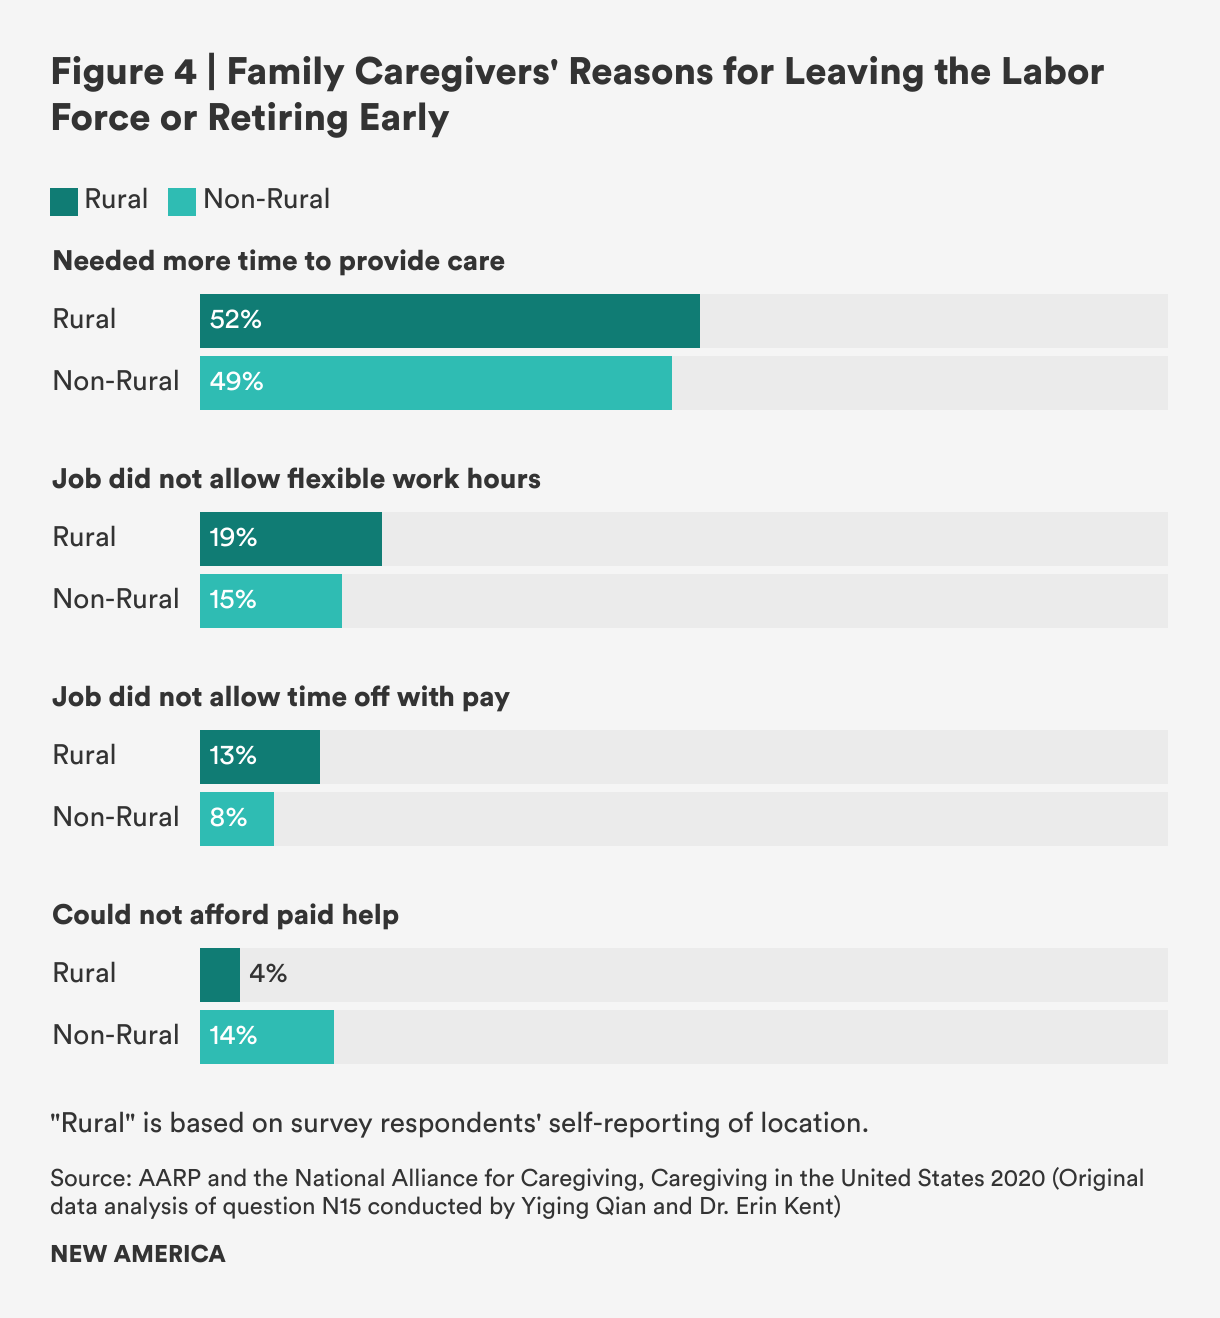
Among caregivers overall, the NAC/AARP survey also shows concerning information about caregivers’ labor force detachment: 7.5 percent of rural caregivers reported leaving work entirely or retiring early.81 The reasons they provide are illuminating: More than half (51.7 percent) said they needed more time to provide care, nearly one-in five (18.8 percent) said their job did not allow flexible hours, and more than one in ten (12.5 percent) said their job did not allow time off without pay. All of these are more common answers among rural caregivers than non-rural caregivers. And indeed, rural caregivers are less likely to report access to paid family leave and paid sick days than non-rural caregivers: 33 percent of rural caregivers report having access to paid family leave, compared to 40 percent in non-rural areas; and 55 percent report access to paid sick days compared to 58 percent in non-rural areas. Only the affordability of paid care seems to be much less of a factor in rural areas compared to non-rural locations (4.1 percent rural versus 13.9 percent non-rural).82
Citations
- Elizabeth A. Dobis, Thomas P. Krumel, John Cromartie, Kelsey L. Conley, Austin Sanders, and Ruben Ortiz, Rural America at a Glance, 2021 Edition (Washington, DC: USDA Economic Research Service, Department of Agriculture, 2021), 2, source; Kim Parker, Juliana Horowitz, Anna Brown, Richard Fry, D'Vera Cohn, and Ruth Igielnik, What Unites and Divides Urban, Suburban, and Rural Communities (Washington, DC: Pew Research Center, 2018), 19, source.
- Center on Rural Innovation, "Defining Rural America: The consequences of how we count," Center on Rural Innovation Blog, July 20, 2022, source. Center on Rural Innovation’s analysis of census tracts paints a different picture of rural America than analysis using county-level data does: a growing population, less diversity, higher incomes, more employment growth, less poverty, and less persistent poverty.
- Center on Rural Innovation, "Defining Rural America: The consequences of how we count"
- Parker et al., What Unites and Divides Urban, Suburban, and Rural Communities, 54–57.
- Dobis et al., Rural America at a Glance, 2.
- Parker et al., What Unites and Divides Urban, Suburban, and Rural Communities, 16.
- Kenneth Johnson,"Rural America Lost Population Over the Past Decade for the First TIme in History," University of New Hampshire Carsey School of Public Policy, February 22, 2022, source.
- William Frey, "New census data shows a huge spike in movement out of big metro areas during the pandemic," The Avenue (Brookings Institution blog), April 14 2022, source.
- Dobis et al., Rural America at a Glance, 2.
- Alexander Marre, "Rural Population Loss and Strategies for Recovery," Federal Reserve Bank of Richmond Econ Focus-District Digest, First Quarter 2020, source
- Parker et al., What Unites and Divides Urban, Suburban, and Rural Communities, 22.
- Parker et al., What Unites and Divides Urban, Suburban, and Rural Communities, 22.
- Johnson, “Rural America Lost Population.”
- Parker et al., What Unites and Divides Urban, Suburban, and Rural Communities, 24.
- See figures 7 and 12 in Center on Rural Innovation, “Defining Rural America.”
- USDA Economic Research Service, Rural Poverty and Well-Being (Washington DC, 2022), source.
- USDA Economic Research Service, Rural Poverty and Well-Being.
- USDA Economic Research Service, Rural Poverty and Well-Being.
- Dobis et al., Rural America at a Glance, 2.
- Dobis et al., Rural America at a Glance, 15-16.
- Change Lab Solutions, National Governors Association, and the Praxis Project, “Toward Better Rural Futures: Policy Scan Update,” PowerPoint Presentation, 2022.
- Alison Fields, Kelly Ann Holder, and Charlynn Byrd, “Life off the Highway: A Snapshot of Rural America,” U.S. Census Bureau blog, December 8, 2016, source; A Better Balance, Comparative Chart of Paid Family and Medical Leave Laws in the United States (New York, July 1, 2022), source; National Partnership for Women & Families, Current Paid Sick Days Laws (Washington, DC, August 2022), source.
- Emily Hallgren, Surviving Cancer in Rural America: The Role of Women’s Households, Social Networks, and Communities in Coping with Cancer (Chicago: PhD dissertation, Department of Sociology, University of Illinois at Chicago, 2021). The quotations in this section are from Dr. Hallgren’s dissertation research and are used with permission. All names attached to quotations are pseudonyms.
- Data USA, Map of Poverty by County (downloaded data) (2020), accessed September 2022 from source
- A Better Balance, Comparative Chart of Paid Family and Medical Leave Laws; National Partnership for Women & Families, Current Paid Sick Days Laws.
- Elise Gould and Jessica Schieder, Work sick or lose pay? (Washington, DC: Economic Policy Institute, 2017), source.
- Alexander Arnon, Zheli He, and Xiaoyue Sun, “Did Wages Keep Up with Inflation in 2021?” Penn Wharton Budget Model (blog), February 22, 2022, source.
- Amy Livingston, "Urban vs. Suburban vs. Rural Living – Differences to Consider Where to Live," Money Crashers, June 7, 2022, source.
- See table 4 in Pamela Joshi, Maura Baldiga, Allison Earle, Rebecca Huber, Teresa Osypuk, and Dolores Acevedo-Garcia, "How much would family and medical leave cost workers in the US? Racial/ethnic variation in economic hardship under unpaid and paid policies," Policy Resources for Community, Work and Family 24 (5) (2021): 517–540.
- Scott Brown, Jane Herr, Rahda Roy, and Jacob Alex Klerman, Employee and Worksite Perspectives of the Family and Medical Leave Act: Results from the 2018 Surveys, (Rockville, MD: Abt Associates, July 2020), 37, source.
- Elizabeth Kneebone and Natalie Holme, The growing distance between people and jobs in metropolitan America (Washington, DC: The Metropolitan Policy Program at Brookings, 2015), 5, source.
- Olugbenga Ajilore and Caius Z. Willingham, Adversity and Assets: Identifying Rural Opportunities (Washington, DC: Center for American Progress, 2019), source.
- Parker et al., What Unites and Divides Urban, Suburban, and Rural Communities, 27.
- Dobis et al., Rural America at a Glance, 7–8.
- Bill Bishop, “Rural Employment Down 1% Since Pandemic; Metro Employment Climbs,” The Daily Yonder, September 12, 2022, source.
- Parker et al., What Unites and Divides Urban, Suburban, and Rural Communities, 28.
- Agilore and Willingham, Adversity and Assets; United States Department of Agriculture, Rural Manufacturing at a Glance, 2017 Edition (Washington, DC: USDA Economic Research Service, Economic Information Bulletin 177, 2017), source; Bishop, “Rural Employment Down 1% Since Pandemic.”
- Agilore and Willingham, Adversity and Assets.
- Lynda Laughlin, "Beyond the Farm: Rural Industry Workers in America," U.S. Census Bureau blog, December 8, 2016, source
- Agilore and Willingham, Adversity and Assets.
- U.S. Bureau of Labor Statistics, Labor Force Statistics from the Current Population Survey, Table 18: Employed persons by detailed industry, sex, race, and Hispanic or Latino ethnicity (2021), source; U.S. Bureau of Labor Statistics, Quarterly Census of Employment and Wages, Employment and Wages Data Viewer, Private, NAICS Sectors, U.S. Total, All Establishment Sizes (2021 Annual Averages), source; U.S. Bureau of Labor Statistics, National Compensation Survey: Employee Benefits in the United States, March 2022, Tables Showing Leave Benefits, Short Term Disability Insurance—Private Sector (Washington, DC: U.S. Department of Labor Bureau of Labor Statistics, 2022), source.
- Benjamin Mueller, “In Rural America, Covid Hits Black and Hispanic People Hardest,” New York Times, July 28, 2022, source; National Center for Farmworker Health, COVID-19 in Rural America: Impact on Farms & Agricultural Workers (April 22, 2021), 5, source; Frey, “New census data shows a huge spike.”
- Mueller, “In Rural America, Covid Hits Black and Hispanic People Hardest.”
- Parker et al., What Unites and Divides Urban, Suburban, and Rural Communities, 46.
- Michelle Sowden, Pamela Vacek, and Berta M. Geller. "The impact of cancer diagnosis on employment: Is there a difference between rural and urban populations?" Journal of Cancer Survivors 2014 (8): 213–217, source.
- Emily Hallgren, Britni Ayers, Ramey Moore, Rachel S. Purvis, Pearl A. McElfish, Sanjay Maraboyina, and Gwendolyn Bryant-Smith, "Facilitators and barriers to employment for rural women cancer survivors," Journal of Cancer Survivorship (February 10, 2022), source.
- U.S. Bureau of Labor Statistics, National Compensation Survey.
- Aspen Institute, Thrive Rural Framework Overview (Aspen, CO: Aspen Institute, 2022), source; Mike Kerlin, Neil O'Farrell, Rachel Riley, and Rachel Schaff, “Rural rising: Economic development strategies for America’s heartland,” McKinsey & Company Public & Social Sector (March 30, 2022), source.
- Build Healthy Places Network, A Playbook for New Rural Healthcare Partnership Models of Investment (Oakland, CA: Public Health Institute, 2022), source.
- Partners for Rural Transformation, Transforming Persistent Poverty in America: How Community Development Financial Institutions Drive Opportunity (2019), 6, source.
- Dielle J. Lundberg, Ahyoung Cho, Rafeya Raquib, Elaine O. Nsoesie, Elizabeth Wrigley-Field, and Andrew Stokes, “Geographic and Temporal Patterns in Covid-19 Mortality by Race and Ethnicity in the United States from March 2020 to February 2022 (pre-print),” medRxiv (2022); Mueller, “In Rural America, Covid Hits Black and Hispanic People Hardest.”
- Rural Health Information Hub, Social Determinants of Health for Rural People (June 6, 2022), accessed September 3, 2022, source.
- Rural Health Information Hub, Rural Health Disparities (April 2019), accessed August 30, 2022, source.
- Snowden, Vacek, and Geller, “The impact of cancer diagnosis on employment,” 216.
- U.S. Government Accountability Office (GAO), Report to the Ranking Member Committee on Homeland Security and Governmental Affairs, United States Senate: Rural Hospital Closures: Affected Residents Had Reduced Access to Health Care Services (Washington, DC: U.S. GAO, 2020), source.
- Arrianna Marie Planey, Julie R. Perry, Erin E. Kent, Sharita R. Thomas, Hannah Friedman, Randy K. Randolph, and G. Mark Holmes, Since 1990, Rural Hospital Closures Have Increasingly Occurred in Counties that Are More Urbanized, Diverse, and Economically Unequal (Chapel Hill, NC: NC Rural Health Research Program, UNC-Chapel Hill Cecil G. Sheps Center for Health Services Research, 2022), source.
- Parker et al., What Unites and Divides Urban, Suburban, and Rural Communities, 46.
- Rural Health Information Hub, Rural Health Disparities.
- Cyrus M. Kosar, Lacey Loomer, Nasim Ferdows, Amal N. Trivedi, Orestis A. Panagioutou, and Momotazur Rahman, "Assessment of Rural-Urban Differences in Postacute Care Utilization and Outcomes Among Older US Adults." JAMA Network Open (January 8, 2020), doi:/10.1001/jamanetworkopen.2019.18738.
- Rural Health Information Hub, Rural Health Disparities.
- Peiyin Hung, Carrie E. Henning-Smith, Michelle M. Casey, and Katy B. Kozhimannil, “Access to Obstetric Services in Rural Counties Still Declining, With 9 Percent Losing Services, 2004-2014,” Health Affairs 36 (9) (2017): 1663–1671.
- U.S. Government Accountability Office (GAO), Report to the Committee on Ways and Means, House of Representatives: Maternal Mortality and Morbidity: Additional Efforts Needed to Assess Program Data for Rural and Underserved Areas (Washington, DC: U.S. GAO, 2021), 18, source.
- Danielle M. Ely, Anne K. Driscoll, and T.J. Matthews, “Infant Mortality Rates in Rural and Urban Areas in the United States, 2014,” NCHS Data Brief No. 285, (Hyattsville, Md.: National Center for Health Statistics, 2017), source.
- Gopal K. Singh, Michael D. Kogan, and Rebecca T. Slifkin, "Widening Disparities in Infant Mortality and Life Expectancy Between Appalachia And the Rest of the United States, 1990-2013," Health Affairs 36 (8) (2017), source.
- U.S. Government Accountability Office, Note to the Committee on Ways and Means: Maternal Mortality and Morbidity.
- Joia Crear-Perry, "Paid Maternity Leave Saves Lies," Bloomberg (June 24, 2021), source.
- Diana Montoya-Williams, Molly Passarella, and Scott A. Lorch, "The impact of paid family leave in the United States on birth outcomes and mortality in the first year of life," Health Services Research 55 (Suppl 2) (2020): 807–814, 808.
- National Alliance for Caregiving (NAC) and AARP, Caregiving in the U.S. 2020 (Washington, DC: NAC and AARP, May 2020), 4, 7 source.
- Erin Kent, Unpublished analysis of 2021 BRFSS Caregiver Module Data for this project (Summer 2022). Methodological information about the BFRSS 2021 module is available at source.
- Yiqing Qian and Erin Kent, Original data analysis of the Caregiving in the United States 2020 dataset (unpublished) (September 2022).
- Qian and Kent, Original data analysis of the Caregiving in the United States 2020 dataset (unpublished) (September 2022) (median age).
- Qian and Kent, Original data analysis of the Caregiving in the United States 2020 dataset (unpublished) (September 2022).
- National Alliance for Caregiving (NAC) and AARP, Fact Sheet: The "Typical" Caregiver of a Care Recipient Living in a Rural Area (Washington, DC: NAC and AARP, 2020), source; Quian and Kent, Original data analysis of the Caregiving in the United States 2020 dataset (unpublished) (September 2022). .
- Guixiang Zhao, Catherine A. Okoro, Jason Hsia, William S. Garvin, and Machell Town, "Prevalence of Disability and Disability Types by Urban-Rural County Classification-U.S., 2016," American Journal of Preventive Medicine 57 (6) (2019): 749-756; University of Montana Rural Institute, How will the COVID-19 Recession Impact People with Disabilities in Rural America (Missoula, MT: Rural Training and Research Center on Disability in Rural Communities, University of Montana, 2020), source.
- Kent, Unpublished analysis of 2021 BRFSS Caregiver Module Data for this project (Summer 2022).
- Parker et al., What Unites and Divides Urban, Suburban, and Rural Communities, 36.
- Bipartisan Policy Center and Morning Consult, Understanding Mothers in the Workforce (Washington, DC, May 2022), 11 source
- Bipartisan Policy Center and Morning Consult, Understanding Mothers in the Workforce, 10.
- Bipartisan Policy Center and Morning Consult, Understanding Mothers in the Workforce, 23.
- Bipartisan Policy Center and Morning Consult, Understanding Mothers in the Workforce, 9, 36.
- Qian and Kent, Original data analysis of the Caregiving in the United States 2020 dataset (unpublished) (September 2022). We note that this is a lower share than the 9.8 percent exit rate for caregivers in non-rural areas, but rural caregivers also tend to be slightly younger than non-rural caregivers and to work fewer hours, which may partially explain the difference. Lower wages and less savings—creating an economic imperative to continue working—may also play a role.
- Qian and Kent, Original data analysis of the Caregiving in the United States 2020 dataset (unpublished) (September 2022).