
Table of Contents
- Introduction
- Pre-K Teachers and In-Service Professional Learning
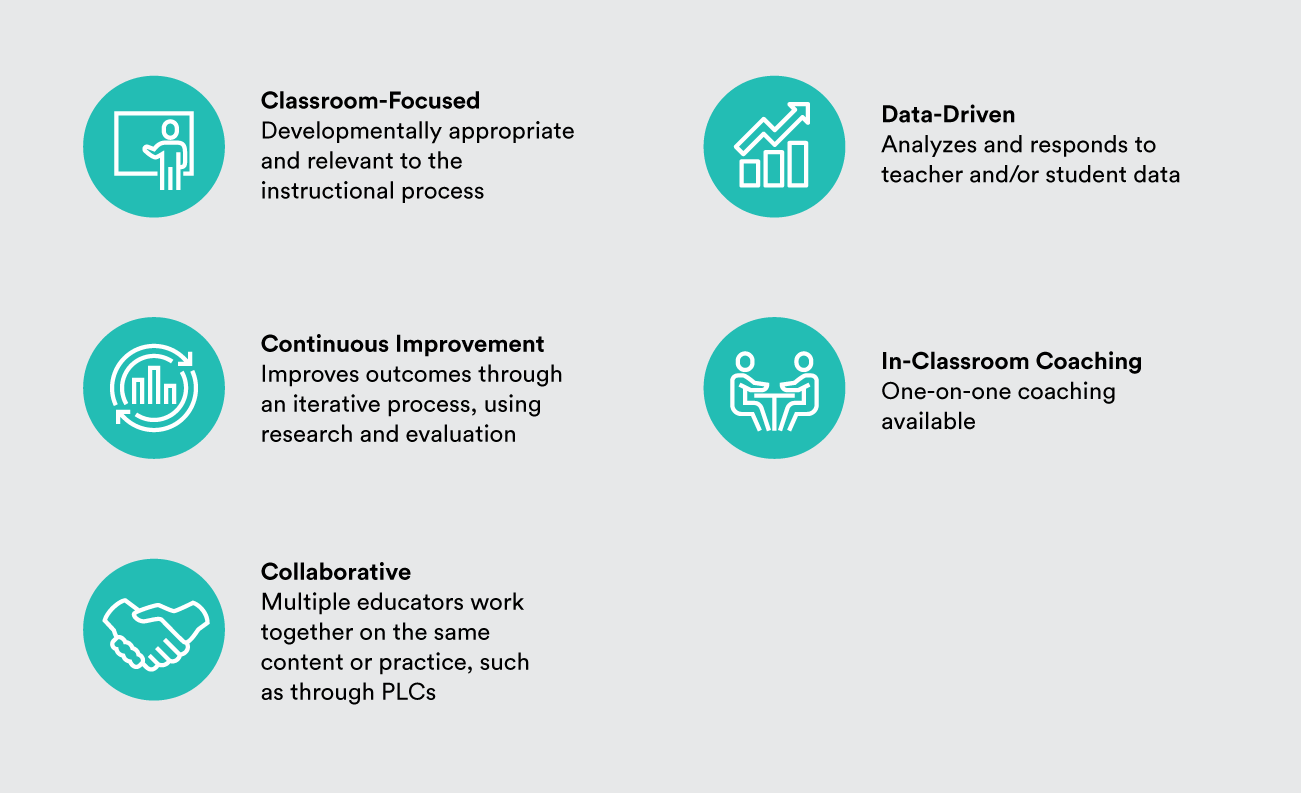
- Our Approach
- Strengthening STEM Instruction in Passaic, New Jersey
- Building a Cohort of Early Childhood Technology Leaders in Chicago, Illinois
- Partnering to Connect Research to Practice in Nashville, Tennessee
- Explicitly Teaching Social and Emotional Skills in San Jose, California
- Improving Language and Literacy Across Texas
- Five Lessons for Growing Strong Pre-K Teachers
Partnering to Connect Research to Practice in Nashville, Tennessee
Over 3,100 four-year-olds in Nashville had access to publicly funded pre-K in the 2016–17 school year.1 All lead pre-K teachers in Metro Nashville Public Schools (MNPS) are required to have a bachelor’s degree with certification in early childhood education and are paid on the same scale as K–12 teachers. Each of the district’s Early Learning Centers discussed in this profile serve a majority of non-white students.2 In 2017, approximately 75 percent of students in Davidson County qualified for free or reduced-price lunch.3
Back in 2013, when district leadership in MNPS sat down to develop a five-year strategic plan, pre-K rose to the top as a priority. Superintendent Jesse Register and his team knew that a strong start could set children on the path of long-term success. MNPS was already participating in the state’s Voluntary Pre-K Program, but district leaders wanted a better understanding of what really worked in pre-K. If they expected pre-K to fulfill its promise, they knew it needed to be high quality.
With financial support from the city of Nashville, MNPS decided to create three new Early Learning Centers that would act as hubs of innovation. The Early Learning Centers would serve only pre-K students and would function under an iterative, continuous quality improvement model so that MNPS could determine what led to high-quality pre-K. Lisa Wiltshire, who was MNPS’s executive director of early learning innovation at the time, recalls that one of the first phone calls she made was to Dale Farran at Vanderbilt University’s renowned Peabody Research Institute (PRI).
PRI was already evaluating the state’s pre-K program and had been following a cohort of Tennessee students since 2009. Wiltshire wanted to strengthen the district’s partnership with PRI researchers by having them conduct enhanced evaluations of program quality for the Early Learning Centers to determine what factors are associated with better child outcomes. Beginning in the Early Learning Centers’ first year, 2014–15, PRI conducted full-day observations in every classroom, three times per year, in addition to pre- and post-assessments of pre-K students. Teachers and leaders were hired with the understanding that working in the Early Learning Centers meant frequent observations, a willingness to use data to improve practice, and intensive professional learning.
In October 2014, the state of Tennessee applied for a federal Preschool Development Grant to improve access to high-quality pre-K in high-need communities. The proposal included efforts to improve the quality of pre-K in MNPS by providing personalized coaching for all of the district’s pre-K teachers, building on the instructional lessons learned in the new Early Learning Centers.4 A MNPS needs-assessment found that many of the pre-K teachers working in public schools were isolated and had limited access to tailored professional development practices. District leaders believed that PLCs bringing together pre-K teachers and instructional coaches could improve teacher practice.
The federal government granted Tennessee approximately $17 million per year for four years, with $8 million per year going to MNPS to make its vision a reality.5 The award included funding for an expanded partnership with PRI to assess the pre-K expansion and quality efforts. MNPS hired 11 pre-K coaches to work across schools and seven to work in the Early Learning Centers. One cohort of coaches was assigned to work with the researchers at PRI.
Not a Setback, but an Imperative
Less than one year into this work with MNPS, PRI released findings from its statewide study of the Tennessee Voluntary Pre-K Program, which caused unrest in the early education community and raised concerns about pre-K for policymakers nationwide.6 In their randomized controlled trial of Tennessee’s Voluntary Pre-K program, Mark Lipsey, Dale Farran, and Kerry Hofer found that children who attended the state’s public pre-K program showed gains at the beginning of kindergarten, but by the end of kindergarten performed no better than their peers who did not attend state pre-K.7 This “fade-out” phenomenon, where the gains made in pre-K diminish over time, has been documented in other programs.8 But what really raised eyebrows was the finding that Voluntary Pre-K students were performing lower on a host of academic and behavioral measures than their counterparts by the end of third grade. The findings seemed to contradict years of evidence that high-quality programs can help close the achievement gap and yield a strong return on investment.9
Voluntary Pre-K met a host of indicators that experts considered necessary for strong pre-K, such as teachers with bachelor’s degrees and specialized training in early childhood education, as well as small classes with low student-to-teacher ratios.10 The study made clear that while these indicators may be necessary for quality, they were not sufficient. While some skeptics used the PRI study to argue that pre-K is not a worthwhile investment, state officials had a different takeaway: they decided to figure out what was not working and try to improve the program. For leaders in MNPS, the investment in the Early Learning Centers became even more important. They needed to determine what specific teacher practices led to consistent gains for pre-K students so that those practices could be the focus for professional development and replicated to scale.
From 2014 to 2016, the PRI team observed 26 preschool classrooms in the three Early Learning Centers. The team collected data on classroom practices using the Child Observation in Preschool tool and the Teacher Observation in Preschool tool, which capture snapshots of child and teacher behavior, respectively, over a designated period of time.11 Both tools were developed by researchers at PRI over two decades ago and have been validated.12 Team members also collected individual assessment data on each of the 840 students in the 26 classrooms. By identifying specific classroom practices associated with quality outcomes, they hoped to create a validated model of what works in pre-K, and then use this data to influence coaching.
Predicting Better Pre-K Outcomes: Signs Point Toward the “Magic 8”
Collecting data on teacher practice and child outcomes was the first phase of the partnership between the Early Learning Centers and PRI, and it was not always smooth sailing. Teachers were anxious about the observation data being used punitively and had to adjust to having observers in their classrooms. According to Susan McClane, one of the coaches working with PRI, “there used to be no curriculum in pre-K. Pre-K was isolated in MNPS, so teachers got used to developing their own way of doing things. They worked so long by themselves without principal help, without coaches, that bringing in observers and coaches was an adjustment.” As Dale Farran said in an Education Week article, “most teachers have gotten into a situation where data are used to judge, not to help improve….So we [PRI] had to learn how to present the data in a more supportive way, but teachers also had to learn how to trust us to give them information that might help their practices to be better.”13
Coaches had to adjust too. PRI was presenting them with more data than they knew how to use. PRI wanted to be hands-off and let coaches decide what to do with the data, but it was not always intuitive how to translate the research into practice. According to PRI research associate Caroline Christopher, “what we originally envisioned was less than helpful for the coaches and teachers. We presented them with a 64-page document that we were excited about, but they didn’t know what to do with it. We realized they have competing demands and didn’t have time to parse through this lengthy document and try to make sense of it.”
To limit confusion and improve efficiency, the PRI research team decided to hone in on the eight classroom practices that the data showed were most consistently associated with student gains:
- Reduce transition time (routines and wait time for children)
- Increase the quality of instruction
- Create a more positive emotional climate
- Have teachers listen more to children
- Provide more sequential activities
- Foster social learning (associative and cooperative) interactions
- Foster high levels of child involvement
- Create more math opportunities
The researchers hoped that teachers and coaches would be more open to changing practice if the practices were shown to improve student growth.14 They were right. Ashley Aldridge Wilson, a pre-K coach who works with PRI, was eager to implement the eight evidence-based practices, which educators quickly termed the “Magic 8.” She said, “when I told my teachers about the Magic 8, there was not a lot of knowledge. If you were in a testing grade, and researchers identified eight strategies that you could do to show tremendous growth, wouldn’t we want to all know those secrets?”
But the next phase of the partnership—figuring out exactly how coaches would use the Magic 8—was another learning process. PRI worked with the coaches to determine how they felt comfortable using the data. PRI initially wanted coaches to gather teacher observation data, but quickly realized that coaches did not feel this was the best use of their limited time. The coaches also did not want their teachers to view them as evaluators. As Wilson explained, “we’re not there to evaluate teachers. We are there to come alongside and try to have a spirit of joy and non-intrusion. We are not assistants; we are there to work with the adults on best practice. We will help as needed, but our primary role is to grow the teacher’s pedagogy and strategy. We’re happy to model, but just working with kids doesn’t grow teacher practice.”
Much of the first two years of the partnership between MNPS and PRI was spent learning how to be partners. PRI researchers spoke to the coaches, administrators, and teachers about their needs and adjusted their role accordingly. This was all part of the iterative model that Wiltshire and Farran’s teams had envisioned. In a journal article last fall, Farran and her colleagues liken this process to “design-based research” explaining that it “includes the same continuous cycle of data collection, feedback, planning, implementing, and monitoring associated with CQI [continuous quality improvement]” with the goal being “to design the model not validate an existing one.”15 Explaining the process, Caroline Christopher told us, “now we sit the coaches down and ask what is most useful, instead of giving them a bunch of assignments.” And the coaches appreciate the flexibility. As coach SeTar DeThrow explained, “we’re all kind of finding our way. We’re appreciative of the PRI researchers being open to getting the most accurate picture.”
Translating Data into Classroom Practice
The coaches and teachers wanted benchmarks to measure how their practice around the Magic 8 was improving, but PRI was wary of setting concrete goals because of limited research on how much time a teacher should spend on a certain action. Instead, PRI took the observation data it had and “presented graphs where [the researchers] contrasted the average score from a prior observation with the best [they] had observed in any one teacher in the group in the subsequent observation and an arrow indicating this was the direction teachers should be heading.”16
PRI Team (April 2018)
For instance, one of the Magic 8 is “reduce time spent in transition.” Transitioning from one activity to the next is often when teachers see a lot of behavior problems. Pre-K teachers want to maximize the time spent on instruction, but often do not know how to use transition time effectively. Transition time cannot completely be eliminated, but it is difficult to determine the exact amount of time that should be spent transitioning or what realistic goals should be. This is where the data come in. But as Christopher explained, “standard deviations are not helpful for teachers. They want something to compare their current practice to.” If classroom observations found that the average amount of time classrooms spend on transitions is 20 percent, for example, but one teacher spends just 5 percent of her time in transitions, then the researchers and coaches know it is possible for teachers to move closer to 5 percent. The goal is not necessarily to move every teacher to 5 percent, but to move in that direction.
PRI not only presents the data but also works with coaches to find strategies for improving instruction. For instance, PRI has identified ways that coaches can help teachers incorporate instructional content into transitions. When Wilson addressed transitions with her teachers she presented the data, timed how long they were spending on transitions, and then brought them together to brainstorm how to improve. With new information and tools, teachers went back to the classroom and implemented their ideas.
Coaches and teachers can also use a website PRI created that explains the Magic 8 in detail, with written explanations, pie charts, summaries of findings, and strategies and resources. PRI has posted one-pagers with questions and suggestions for what to do to improve. Coaches are encouraged to use these in their PLCs. The website also includes a “Partnership Portal” where PRI houses secure data on student assessments and teacher performance.
To promote buy-in and build expertise, the PRI team has identified teachers with specific strengths and asked them to write blog posts on the website with advice for other teachers. The researchers found that teachers prefer to hear from their peers about how to improve their practice instead of from researchers who are not in the classroom every day. While informal, blogging gives the teachers an opportunity to mentor their colleagues. The coaches report that on the whole, teachers have been receptive to the coaching. As they began working on the Magic 8, coaches noticed many teachers posted them on the walls of classrooms. In MNPS, all pre-K teachers participate in coaching, and unsurprisingly, coaches find that they “see the most growth from teachers who are eager.” Coach Wilson also reported that when “principals have had a vested interested in pre-K, [she’s] been able to move their teachers so much more.”
Broadening the Reach of the Research
While PRI continues to work with MNPS coaches and improve its model for professional learning, both groups envision this work going further. The Tennessee Department of Education developed a statewide definition for quality early education based on multiple sources of evidence, including national research and PRI’s findings from its work with MNPS on the “Magic 8.” Farran said that Tennessee now has “one of the best statewide visions [she’s] seen.” As she and her colleagues explained in the article outlining their work over the last few years, “the school district funded the pre-K centers [Early Learning Centers] with their 26 classrooms to be the Petri dish where a vision could grow, a vision the district wanted validated and exported to the rest of its more than 100 pre-K classrooms.”17
The ultimate goal is to develop a mobile website application with PRI’s observation tool that is “less research-y and more applicable to the real world,” as Christopher explained. PRI envisions coaches being able to go into a classroom with a tablet loaded with the app, choose what they are interested in observing based on the Magic 8, receive instructions on what to observe and for how long, quickly receive data to show where this teacher falls in comparison to others, and then have access to strategies and resources to improve. Farran says this is the “beginning of what I hope will be a different way of doing professional development.”
Farran explained, “the idea is that the dataset grows and grows, to include the entire district. As the app collects more data on more teachers, it can start to tell what is a typical range for certain behaviors. There’s always a huge range in teacher behavior.” While coaches will continue to have individualized data on their teachers, “the district can also notice when something is a district-wide issue and narrow [its] professional development accordingly.” As is often the case, funding is the primary barrier to this work. The PRI team is in the process of securing funding to make the app a reality.
Citations
- High-quality Start for All: A Roadmap for Strengthening Pre-K and Early Learning Opportunities for All (Nashville, TN: Office of Mayor Megan Barry, August 2017), source.
- 2016–17 Annual Diversity Report (Nashville, TN: Metro Nashville Public Schools, 2017), source.
- Kids Count Data Center (website), “Free/Reduced-Price School Lunch Participation,” (2017), source.
- Application for Grants Under the Preschool Development Grants–Expansion, (Washington, DC: U.S. Department of Education, 2015), source.
- U.S. Department of Education, “What Are Preschool Development Grants?” source.
- Mark W. Lipsey, Dale C. Farran, and Kerry G Hofer, A Randomized Control Trial of a Statewide Voluntary Prekindergarten Program on Children’s Skills and Behaviors through Third Grade (Nashville, TN: Peabody Research Institute, Vanderbilt University, 2015), source.
- Mark W. Lipsey, Dale C. Farran, and Kerry G Hofer, A Randomized Control Trial of a Statewide Voluntary Prekindergarten Program on Children’s Skills and Behaviors through Third Grade (Nashville, TN: Peabody Research Institute, Vanderbilt University, 2015), source.
- Pre-K Benefits: The Facts on Fade-Out (Atlanta, GA: Southern Regional Education Board, 2015), source.
- Hirokazu Yoshikawa, Christina Weiland, Jeanne Brooks-Gunn, Margaret R. Burchinal, Linda M. Espinosa, William T. Gormley, Jens Ludwig, Katherine A. Magnuson, Deborah Phillips, and Martha J. Zaslow, Investing in Our Future: The Evidence Base on Preschool (New York: Foundation for Child Development, 2013), source.
- W. Steven Barnett, Allison H. Friedman-Krauss, G. G. Weisenfeld, Michelle Horowitz, Richard Kasmin, and James H. Squires, The State of Preschool 2016: State Preschool Yearbook (New Brunswick, NJ: National Institute for Early Education Research, 2017), source.
- Dale C. Farran, Child Observation in Preschools (COP) (Nashville, TN: Peabody Research Institute, Vanderbilt University, 2006), source; Carol Bilbrey, Elizabeth Vorhaus, and Dale C. Farran, Teacher Observation in Preschools (TOP) (Nashville, TN: Peabody Research Institute, Vanderbilt University, 2007), source.
- Dale C. Farran, Deanna Meador, Caroline Christopher, Kimberly T. Nesbitt, and Laura E. Bilbrey, “Data-Driven Improvement in Prekindergarten Classrooms: Report from a Partnership in an Urban District,” Child Development 88, no. 5 (2017): 1466–1479, source.
- Marva Hinton, “Vanderbilt Researchers Develop 'Magic 8' Practices to Create an Effective Preschool,” Education Week, October 19, 2017, source.
- Dale C. Farran, Deanna Meador, Caroline Christopher, Kimberly T. Nesbitt, and Laura E. Bilbrey, “Data-Driven Improvement in Prekindergarten Classrooms: Report from a Partnership in an Urban District,” Child Development 88, no. 5 (2017): 1466–1479, source.
- Dale C. Farran, Deanna Meador, Caroline Christopher, Kimberly T. Nesbitt, and Laura E. Bilbrey, “Data-Driven Improvement in Prekindergarten Classrooms: Report from a Partnership in an Urban District,” Child Development 88, no. 5 (2017): 1466–1479, source.
- Dale C. Farran, Deanna Meador, Caroline Christopher, Kimberly T. Nesbitt, and Laura E. Bilbrey, “Data-Driven Improvement in Prekindergarten Classrooms: Report from a Partnership in an Urban District,” Child Development 88, no. 5 (2017): 1466–1479, source.
- Dale C. Farran, Deanna Meador, Caroline Christopher, Kimberly T. Nesbitt, and Laura E. Bilbrey, “Data-Driven Improvement in Prekindergarten Classrooms: Report from a Partnership in an Urban District,” Child Development 88, no. 5 (2017): 1466–1479, source.