Table of Contents
- Executive Summary
- Why This Moment Is Ripe for Direct Democracy
- What Are Citizen-Initiated Ballot Measures?
- A Short History of Citizen-Initiated Ballot Measures
- Lessons from Reform Leaders and Coalitions
- Analysis of Adoption Trends: Strategic Takeaways from History
- Assessing State Readiness: Preliminary Criteria and Methodology
- Conclusion: The Future of Citizen-Initiated Ballot Measures
- Appendix
Assessing State Readiness: Preliminary Criteria and Methodology
Expanding ballot initiatives to states to more states requires more than moral urgency—it demands strategic focus. We developed a scoring system to identify the most promising states for near-term adoption of citizen-initiated ballot measures. Based on a review of historical patterns, political science research, interviews with reform scholars and practitioners, and recent organizing experience, we conceptualized a state’s readiness for initiatives based on two dimensions: (1) feasibility of adoption and (2) potential policy impacts. The feasibility dimension refers to factors associated with a higher likelihood of adopting ballot initiatives, as established by previous research on the topic, and to factors that would facilitate the work of people on the ground advocating for ballot initiatives. The impact dimension refers to factors that indicate places where ballot initiatives could have a greater impact because citizens have greater difficulty expressing their views through the usual electoral channels.
On the feasibility dimension, we considered factors that would facilitate the adoption of initiatives in the next five to 10 years. We also considered factors that could reduce the risk of initiatives being misused and causing more harm than good. For instance, because the success of initiatives depends on equal access to the ballot and high levels of electoral participation, one might hesitate to expand initiatives to states with high racial turnout gaps, as that could reproduce existing inequalities.
On the impact dimension, we considered factors that indicate where initiatives would have the most meaningful democratic, social, and policy improvements, with a particular focus on historically underserved communities for whom the usual electoral and democratic institutions have not delivered positive outcomes. There is often a tension between the indicators related to feasibility and those related to impact. The places where initiatives could have the most impact on marginalized communities—because traditional democratic channels have failed them—are also the places where it is the most difficult to enact democratic reforms and ensure they’re implemented responsibly. Throughout the analysis, we tend to prioritize feasibility indicators, as a state must first adopt initiatives before any impact could materialize.
We collected state-level data on 42 indicators across seven different categories. Our selection of indicators was guided by previous academic work that has identified factors associated with the adoption of initiatives specifically and of other types of institutional reforms more broadly. We also incorporated insights from 31 direct democracy experts, political scientists, state policy advocates, state and local organizers, and campaign strategists. Separating the indicators into categories provides a more detailed understanding of how each state scores and whether the score is driven by feasibility- or impact-related indicators. For instance, there may be states that score high on impact categories like representation or governance, suggesting that they would potentially benefit a lot from the introduction of initiatives, but score low on feasibility categories, which would make it less likely for a state to adopt initiatives, at least in the near term. (All indicators have been re-coded so that high values correspond to greater readiness for initiatives.)
To the extent possible, we relied on existing indicators for the concepts we wanted to capture. For instance, the indicator capturing polarization in state legislatures was developed by academic researchers studying how polarization has changed in the states over time; the state democracy indices were developed by another academic researcher examining the health of democracy at the state level. Other indicators come from official government sources (union membership, median income, and Gini coefficients to measure income inequality) or from published reports from think tanks and research institutions (turnout gap, partisan skew, and bias of electoral maps). In a few cases, we created the indicators ourselves using existing data. The indicator proxying the difficulty of amending the constitution was built with data from the Council of State Governments, and the majority party surplus of seats was created with data from the National Conference of State Legislatures. (See Table A4 in the Appendix for a detailed list of sources and time periods each indicator refers to, as well as basic descriptive statistics of the indicators.)
Below are the indicators we used to develop the score, organized by their respective categories, to inform the selection of most-promising states for near-term expansion.
Political and Legal Feasibility Indicators
These criteria evaluate whether a state’s political and legal conditions make initiative adoption plausible in the near term.
Political Context
This category includes indicators that capture whether a state’s political dynamics are amenable to reform. Existing research has identified factors like divided partisan control of a state’s political institutions or narrow legislative margins as contributing to the adoption of reforms and has indicated that political culture and history can also play an important role in explaining reforms. Below are the indicators we use in this category, which focus on the most recent available election data:
- Trifecta: whether a state had a partisan trifecta in the control of the governorship, state house, and state senate in 2024.
- Swing state: whether a state was a swing state in the 2024 presidential election. Not only does being a swing state indicate narrow partisan races, but it is also in swing states where a lot of organizing and mobilizing happens.
- Margin of victory of 2024 presidential candidates: This is another way to measure narrow margins and swing state status.
- Deep South: whether a state is in the Deep South. Political science research has shown that unique historical legacies shape political dynamics today and affect the quality of democracy and representation in Southern states.1 Many analysts include an indicator variable for the Deep South in their analyses since it is correlated with many other political factors of interest.
- Presidential turnout: The share of the voting-eligible population that participated in the 2024 elections can proxy for general levels of political participation.
- Racial turnout gap: The difference in voting rates between white and non-white ethnic groups in 2022 can also proxy for general levels of political participation, but additionally for barriers to voting.
- Automatic ballot referral: whether a state has automatic ballot referrals on constitutional conventions.
Legal Feasibility
Here, we focus on factors that would make the adoption of ballot initiatives easier from a procedural standpoint. We also include an indicator that could influence the willingness of politicians to take up the issue or of the population to push for it:
- Amendment threshold difficulty: an indicator that captures the steps it takes to amend a state constitution and the shares by which different players have to approve an amendment to ratify it.
- Constitutional amendments proposed from 2003 to 2024: the number of state constitutional amendments that have been referred to voters.
- Constitutional amendments proposed from 2020 to 2024: same as the previous indicator, but meant to capture more recent dynamics.
- Amendment approval rate from 2003 to 2024: the number of state constitutional amendments that have been referred to and approved by the population. We consider this a measure of alignment between proposed amendments and citizens’ views, such that high approval rates may obviate the need for ballot measures.
- Past attempts to legalize initiatives or referendums from 2018 to 2024: The number of bills introduced in non-initiative states that tried to legalize citizen-initiated ballot measures could indicate preexisting enthusiasm for this reform, as well as the availability of legislative advocates for adopting the reform.
- Share of bordering states with initiatives: The policy-diffusion literature has identified sharing a geographic border as facilitating the adoption of policies across states, given linkages and proximity between politicians and the general population.
- Top 10 cities with initiatives: of the top 10 cities in a state, the number of them that have ballot initiatives.
- Statewide ballot measures from 2020 to 2024: the number of statewide ballot measures referred to voters.
Electoral and Legislative Dynamics
It is difficult for reforms that could disrupt the balance of power to be adopted in legislatures where one party dominates, as the dominant party is unwilling to give up power. In legislatures with narrower margins, parties may be more willing to adopt reforms to help secure their long-term survival. This category includes the following variables:
- Party advantage: the difference in seat shares between the majority party and the minority party in the state house and, separately, in the state senate.
- Majority party surplus: the excess share of seats in the state house and senate that a party has beyond a simple majority, which Smith and Fridkin find explains the adoption of initiatives historically.2
- Skewness of the state senate and house: the disproportionality between the share of votes a party obtains and the share of seats they get. Skewness could hint at places where initiatives might have the most impact. But its most immediate effect would be in the ability of parties that have power disproportionate to their vote share to block reforms that would disrupt their power.
- Partisan bias of state house maps: a measure of how gerrymandered the electoral maps are. We include this for similar reasons to the skewness of the state house.
Social Capital and Local Organizing Capacity
Even in states where legal or political barriers are low, strong civic foundations are key for making the adoption of initiatives possible and for having local, state-based advocates for the reform. Social capital and organizing capacity are difficult to pinpoint exactly, so we use a variety of indicators to proxy for them:
- Social Capital Index: an index developed by the Joint Economic Committee of the U.S. Senate that integrates variables measuring community health, family unity, collective efficacy, and other factors into one state-level index.
- Pro-democracy organizations per capita: the number per capita of organizations working to expand democracy in each state, as identified by the National Civic League.
- Tax-exempt organizations per capita: the number per capita of organizations with tax-exempt status in each state.
- Economic connectivity: the degree to which low- and high-income people are friends with each other, as measured by researchers using social media data.
- Civic organizations per capita: the number of civic organizations per 1,000 social media users, as measured by researchers using social media data.
- Protests per capita from 2021 to 2024: the number of peaceful protests per capita in each state.
- Workers in a labor union: the share of workers who are members of a union.
Socioeconomic Context
Research has shown that both money and race play an important role in shaping policymaking in the United States. The high concentration of money in a few hands can lead to the capture of the policymaking process, which can prevent democratic change. Historical and contemporary work has also shown that demographics can affect whether a policy is adopted, particularly if the policy could result in the redistribution of power or resources across ethnic groups. To capture these dynamics, we include the following indicators:
- Gini coefficient: a measure of economic inequality in a state.
- Median income: the median level of household income in a state.
- Share of the population that is not white: Smith and Fridkin’s research shows that the more non-white people there were in a state, the less likely it was for a state to adopt initiatives.3
Potential for Democratic and Social Impact
This second dimension ensures that expansion efforts do not merely succeed politically but also meaningfully strengthen democracy and equity.
Representation
In states where people are not well represented through traditional democratic institutions, initiatives have the most potential to channel their voices into the policymaking process. We consider the following indicators as a proxy for (a lack of) political representation:
- Congruence between public opinion and policy: the correlation between mass preferences and state-level social and economic public policies, as measured by Caughey and Warshaw.4
- Overrepresentation of white voters: the difference between the percentage of seats where white voters make up a majority of the electorate and the white voting age population share statewide.
- Underrepresentation of minority groups: the difference between the share of non-white voters in a state and the share of non-white state legislators.
- Share of female legislators: the share of female legislators in the state house and senate.
Governance
Where traditional democratic institutions are working well, citizens might not have much use for alternative methods of representation and influence, like initiatives. As a result, initiatives might have the most impact in places that score low in areas related to democratic governance. We consider the following indicators:
- State democracy index: a measure of democratic performance in each state developed by Jacob Grumbach that considers a variety of factors—including ballot access, voting laws, gerrymandering, and congruence—between public opinion and policies. We include both versions of the index: the additive version and the version developed through Bayesian factor analysis.
- Polarization: a measure of ideological polarization in state legislatures.
- Corrupt practices: a proxy for the prevalence of corruption in a state legislature based on a 2018 survey of journalists and their perceptions of corrupt practices. High levels of corruption could prevent politicians from being responsive to voters if they instead respond to special interests or backdoor deals.
- Anti-corruption laws: an index capturing the number of anti-corruption laws in place in a state in 2020.
Creating the Scores
In order to integrate the information provided by all these indicators, we created a score per category for each state as well as an overall score for the state. We first standardized all the variables to have an average of zero and a standard deviation of one, which ensures that all the variables are on the same scale and can be compared to each other and used together. After standardizing the variables, we rotated certain variables to make sure that all the variables had the same direction, such that more positive values would indicate greater readiness for initiatives.
Calculating the overall scores and the scores for each category was done by taking the weighted average of the standardized indicators for each state (both pooled and by category). Based on our background research and our concerns for feasibility, we identified certain variables that we believe should be more influential in the scores, so we assigned them additional weight when calculating the averages. The following indicators got a weight of 1.5: the state’s Gini coefficient, congruence between public opinion and public policy, prior bills for legalizing initiatives, and the number of pro-democracy organizations per capita. These indicators were assigned a weight of 2: surplus share of seats in the state house and senate, the difference in seat shares between the majority and minority party in the state house, the difficulty of amending the state constitution, and the margin of victory in the 2024 presidential election.
Table 2 shows the overall scores and rankings of the states, from potentially most ready to adopt an initiative process to least, based on a combination of feasibility and impact indicators. For a detailed breakdown of each state’s scores by category, see the Appendix.
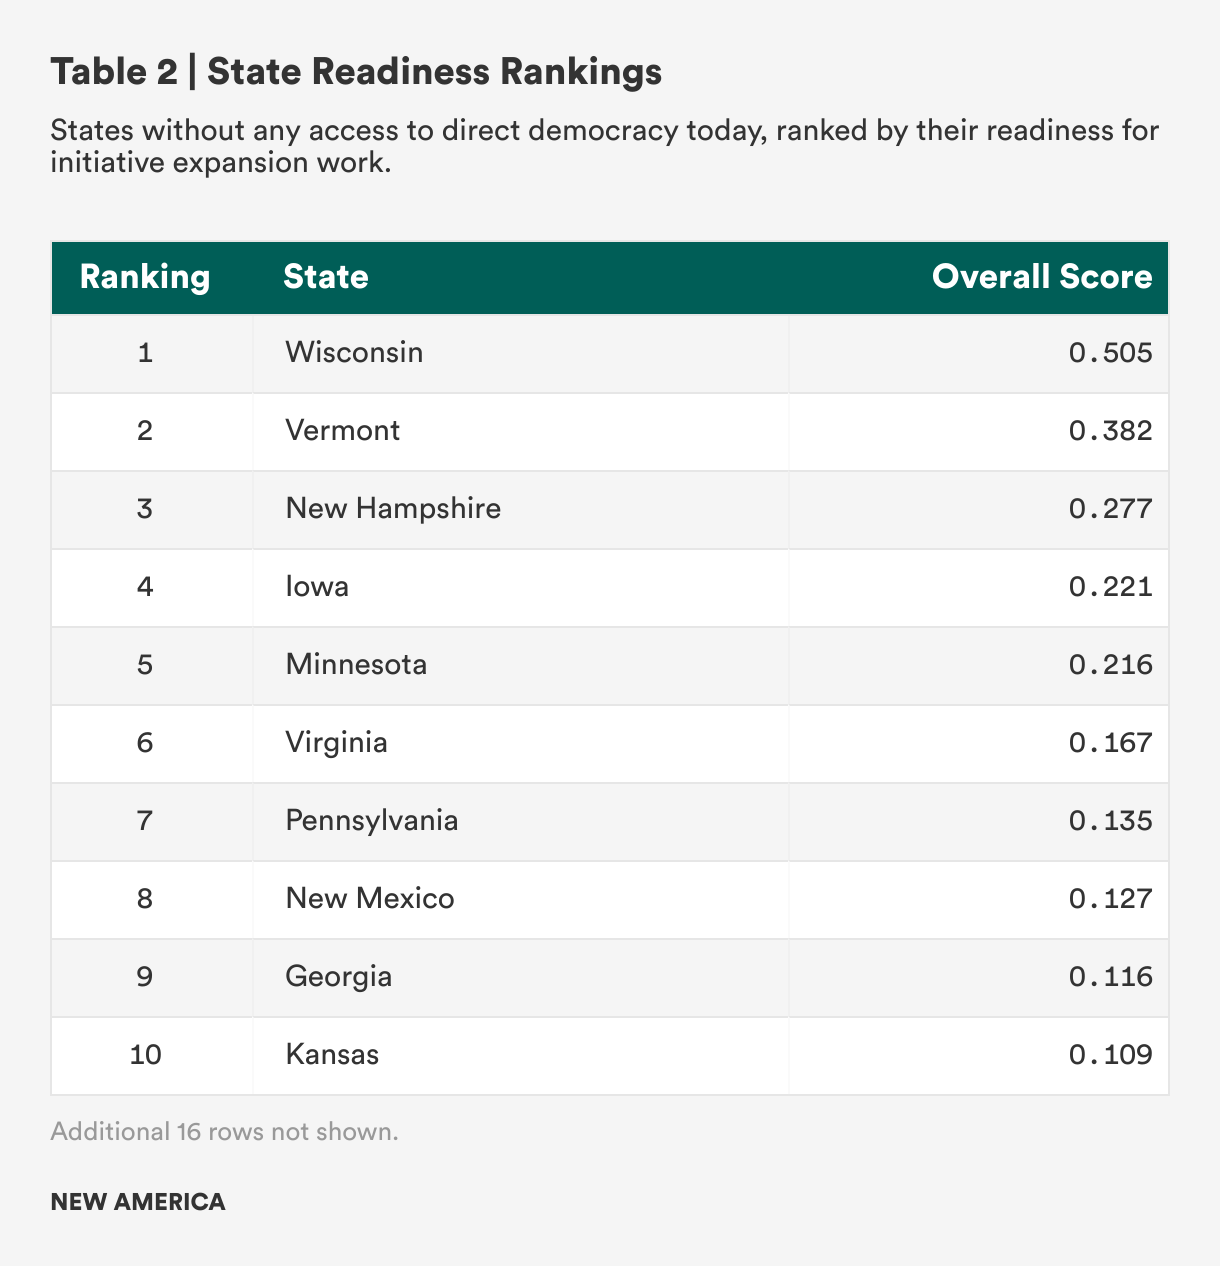
A closer look at the highest- and lowest-ranked states helps illustrate the logic behind the readiness matrix. Wisconsin ranks first overall among states without citizen-initiated ballot measures. Its high ranking is the result of being a swing state, which expresses itself through a close presidential margin of victory and the highest turnout rate in the 2024 presidential election, and consistently ranking among the lowest five states in various key indicators. For instance, Wisconsin has a divided legislature, which is an important predictor of the adoption of statewide direct democracy. This is reflected in the state having the third-lowest score when it comes to the majority party advantage in the state senate, the fourth-lowest score in the majority party advantage in the house, and the fifth-lowest scores in the majority party surplus in both the senate and the house. Wisconsin has the second-lowest level of congruence between mass public opinion and social policies and the fourth-lowest level of congruence between mass public opinion and economic policies. (Because direct democracy expansion is not yet a live issue in most states, we did not include indicators like active gubernatorial support in this round of scoring. However, Wisconsin is the only non-initiative state as of this writing whose governor is actively pro-I&R adoption, a fact that lends some credence to our method).
In the case of Vermont, it ranks second largely because it ranks highest in social capital variables, its population is mostly white (which is associated with a greater likelihood of adopting citizen-initiated measures), and the majority party in its legislature has a low seat surplus and total advantage.
In contrast, Hawaii ranks the lowest among states without citizen-initiated ballot measures. Hawaii is not a swing state, and it had the lowest presidential turnout rate. Democrats have a significant seat advantage and surplus in the state senate and house, with Hawaii having the third-highest majority party surplus of seats in both the senate and house and the third-highest majority party advantage in both chambers. The state legislature is also one of the least polarized among the states considered, and Hawaii ranks fourth in congruence between mass opinion and social and economic policies. These indicators suggest that, while not perfect, many of the state residents’ demands and preferences can be channeled through traditional electoral institutions.
Breaking Down the Readiness Ranking by Feasibility and Impact
The overall ranking presented in this section aggregates all the indicators into one score. The ranking, however, hides important variation in the state’s readiness based on feasibility or impact. For instance, whether a state ranks high on the list could be because it scores high on both the feasibility and impact indicators or because it scores very high in one or the other.
Figure 3 plots each state by its score on each dimension, with the feasibility on the horizontal axis and the impact dimension on the vertical axis. The plot reveals that, once the ranking is disaggregated by dimension, Vermont’s high ranking is mostly attributable to its high score on the feasibility dimension and not on the impact dimension. The plot is also helpful in identifying edge cases. North Carolina, for example, is close to being positive on the feasibility dimension.
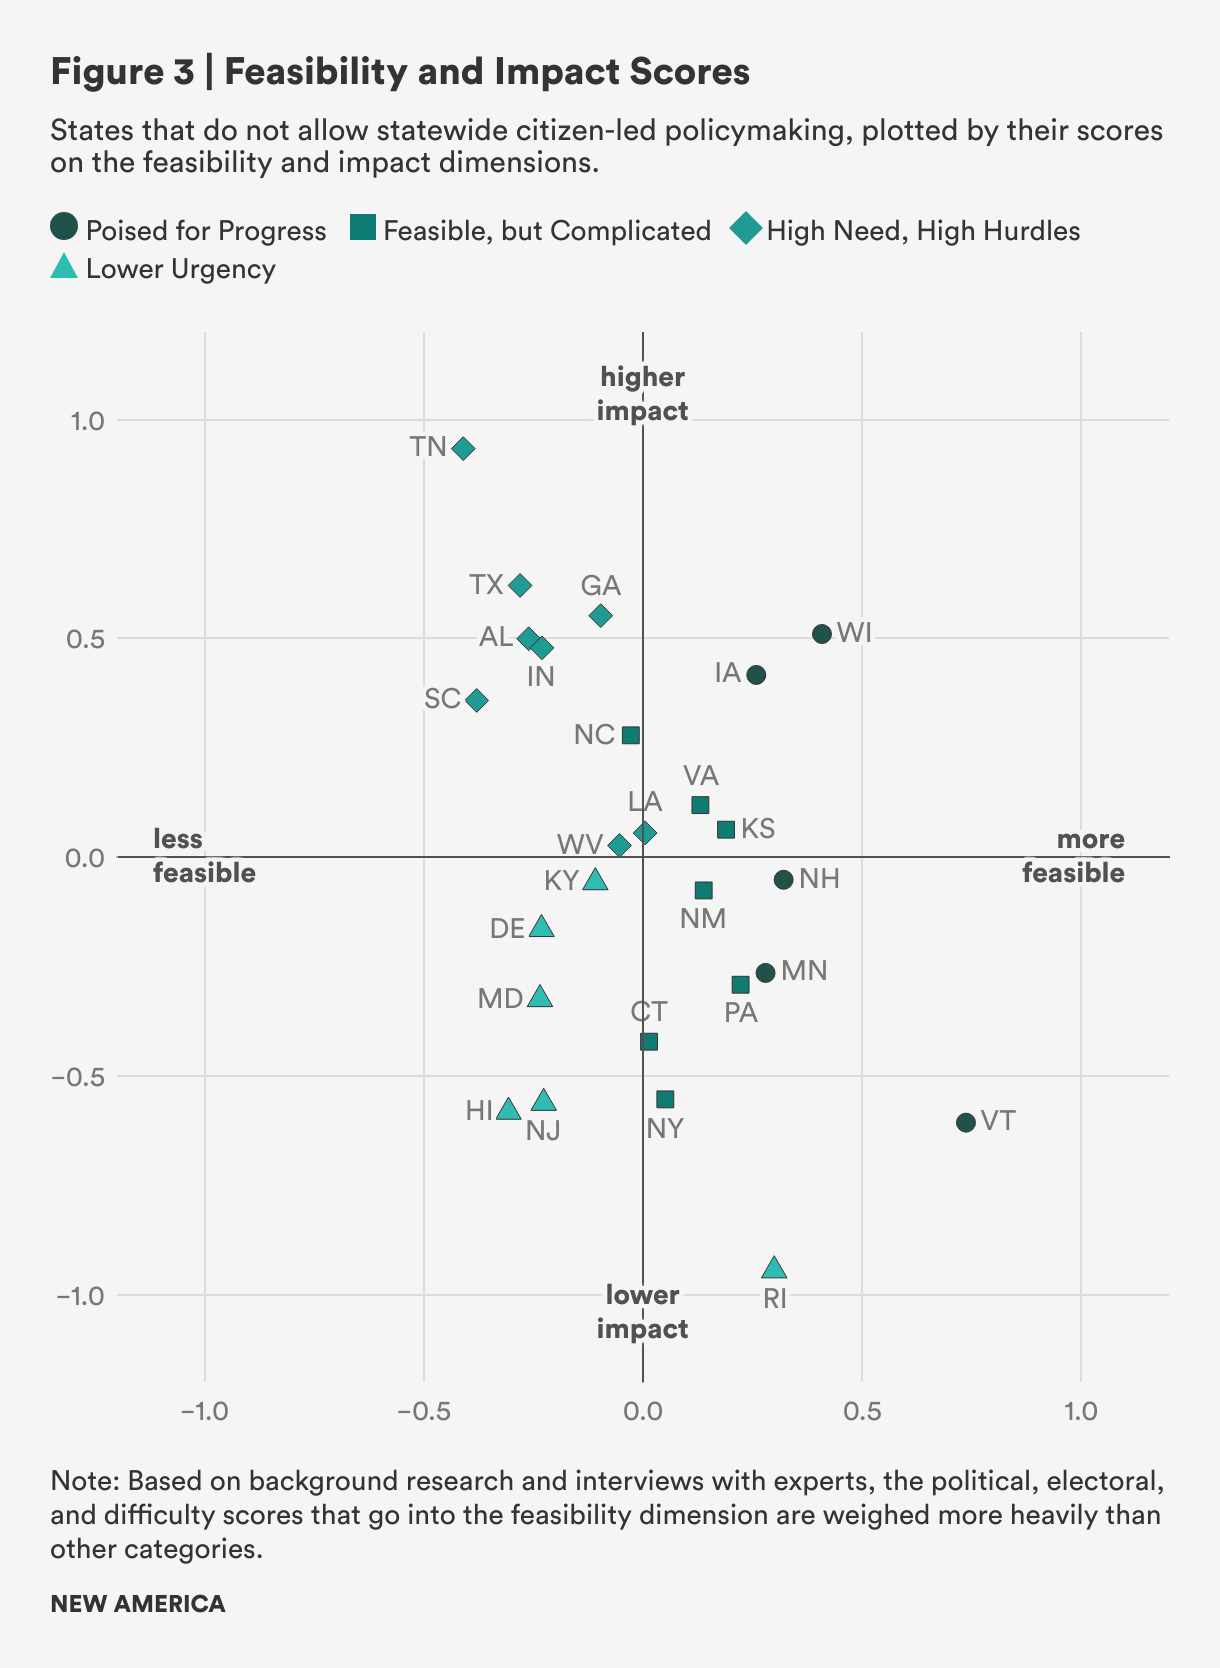
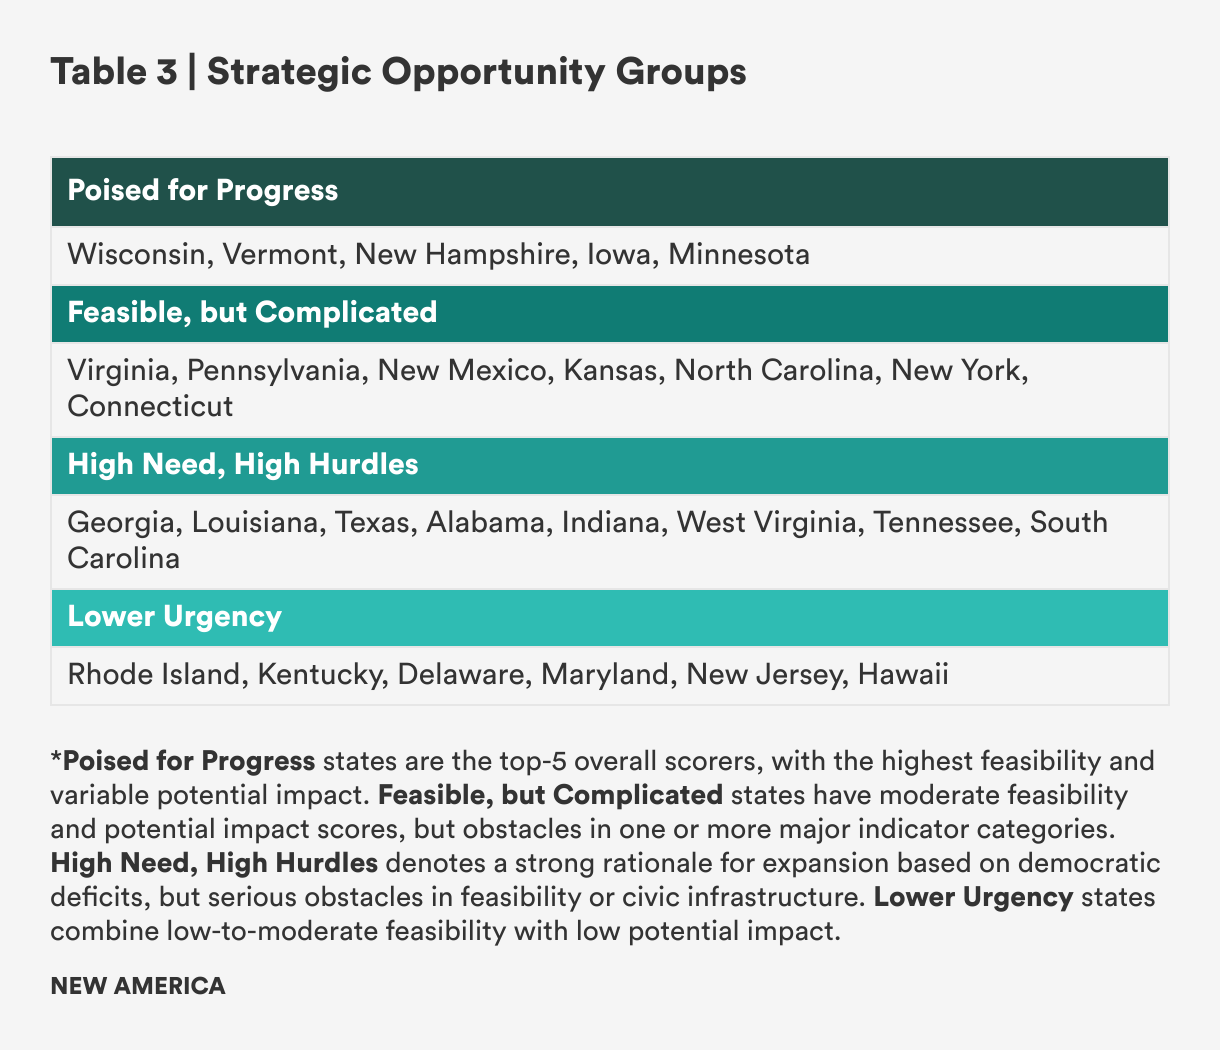
Since overall scores can mask some of this nuance, states were also sorted into four “Strategic Opportunity” groups based in large part on these disaggregated scores. As shown in Table 3 below, states in the “Poised for Progress” group are the top five overall scorers: These states boast the highest feasibility scores, making them strong candidates for near-term efforts despite variable impact scores. “Feasible, but Complicated” states have moderate feasibility and impact scores but face obstacles in one or more major categories, indicating that success is not out of reach but would require more time or investment. “High Need, High Hurdles” states face entrenched systemic challenges to feasibility, yet their high impact potential makes them important targets for longer-term movement-building and investment. Lastly, “Lower Urgency” states exhibit low-to-moderate feasibility but limited impact potential, suggesting that while barriers to legal reform are relatively low, there’s less strategic incentive or sense of urgency to pursue this type of reform.
This assessment should not be interpreted to mean that Wisconsin is necessarily the best equipped to execute an initiative adoption campaign or Hawaii the least. With enough public will and investment, every state is capable of running an effective amendment campaign. Given the relative lack of advocacy activity today (inside or outside government) to expand the map of initiative states, this methodology attempts to turn a somewhat blank canvas into a pencil sketch to be filled in as conditions on the ground evolve. Scores reflect baseline, quantifiable conditions, and we fully expect them to shift based on future research on the topic. Most importantly, they will also shift in response to emergent advocacy efforts.
Citations
- For example, see Devin Caughey and Christopher Warshaw, Dynamic Democracy: Public Opinion, Elections, and Policymaking in the American States (University of Chicago Press, 2022).
- Smith and Fridkin, “Delegating Direct Democracy,” source.
- Smith and Fridkin, “Delegating Direct Democracy,” source.
- Caughey and Warshaw, Dynamic Democracy.