Examining the Data: Assessing Poverty Through School Nutrition Funding and Participation

 The Federal Education Budget Project (FEBP), Ed Money Watch’s parent initiative, provides a wealth of state and school district level data on federal funding, demographics, and achievement through its website www.edbudgetproject.org. These data can tell important stories about how federal education funding interacts with student demographics and achievement. Moreover, the data often reveal rarely-discussed idiosyncrasies in federal funding and education. From time to time, Ed Money Watch will take a close look at one aspect of the data available through FEBP to highlight the value of this information.
This week, we’ll take a look at the free and reduced price lunch related data available through the FEBP database. These data reveal important details about student populations in states and school districts and how these details affect federal reimbursement rates. Data include federal funding for school nutrition programs including meals and commodities, the percent of students enrolled in free and reduced price meals, and the percent of students living in poverty.
The School Nutrition Program is the second largest federal program for schools (after Title I Part A – Education for the Disadvantaged), contributing more than $13 billion annually to schools to provide breakfast, lunch and snack to low-income students across the country. Additionally, while student poverty data are used to distribute Title I funds among school districts within a state, free and reduced price lunch participation data are used to distribute these funds among schools within a district.
We used the custom data comparisons tool on the FEBP website to produce a data table that paints an interesting picture of how these three data points interact within a state. Specifically, we performed a comparison of districts with student poverty rates within 10 percent of that in Cook County, IL and limited the districts to those with a total student population within 20 percent. Additionally, we asked the comparison tool to produce data on school nutrition funding, enrollment, free and reduced price participation, and student poverty. The output of this comparison is below.
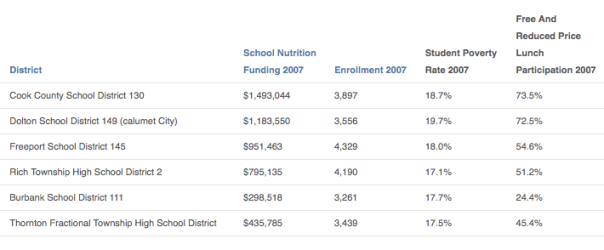
Although the student poverty rates in these six districts are very similar, their free and reduced price lunch participation (FRPL) rates vary dramatically. This is because the student poverty rate includes students living at or below the poverty level while the FRPL rate captures students living at or below 185 percent of poverty.
Thus, while Burbank School District has a FRPL rate close to its student poverty rate, Cook County’s FRPL rate is nearly 55 percentage points higher than its poverty rate. This means that Cook County has a significant number of students living between 100 percent and 185 percent of poverty, while only a few of Burbank’s students live within that margin of poverty.
This distinction also affects the rate of reimbursement districts receive for providing school meals. While students who live at or below 130 percent of poverty receive a fully subsidized lunch ($2.57 per meal), students living between 130 percent and 185 percent receive only a partial subsidy ($2.17). Because the majority of their eligible students live below 100 percent of poverty, a district like Burbank may receive a higher subsidy per eligible student than Cook County, where the majority of eligible students are somewhere between 100 percent and 185 percent of poverty.
However, that does not appear to be the case in these two districts. Using the data to estimate the number of FRPL eligible students and dividing the total federal reimbursement by that number, we can approximate the federal subsidy per eligible student in each district: $521 in Cook County and $375 in Burbank. This is possible for a couple of reasons.
The majority of eligible students in Burbank live below 100 percent of poverty, ensuring them the fully subsidy, while the vast majority of eligible Cook County students live above 100 percent of poverty. However, these Cook County students could live between 100 percent and 130 percent of poverty, as opposed to between 130 percent and 185 percent of poverty, similarly ensuring them the same subsidy as those living at or below 100 percent of poverty.
Additionally, districts receive a $.24 subsidy for every full-priced meal they sell to cover administrative costs. Districts that have managed to lessen the stigma attached to school lunch may benefit substantially from this subsidy because more high-income students may choose to purchase lunches. This would also result in a higher subsidy per eligible student.
While we can’t determine which of these two (or a combination) situations is at play in Cook County and Burbank, we have been able to derive a significant amount of information about the student population in these two districts by examining just four data points. Additionally, the FEBP comparison tool allows us to see what other districts in Illinois and across the country have large populations living at the margin of poverty between 100 percent and 185 percent and how that affects the subsidies they receive for school nutrition programs. As Congress considers reauthorizing the Child Nutrition Act in 2010, these data can be used to give insight into how proposed significant changes in the program, such as eliminating the reduced price subsidy, may affect school districts and their low-income students.
More About the Authors
Issues
Related

Accreditation on the Ground: A Q&A with Heather Perfetti