Findings
A series of forest plots represent our meta-analysis results for the selected TAACCCT grant evaluation studies. Figure 1 portrays educational outcomes, comprising program completion and credential completion, across 32 evaluation reports containing 41 effect sizes. The number “treated” by TAACCCT participation total 38,589 observations. Figure 2 illustrates an overall positive effect of TAACCCT participation on education outcomes (ESOR = 1.905; z = 5.18, p < 0.001).
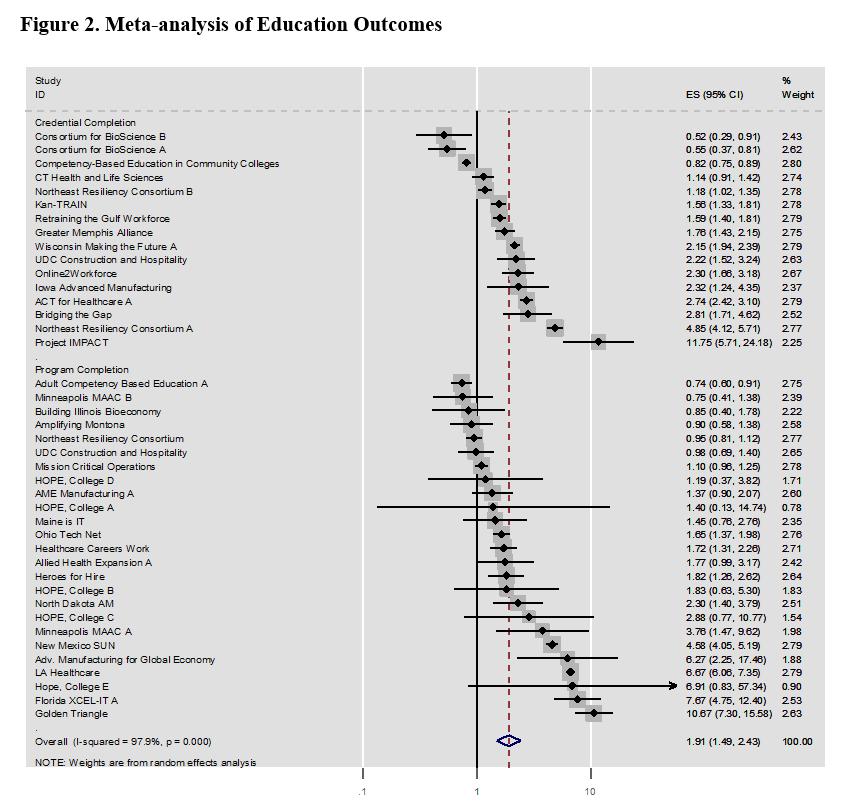
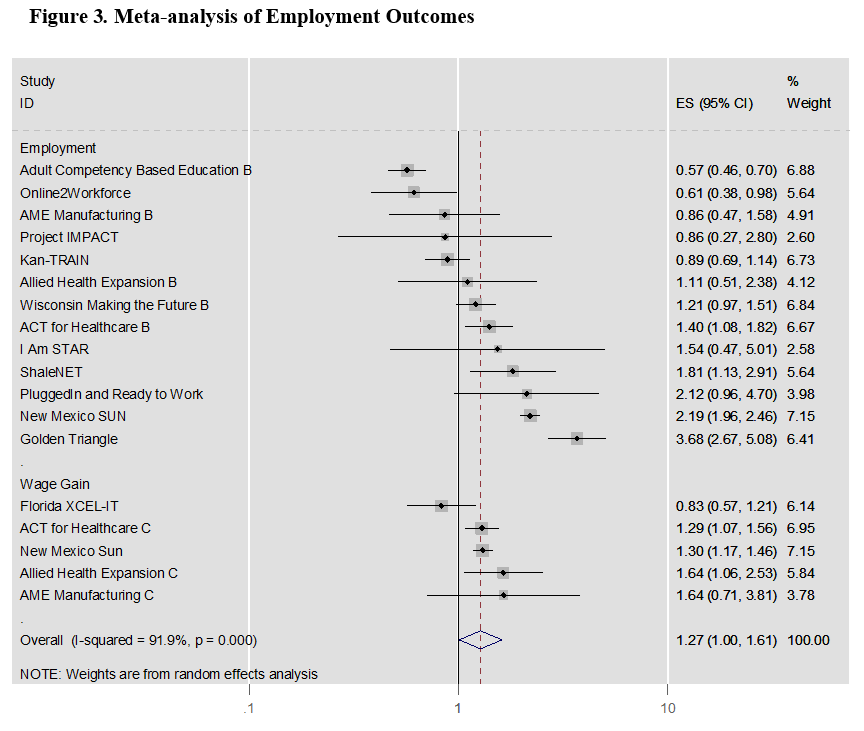
Figure 3 portrays a similar, positive effect of TAACCCT participation relative to the odds of employment outcomes. Of the 15 evaluation reports from which 18 effects were identified and included in the meta-analysis, TAACCCT participation was associated with statistically significant and positive increase in the odds of employment outcomes (ESOR = 1.273; z = 2.00, p = 0.046). These 18 employment-related effects comprised 8,870 TAACCCT observations.
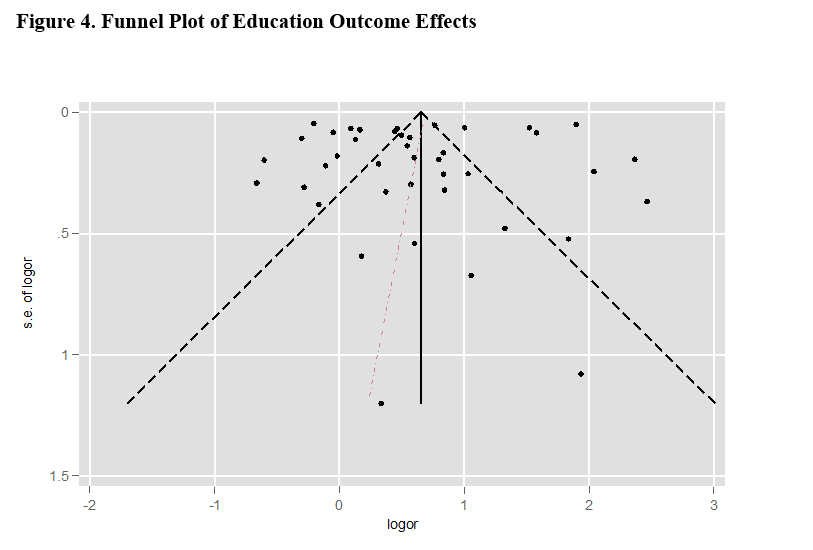
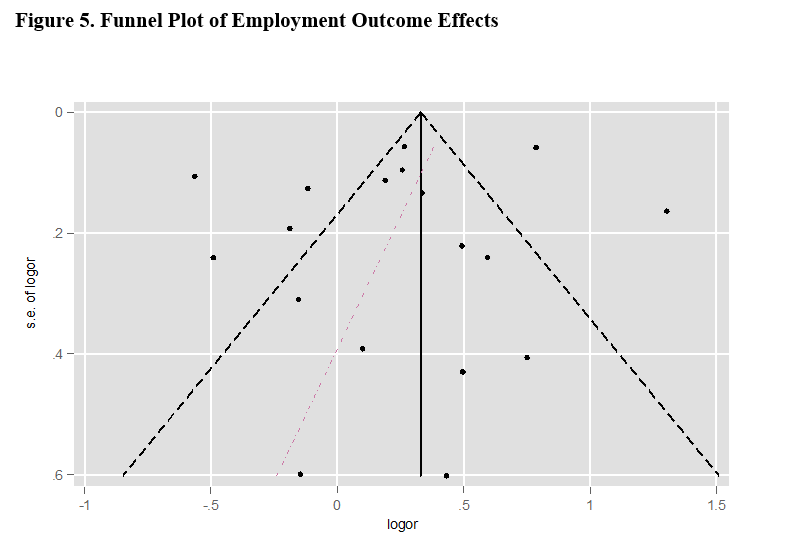
Funnel plots were used to test for biased results for educational and employment outcomes separately (Figure 4). In the traditional sense publication bias can be considered moot here because our meta-analysis is comprised of evaluation reports not published in peer-refereed journals. However, publication bias could be relevant nonetheless because of the pressure evaluators face to report positive, statistically significant findings (Scriven, 2001). In other words, TAACCCT evaluators could have included only positive significant results of program participation and suppressed or omitted negative findings. An asymmetric distribution of effects in a meta-analysis funnel plot suggests publication bias; the funnel plots generated for the education outcomes (Figure 4) and employment outcomes (Figure 5) suggest no visual asymmetry (i.e., bias) in how effects in the evaluation reports. The commonly used Egger test (Egger et al., 1997) provides evidence of this lack of bias for both education (-0.381, t = -0.21, p = 0.832) and employment (-1.140, t = -0.80, p = 0.438) outcomes.
In addition to examining the possibility of biased results in the TAACCCT evaluation reports included in this meta-analysis, an I² statistic was calculated to gauge heterogeneity across the education and employment effects. The I² statistic provides a "measure of inconsistency in the studies' results" and captures the percentage of total variation across studies due to heterogeneity rather than chance (Higgins & Thompson, 2002). TAACCCT evaluation reports of varying sample sizes, study designs, and outcome measures means the I-squared measure is well suited to gauge heterogeneity since the measure was developed for these common characteristics (Higgins et al. 2003). Heterogeneous effects appear to be a characteristic of the education (97.9%, p < 0.001) and employment (91.9%, p < 0.001) outcomes.
The Appendix provides a summary of results of all studies by grant title, author(s), comparison sample, total analytic sample size, and effects size and also standard error by outcome for each study. This summary table provides a concise overview of the educational outcomes in the meta-analysis, including program completion and credential completion, and employment outcomes meta-analysis, including employment and wage change.
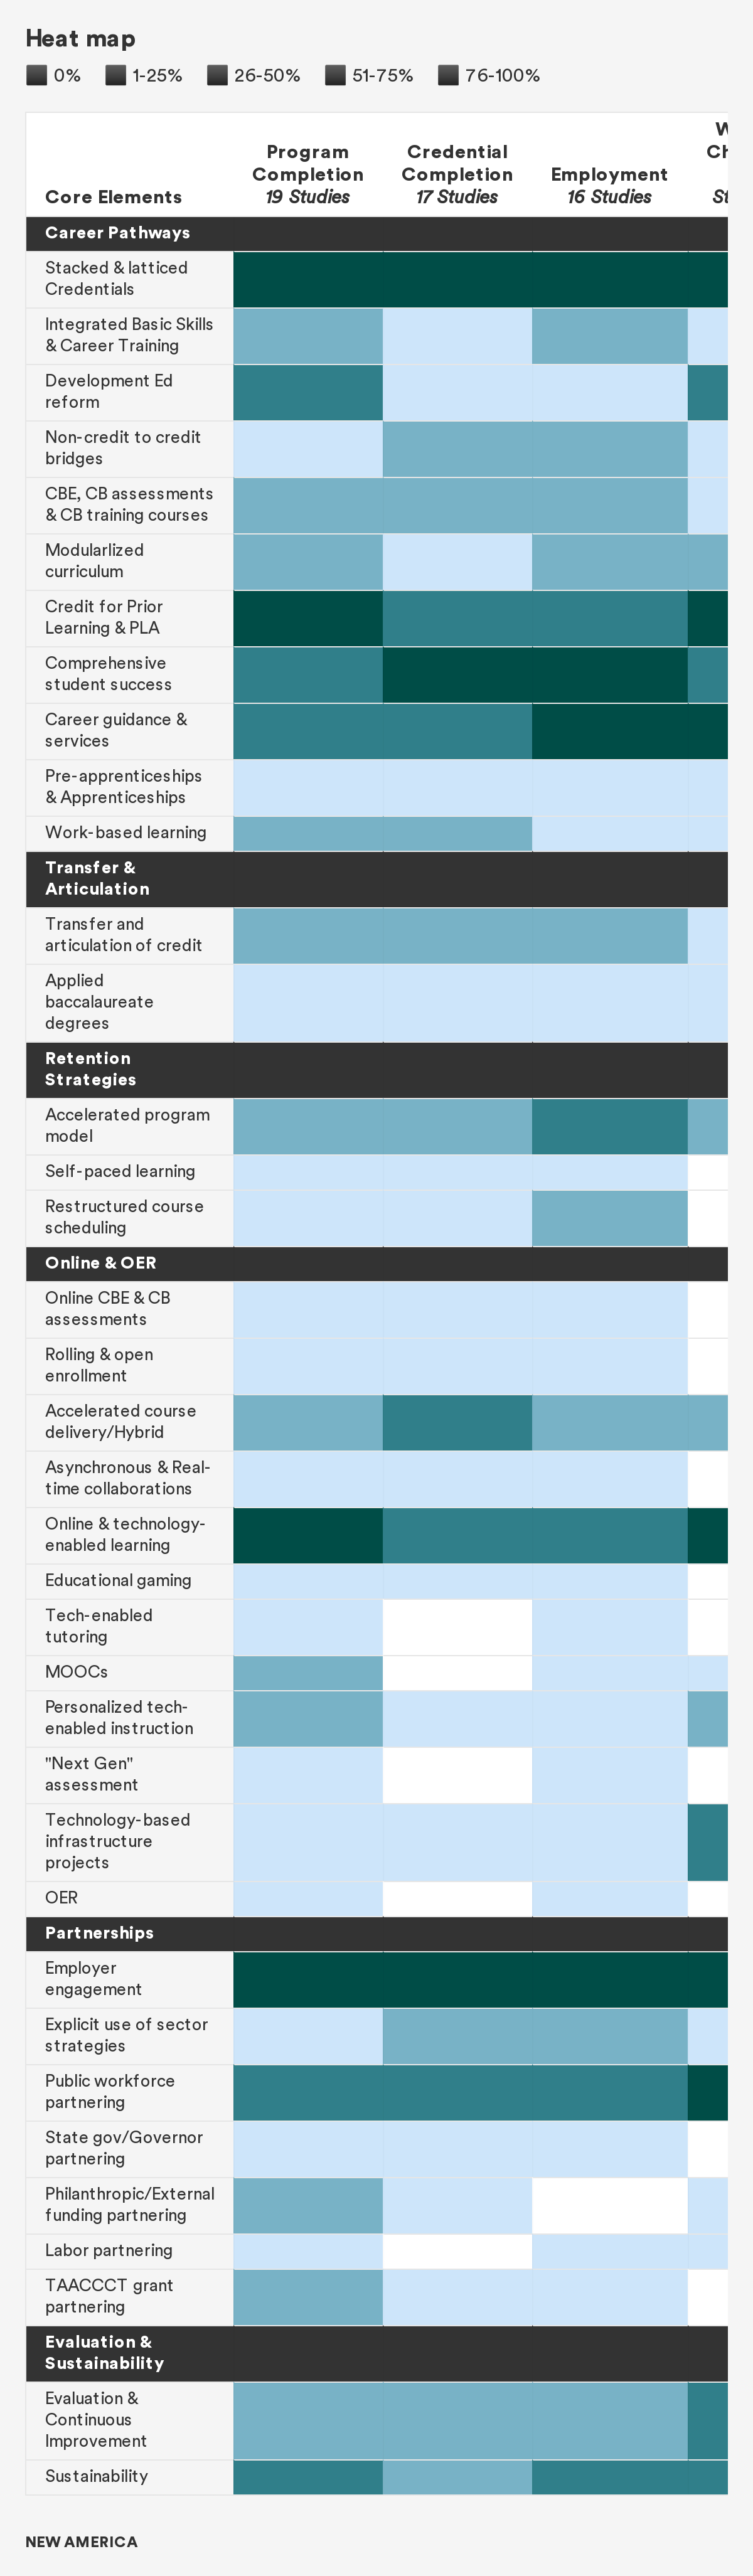
The final analysis conducted as part of this meta-analysis was a content analysis of the core elements purported by third-party evaluators to be implemented in the TAACCCT grants. This analysis involved two members of the research team independently reading and coding the grants using a rubric that identified SGA-specified core elements of all four rounds of the TAACCCT grants. Table 2 shows these results in the form of a “heat map,” which is a common way of visually displaying results associated with meta-analysis. Heat maps supplement meta-analysis studies by presenting the incidence of implementation of program elements, as used in our approach. In our case, the evaluation studies refer to core elements as part of a theory of change as well as planned implementation and provide varied levels of detail as to the extent to which they were actually implemented. Therefore, these heat maps should be interpreted as providing insights into core elements that may have some level of relationship to the average effects of the meta-analysis studies but not providing irrefutable evidence of impact.
The heat maps associated with this study show the prevalence of core elements implemented in TAACCCT grants. Occurring most frequently in these grants is core elements associated with career pathways, specifically stacked and latticed credentials, prior learning assessment (PLA), comprehensive student supports, and career and employment services and supports. Several core elements in the grant are associated with online learning, assessment, and open educational resources (OER), online and technology-enabled learning and, to a lesser extent, accelerated online learning. Also prevalent in the grants is employer engagement and workforce agency partnerships. Sustainability and evaluation are also documented in the grants. Taken together, these core elements give a sense of the grant-funded core elements and strategies that were implemented in programs funded by TAACCCT. They are not presumed to cause the positive outcomes but they are potential contributors to impact, and they deserve consideration in future evidence-based federal investments such as TAACCCT.